
|
 |
 |
 |
 |
 |
 |
 |
 |
 Proactive Market Timing Proactive Market Timing
|
|
|
Most Recent PMT vs SPX Performance Chart

|
|
|
|
Wednesday, October 28, 2015, 1700CT
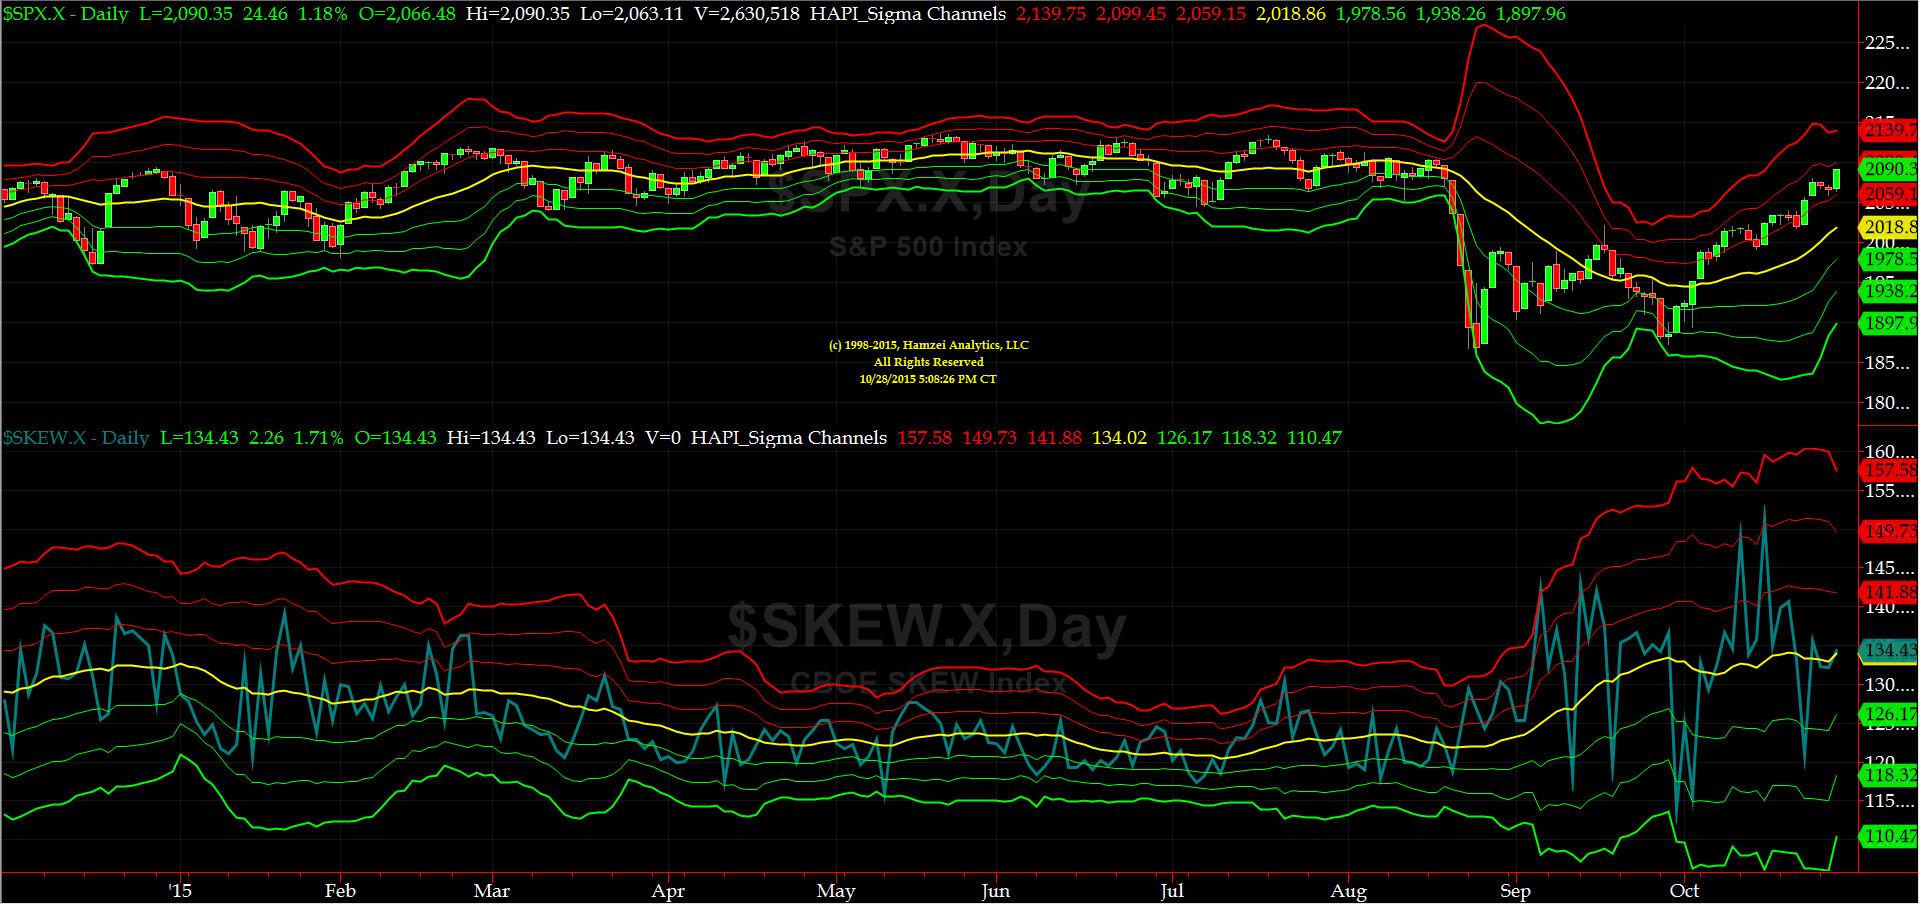
SPX SKEW (Tail Risk) Chart
Tonight, after the close, SPX SKEW (Tail Risk) came in at its flat zero sigma line (134). IOHO, the Tail Risk is slowly subsiding.
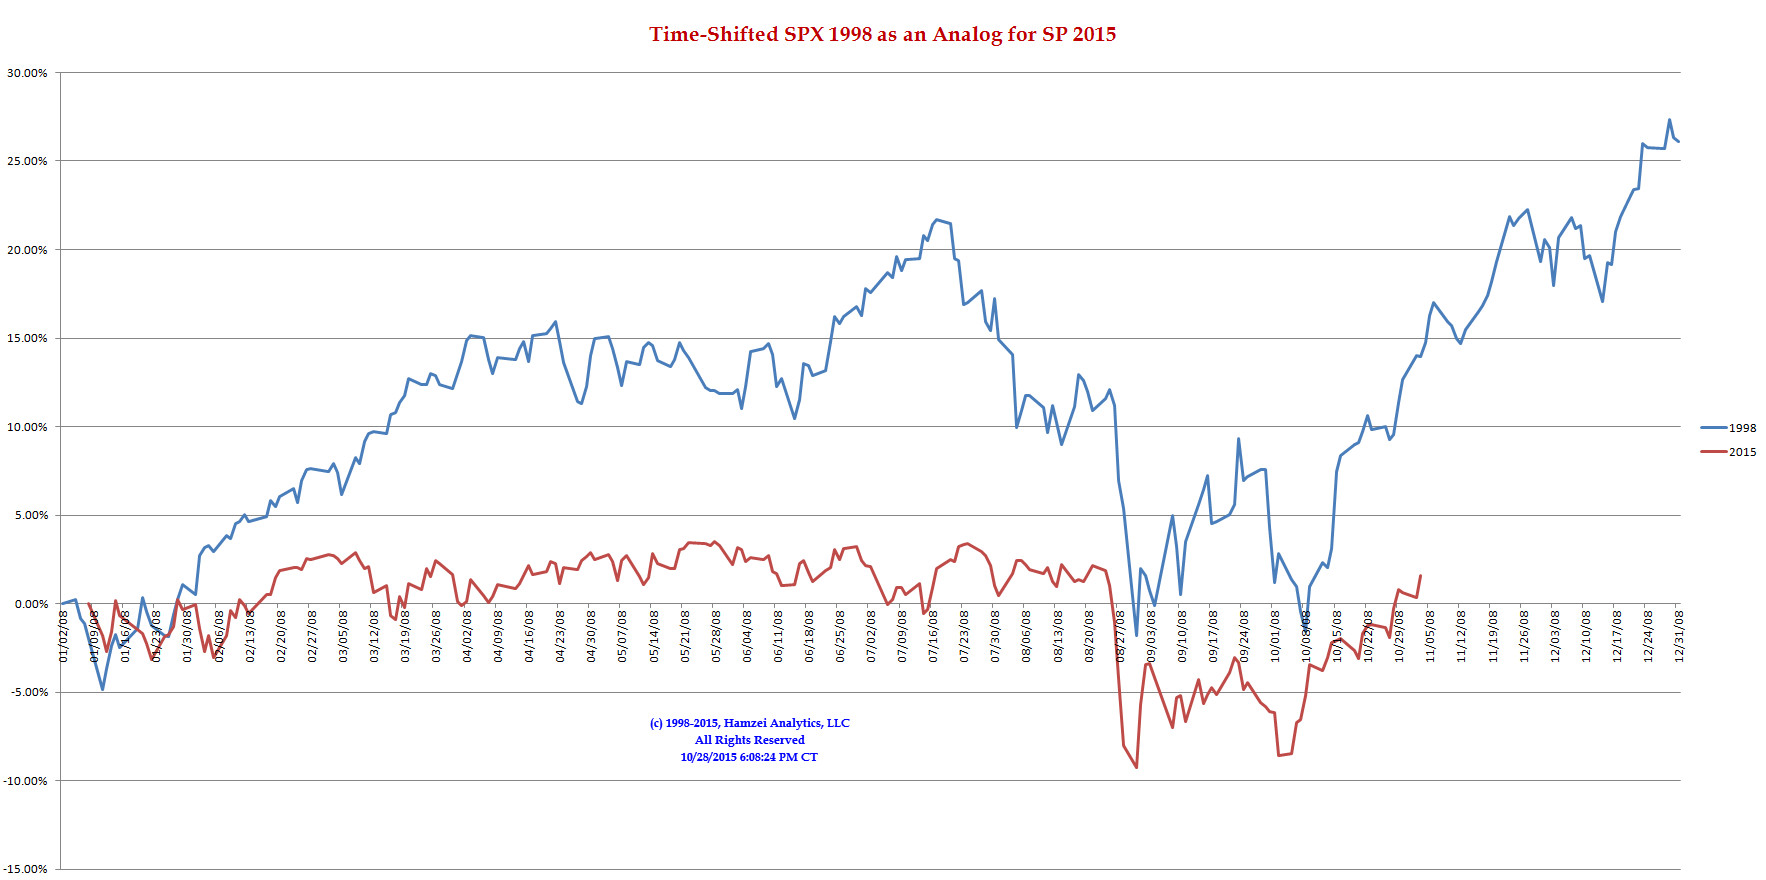
SPX 1998 Time-Shifted Analog for SPX 2015
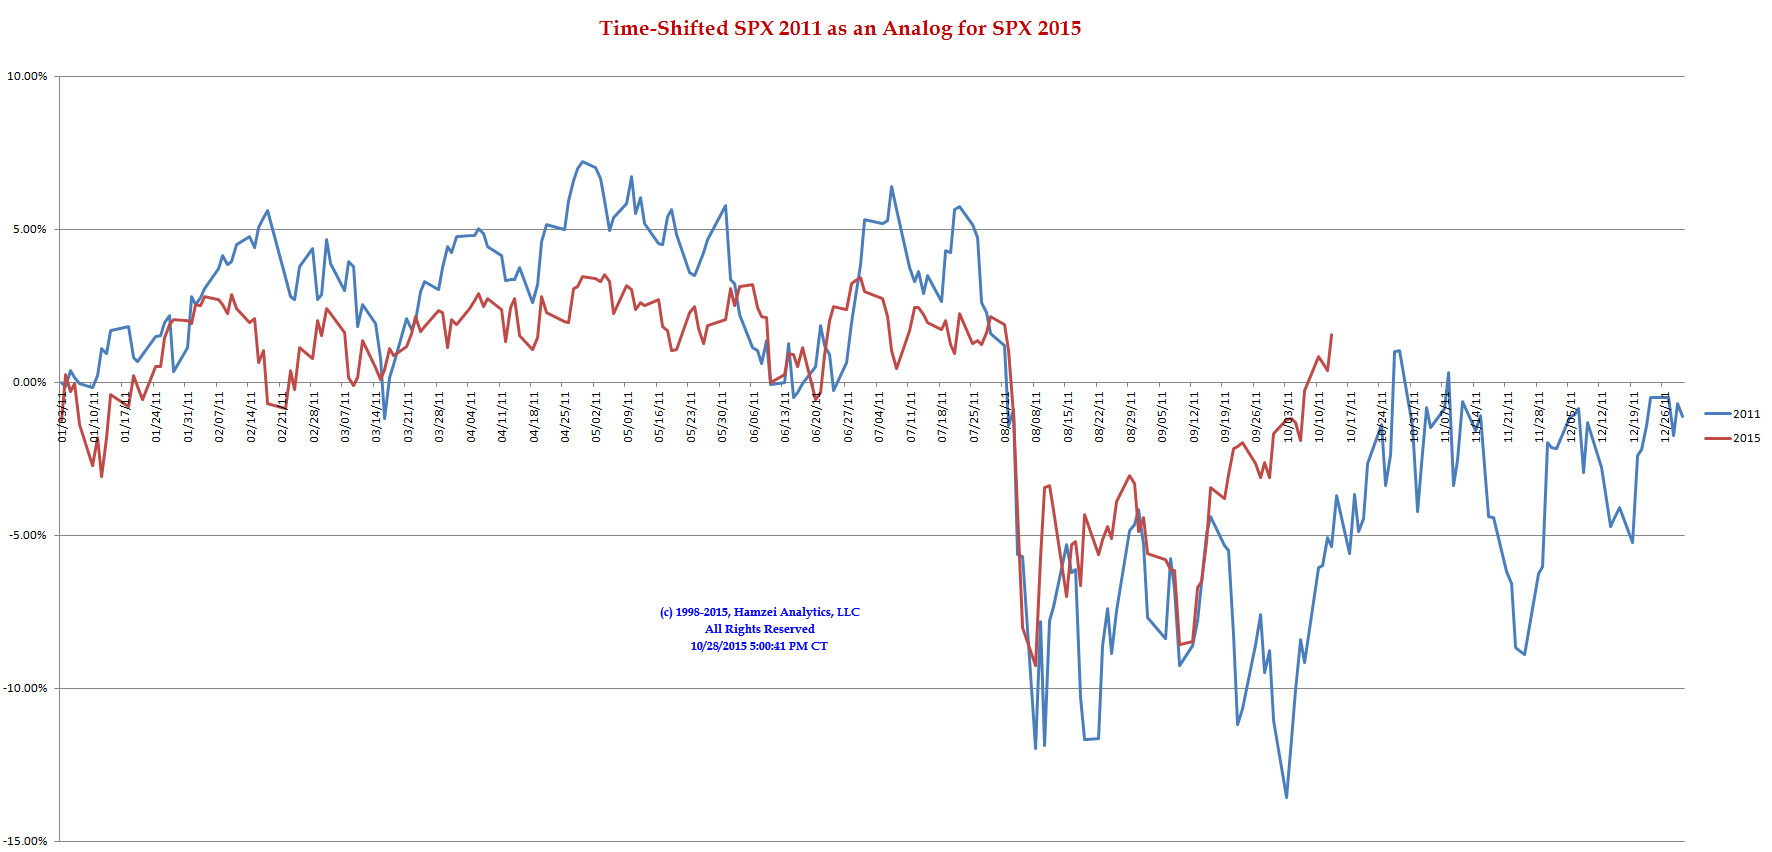
SPX 2011 Time-Shifted Analog for SPX 2015
As you can see from the most recent price-action data, there is no reason for us to completely abandon the 2011 Analog, and solely concentrate on 1998 Analog. For the next few weeks, both analog charts we will be presented here. It is also worth noting that today, we were very encouraged by RUT break out and its flash message: RISK ON...
|
|
|
|
|
|
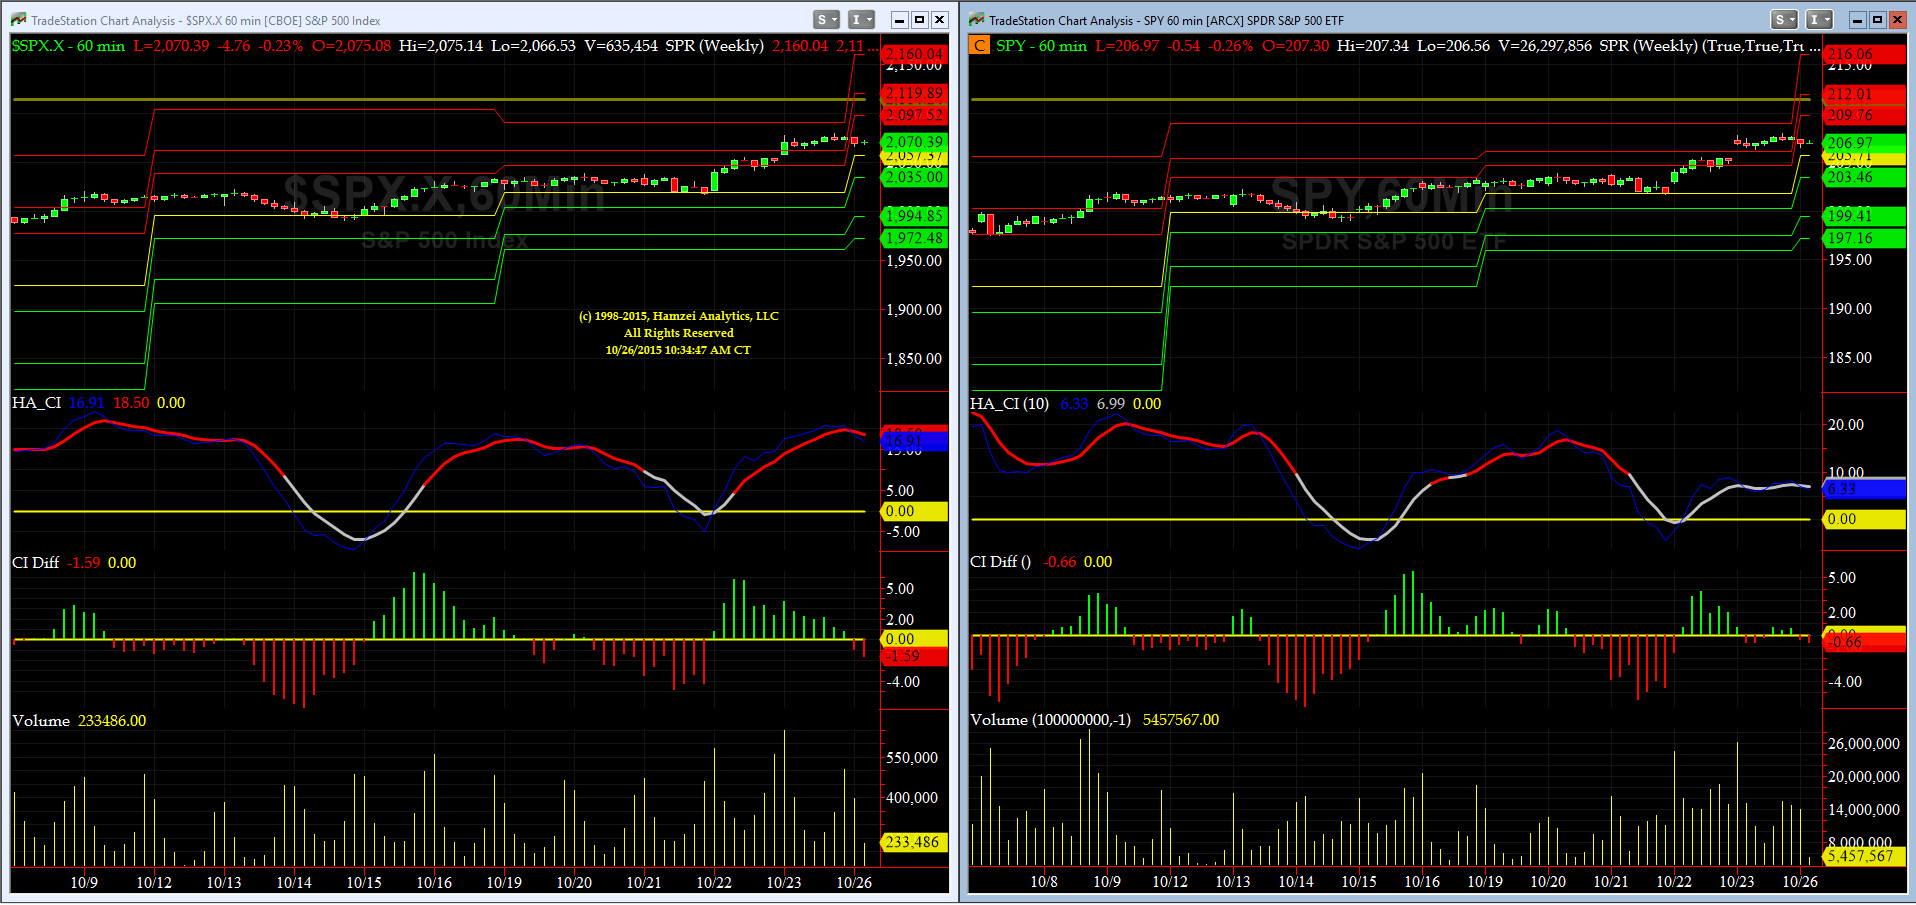
Monday, October 26, 2015, 1000CT
Companion Chart for Market Bias Review, Issue #116
|
|
|
|
|
|
Sunday Night, October 25, 2015, 2030CT
Market Bias Review, Issue #116
Most recent S&P-500 Cash Index (SPX): 2075.15 up +42.04 (up +2.07%) for the week ending on Friday, October 23rd, 2015, which again closed at its +1.5 sigma.
SPX ALL TIME INTRADAY HIGH = 2134.72 (reached on Wednesday, May 20th, 2015)
SPX ALL TIME CLOSING HIGH = 2130.82 (reached on Thursday, May 21st, 2015)
Current DAILY +2 Sigma SPX = 2096 with WEEKLY +2 Sigma = 2169
Current DAILY 0 Sigma (20 day MA) SPX = 1992 with WEEKLY 0 Sigma = 2037
Current DAILY -2 Sigma SPX = 1887 with WEEKLY -2 Sigma = 1905
50-Day MA SPX =1980 or +4.8% below SPX (max observed in last 5 yrs = +8.6%, min = -9.3% )
200-Day MA SPX = 2060 or +0.7% below SPX (max observed in last 5 yrs = 15.2%, min = -14%)
VIX = 14.46 which closed Friday at its -1 sigma (remember it�s the VIX�s vol pattern (its sigma channels) that matters, and not the level of VIX itself (this is per Dr. Robert Whaley, a great mentor and the inventor of original VIX, now called VXO. VIX usually peaks around a test of its +4 sigma)
NYSE McClellan Oscillator = +128 (-150 is start of the O/S area; around -275 to -300 area or lower, we go into the �launch-pad� mode, over +150, we are in O/B area)
NYSE Breadth Thrust = 57.33 (40 is considered as oversold and 65 as overbought)
WEEKLY Timing Model = on a SELL Signal since Friday 8/7/15 CLOSE (first time in 32 months)
DAILY Timing Model = on a BUY Signal since Tuesday 10/6/15 CLOSE
Max SPX 52wk-highs reading last week = 57 (over 120-140, the local maxima is in)
Max SPX 52wk-Lows reading last week = 14 (over 40-60, the local minima is in)
HA_SP1 = at just about its +1.5 Sigma
HA_Momo = +5.10 (reversals most likely occur above +10 or below -10)
HA_SP2 = 81.9(Buy signal <= 20, Sell Signal >= 80)
3-mo. VX Futures Spread (long NOV short FEB) = -1.84 (-3 to -2.5 SELL signal, 0 BUY Signal)
SPX SKEW (Tail Risk) = 135 (normal = 120-125, range 100-150)
Our current SPX Bias with Timer Digest: LONG SPX as of Tuesday, October 20th, 2015 Close at 2030.77
Our previous Bias: SHORT SPX (since Tuesday, October 6th, 2015 Close at 1979.92)
This WEEK�s Bias = LONG SPX Complex via Long Call Spreads as we witnessed the mother of all ER Beats by MSFT, AMZN & GOOGL Thursday after the Close. Tuesday is key with AAPL reporting (TWTR, BIDU & SBUX also report this week but they have too small of a market caps to make a big difference either way).
SPX Profit Target = 2125
SPX Money Management Stop = 2055
BOTTOM LINE: Still we have a tough trading period in the next 3 to 4 weeks.... Always watch your bet size, and, no need to be a cowboy.
NOTE: All LEVELS mentioned here have been, are, and will be, based on the S&P-500 SPX Cash Index, and not the ES Futures. Tomorrow after the first hour is complete, we will post here a companion chart showing critical short-term WEEKLY levels to watch for possible �retest failures.�
Fari Hamzei
|
|
|
|
|
|
Sunday, October 25, 2015 2000CT
Market Timing Charts & Comments
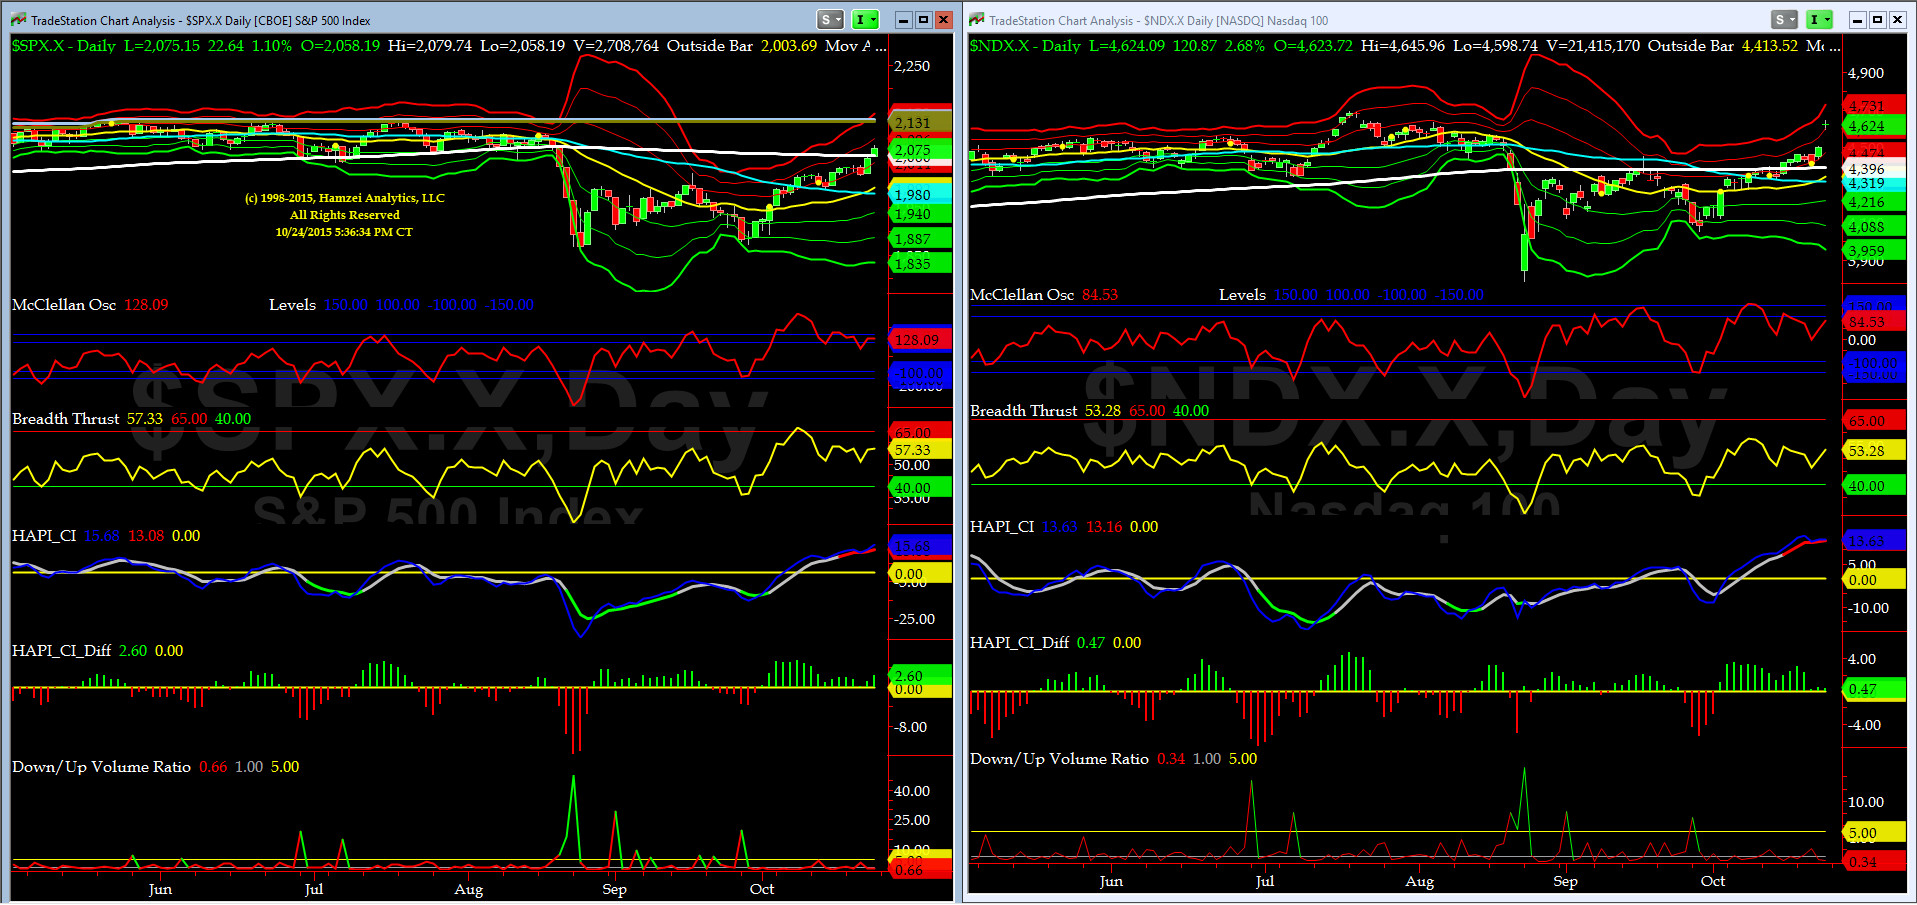
Timer Chart of S&P-500 Cash Index (SPX)
SPX continued its channel breakout from last week, thanks to FED and punched thru its 200-Day MA. Institutional cash will pour in now. STAY LONG sailors!
On Friday NYSE McClellan Osc closed +128 (divergence with Cash continues) but now it is NOT short-term overbought (it's below +150).
NYSE Breadth Thrust came in at 57 and also continues its divergence with Cash.
Keep an eye on its CI (has positive slope and but it is red now(>+10)).
We see almost the same pattern for NDX, but due the trifecta of MSFT, AMZN & GOOGL superb earnings reports, it had a moon shot to above its +2 sigma.
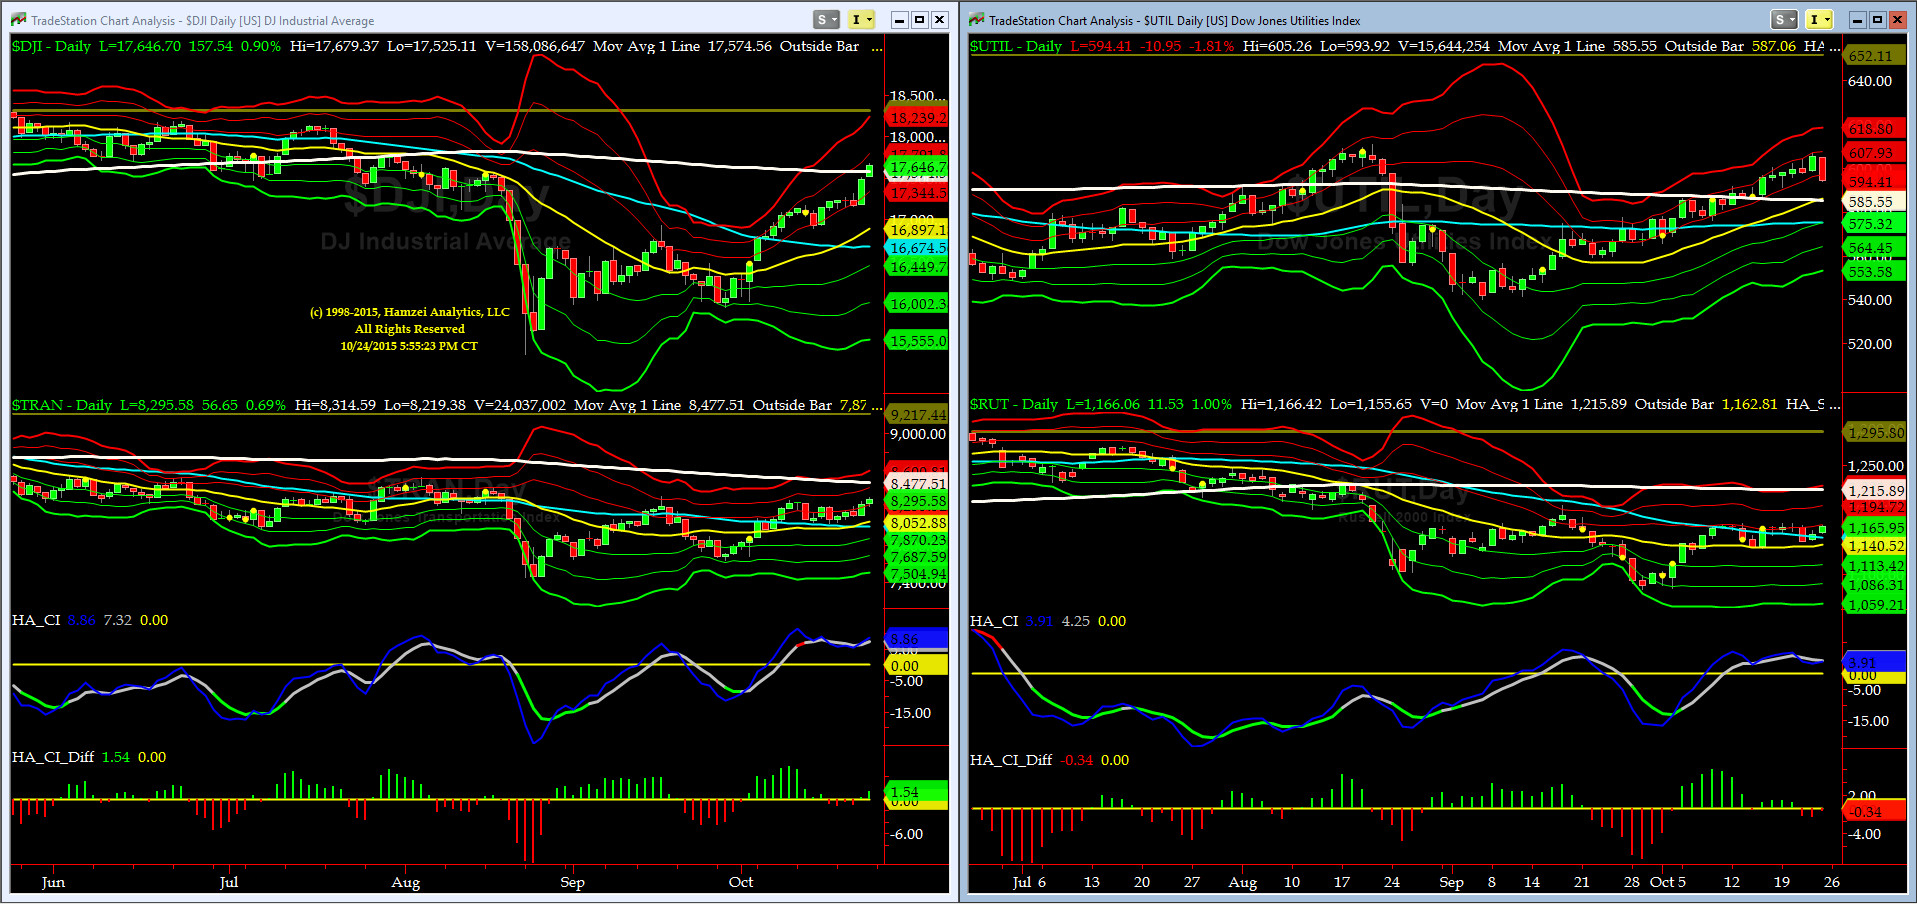
Canaries [in the Coal Mine] Chart for DJ TRAN & RUT Indices
What is note worthy this week was the breakout by DJ Transports (proxy for economic conditions 6 to 9 months hence). We are waiting for Russell 2000 Small Caps (RUT) to do the same this coming week.
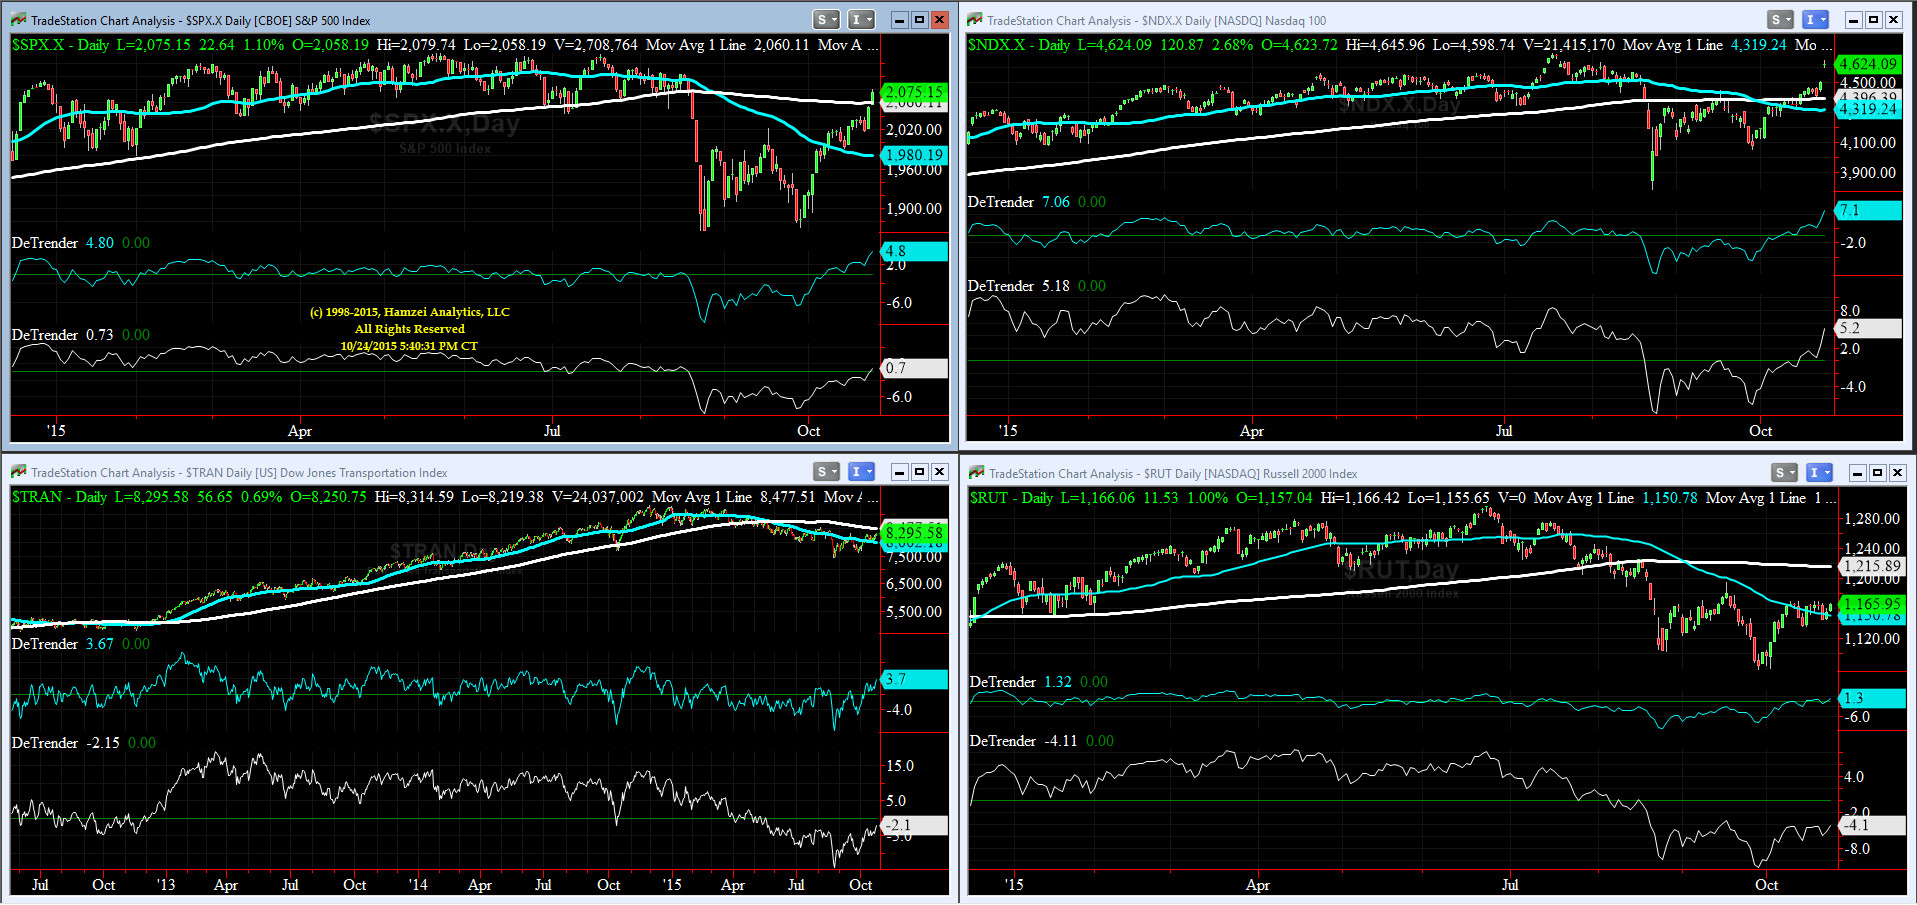
DeTrenders Charts for SPX, NDX, TRAN & RUT Indices
50DTs are positive for all four indices covered here SPX, NDX, DJ TRAN & RUT, while only two of our 200DTs are positive (SPX & NDX).
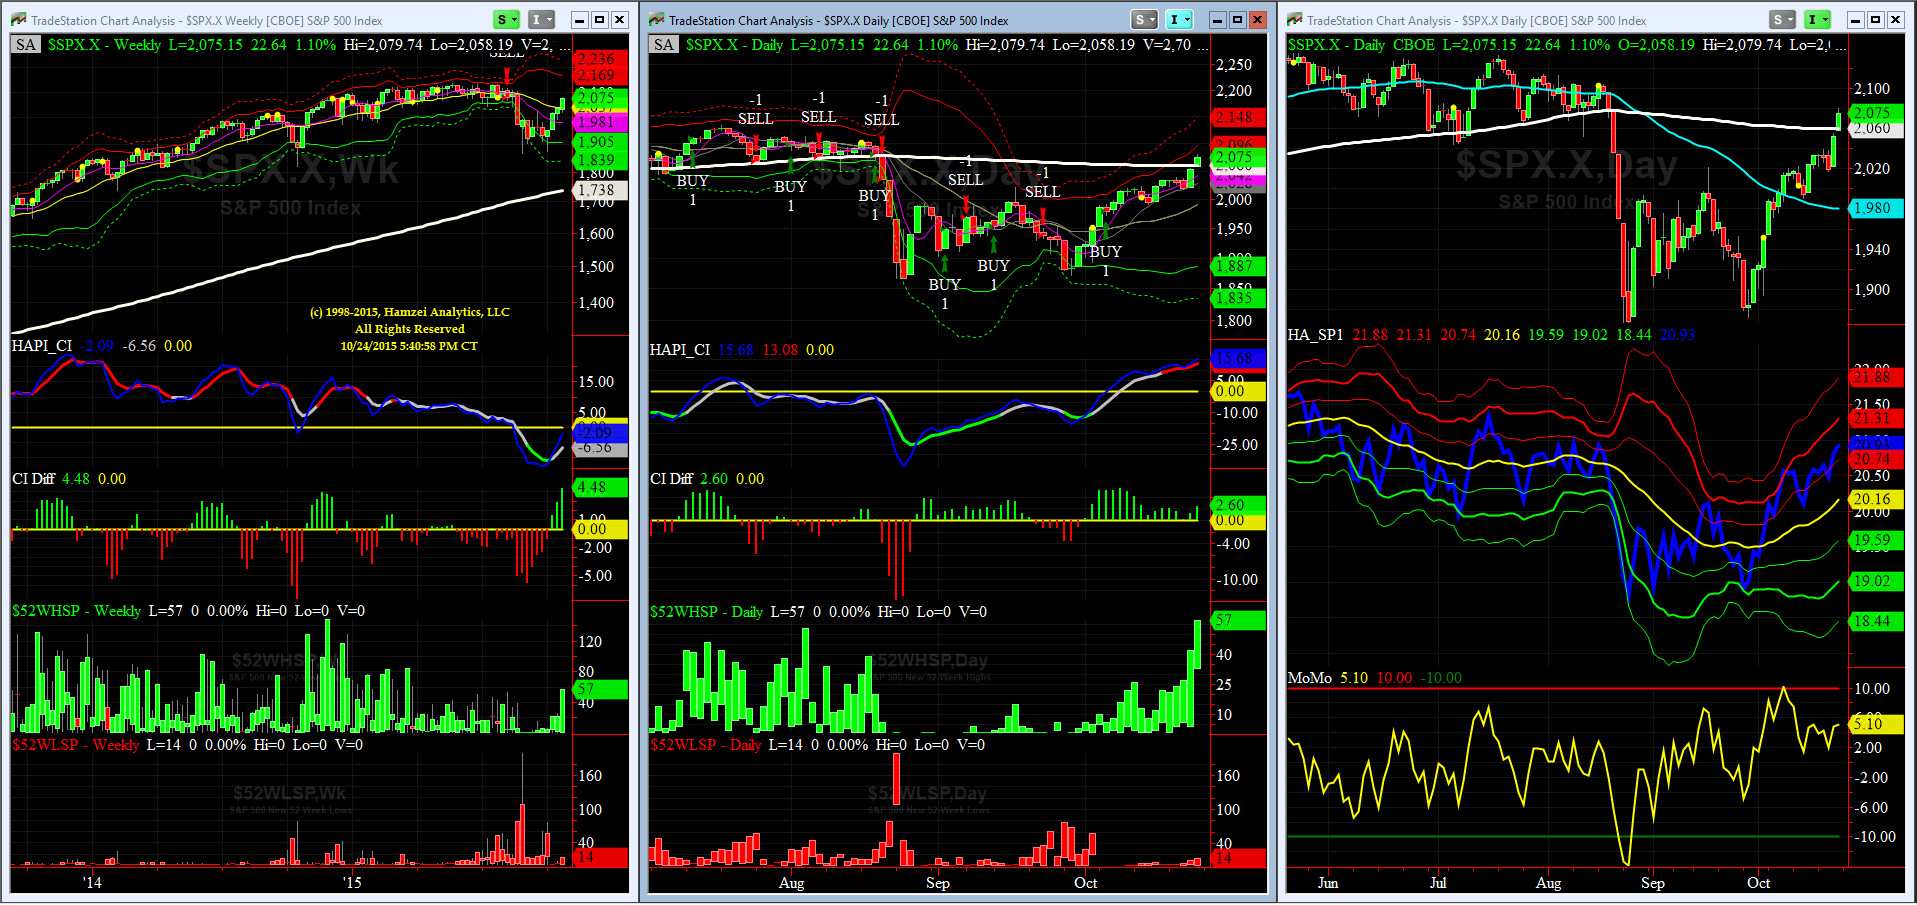
HA_SP1_momo Chart
We are on SELL (WEEKLY Timing Model) & BUY (DAILY Timing Model) as of Tuesday, October 6th.
HA_momo, at +5.10, is also in divergence with SPX Cash & HA_SP1.
Note New 52week Highs exploded to 57 on Friday.
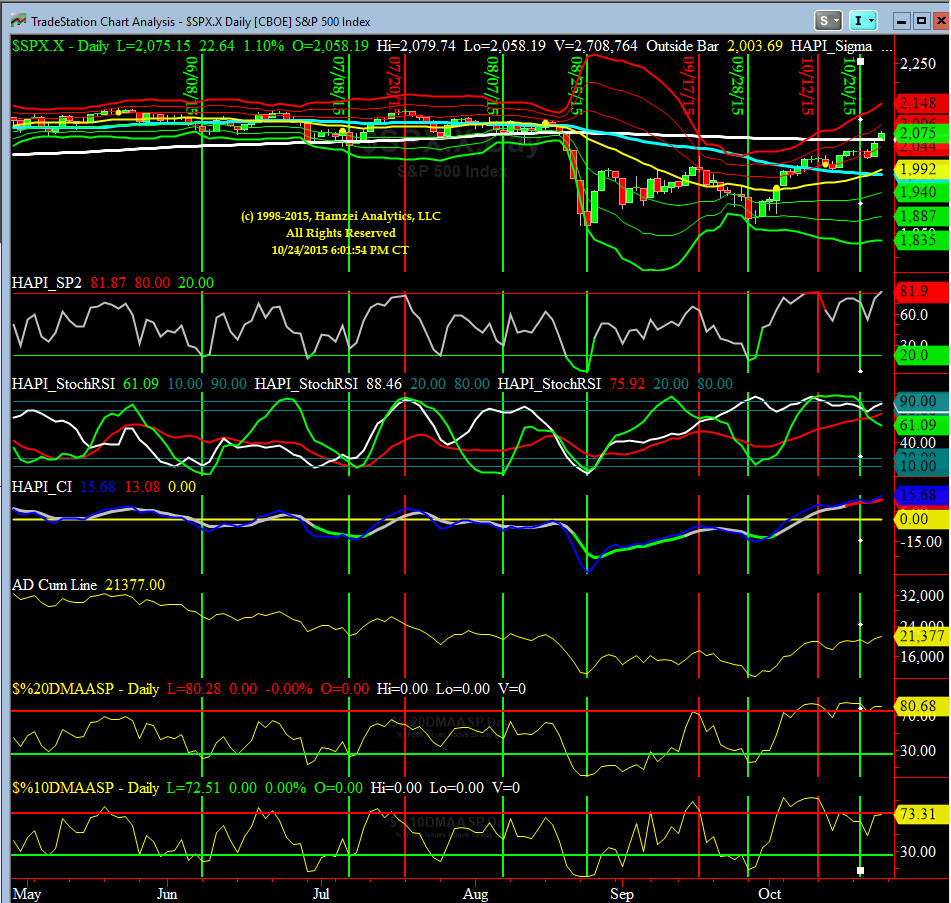
HA_SP2 Chart
At almost 82, this prop indicator is no longer in divergence with SPX Cash.
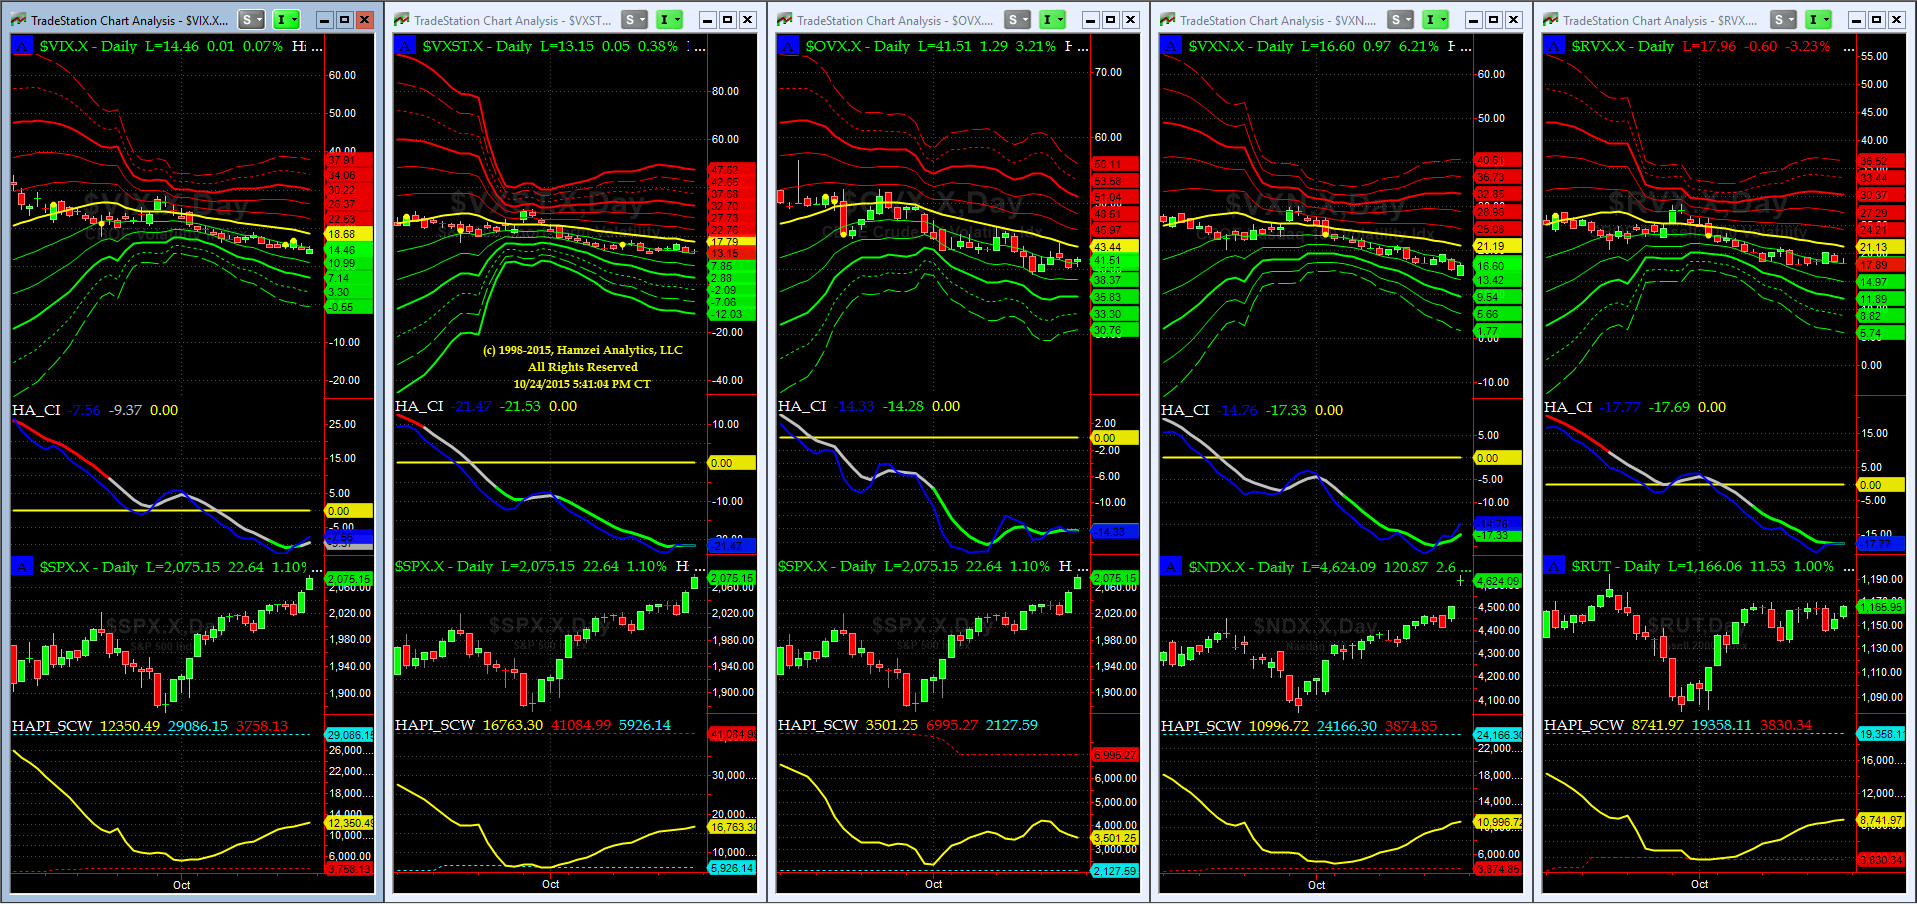
Vol of the Vols Chart
No signal here till we get another shockwave (volatility spike). Keep an eye on OVX (Crude Oil Volatility) & RVX (Russell 2000 Small Caps Volatility).
All Quiet on Mid-Western Front (where VIX is traded)? Yes, at least for now & until the other shoe drops.
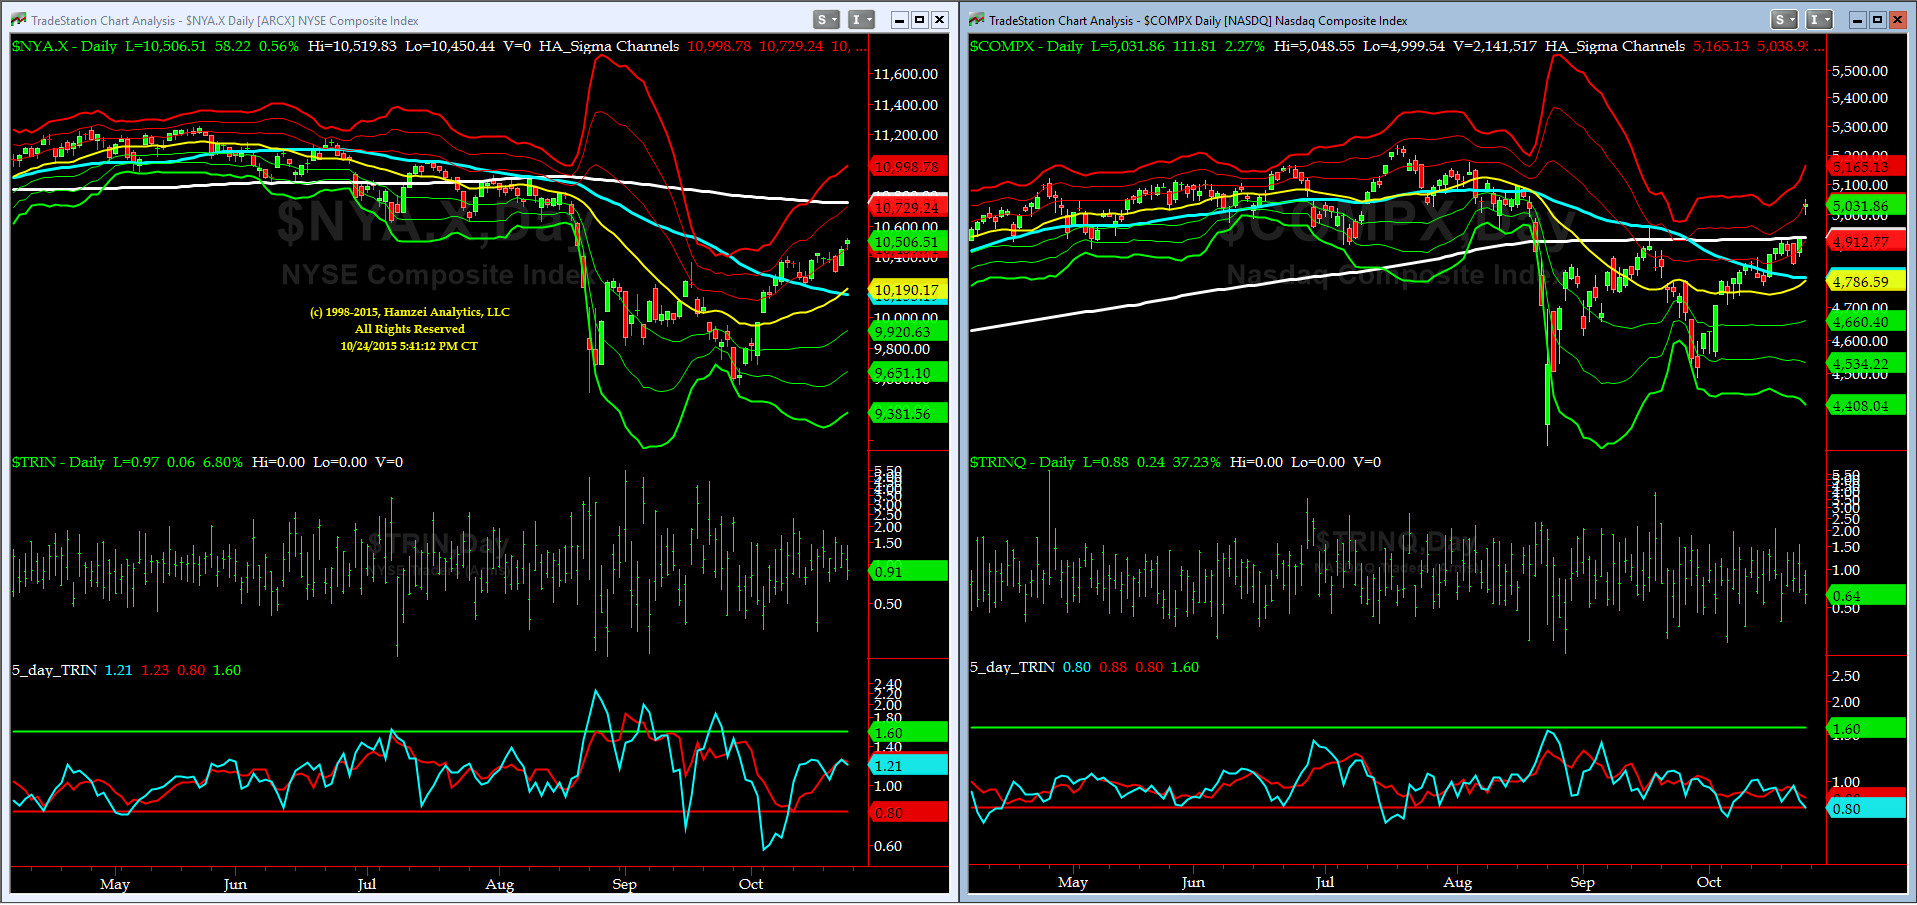
5-day TRIN & TRINQ Charts
NASDAQ Composite approaching a SELL signal.
Note: last one for both SPX and NDX failed.
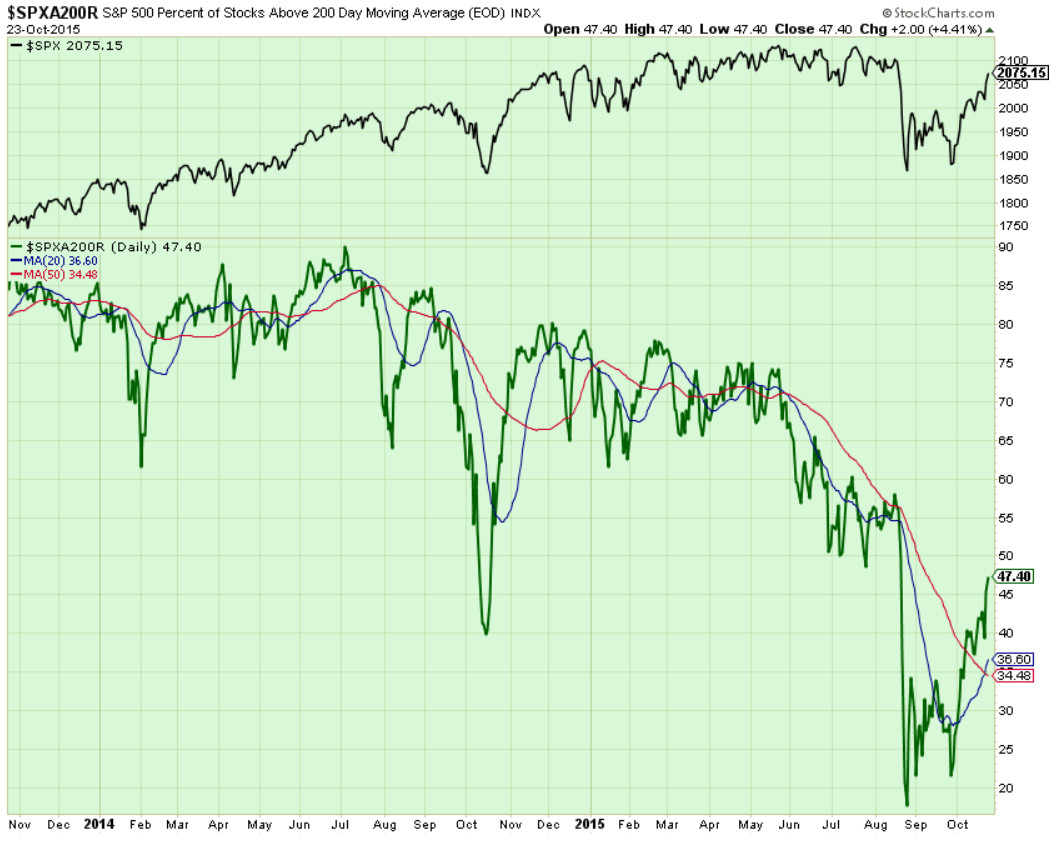
Components of SPX above their respective 200day MA Chart
We are at 47% now. Next target is 55% (critical). In addition, the 20-Day MA crossed 50-Day MA and now the separation between these two MAs will be a tell. Stay tuned sailors.
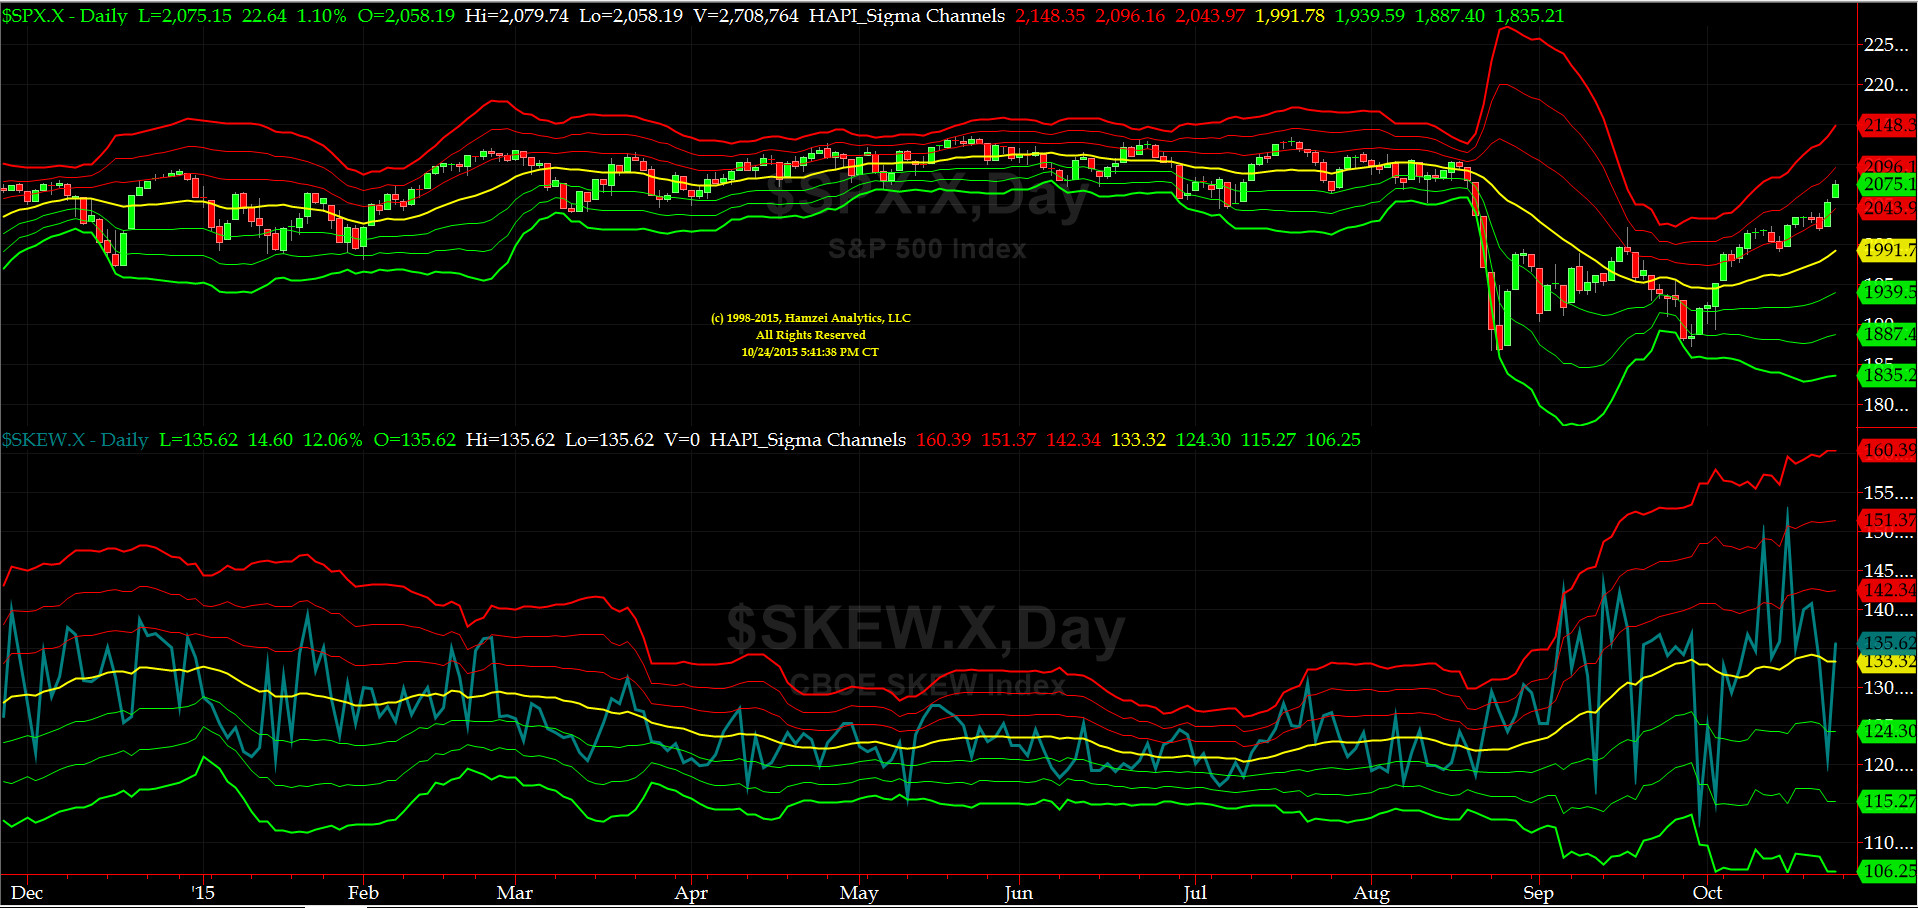
SPX SKEW (Tail Risk) Chart
After Friday close, SPX SKEW (Tail Risk) went back to its zero sigma at 135. All Quiet on the Mid-Western Front? Again, not so fast sailors. This journey has many turns.
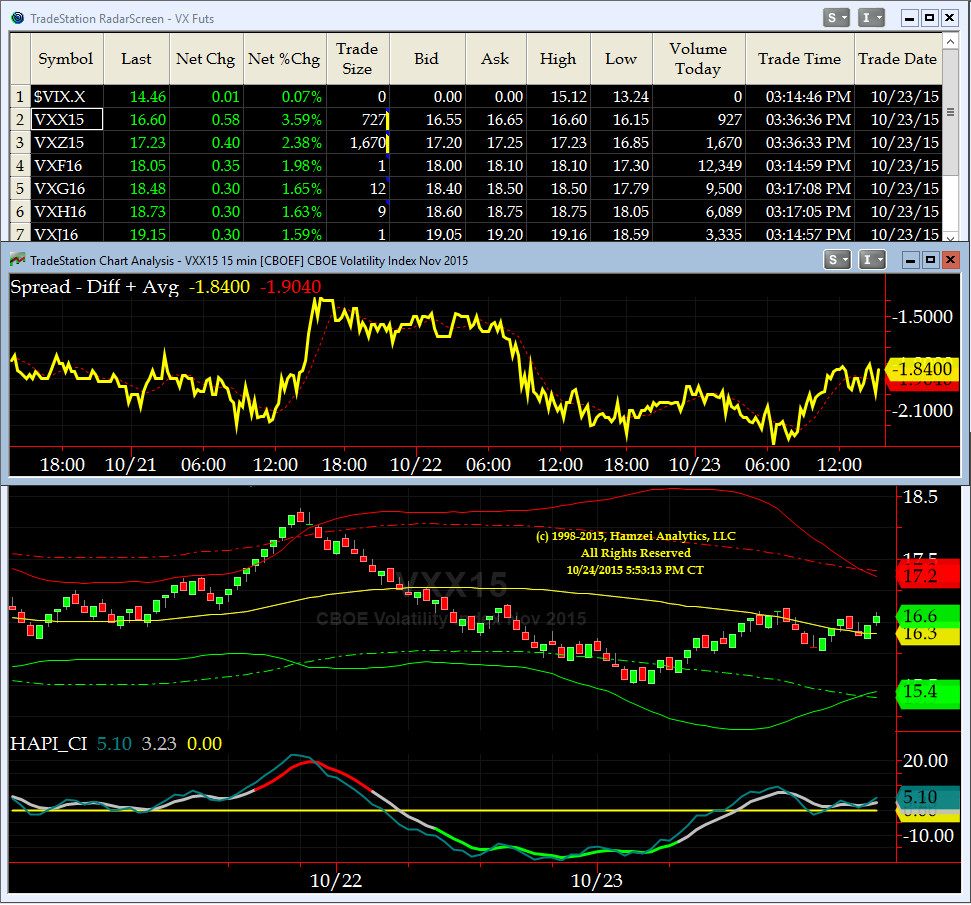
3-month VIX Futures Spread(VX) Chart
Our 3-month VIX Futures Spread is still, we repeat, too high, ioho. This spread, based on historical norms, should be around negative 2.5 to negative 3 here. We interpret that as some of our market participants [the smarter ones] have some worries, even though SPX has rallied for 14 out of last 18 sessions.
Note in our OTF Chart (bottom sub-graph), the Front Month VX contract (NOV), is on a BUY as of now.
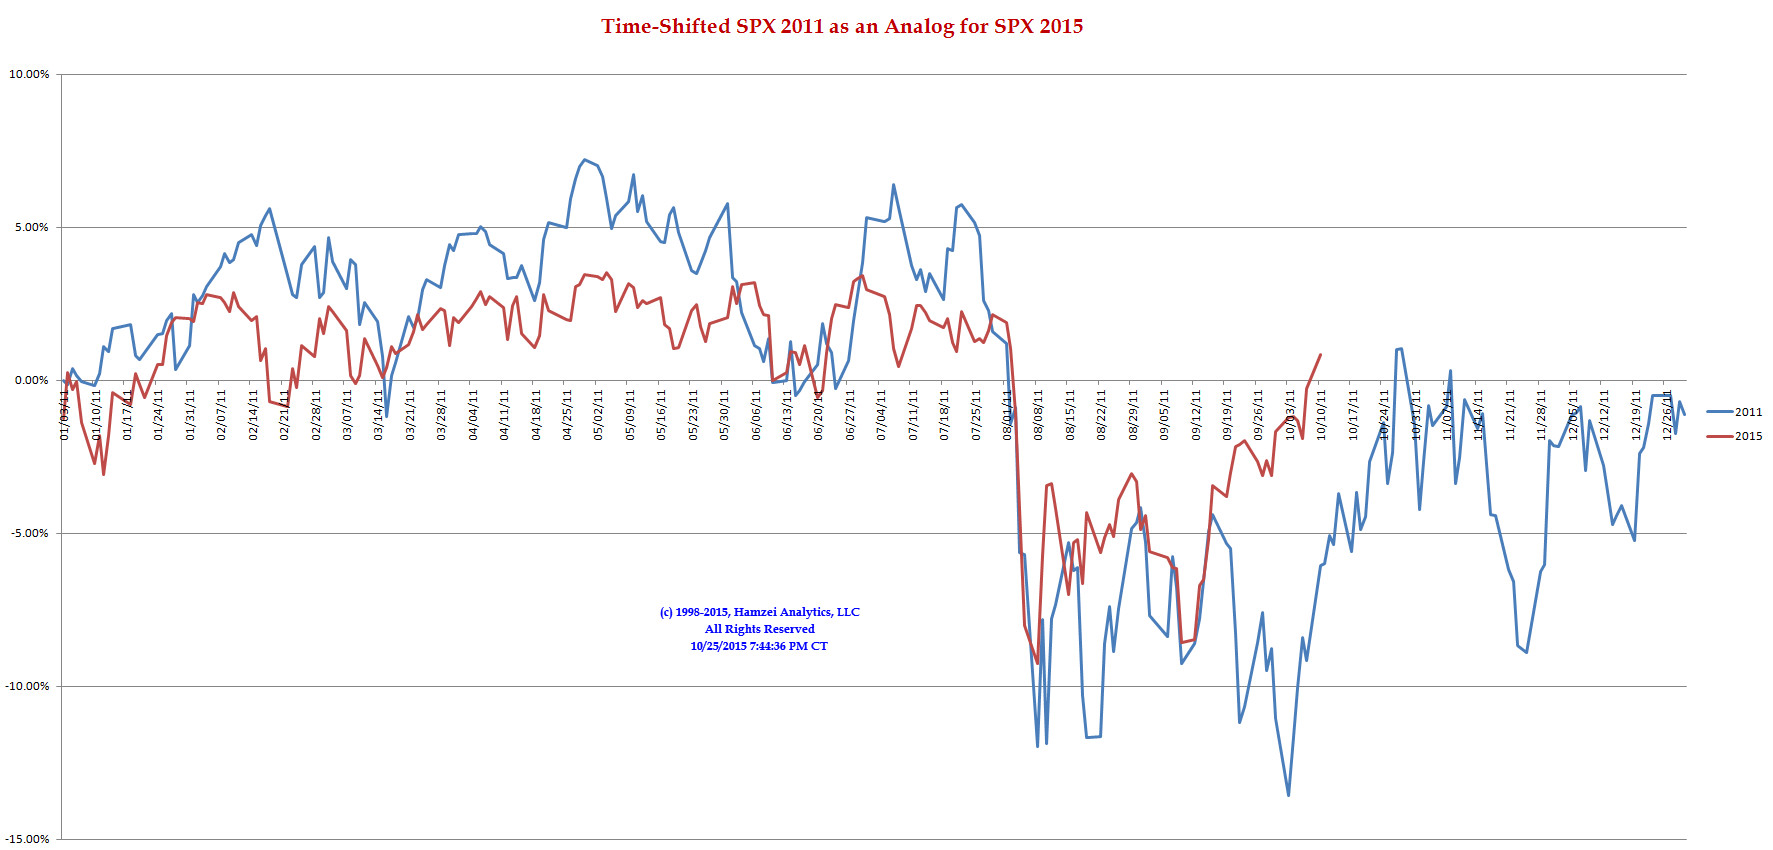
SPX 2011 Time-Shifted Analog for SPX 2015
All great things must come to an end. There is an old saying on Wall Street: "Analogs shall work until they don't." The 2011 time-shifted Analog Chart is on its last throes, ioho.
Thus, we have added another TimeShited SPX to our watch list of charts, the 1998, shown below. Stay tuned Sailors.
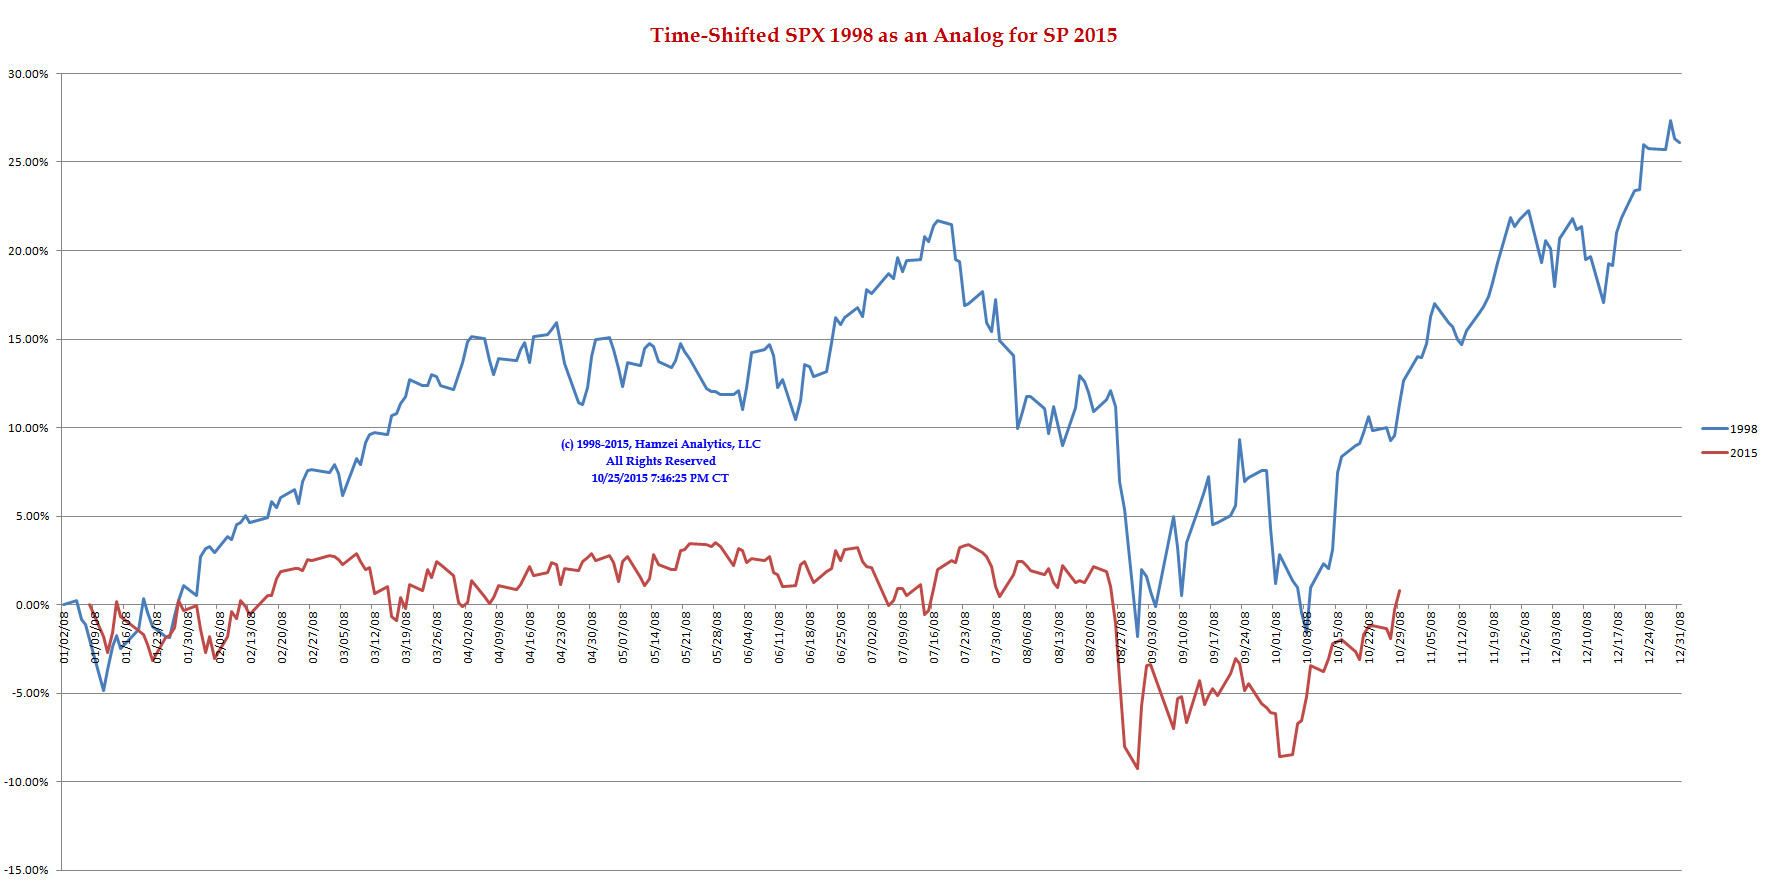
SPX 1998 Time-Shifted Analog for SPX 2015
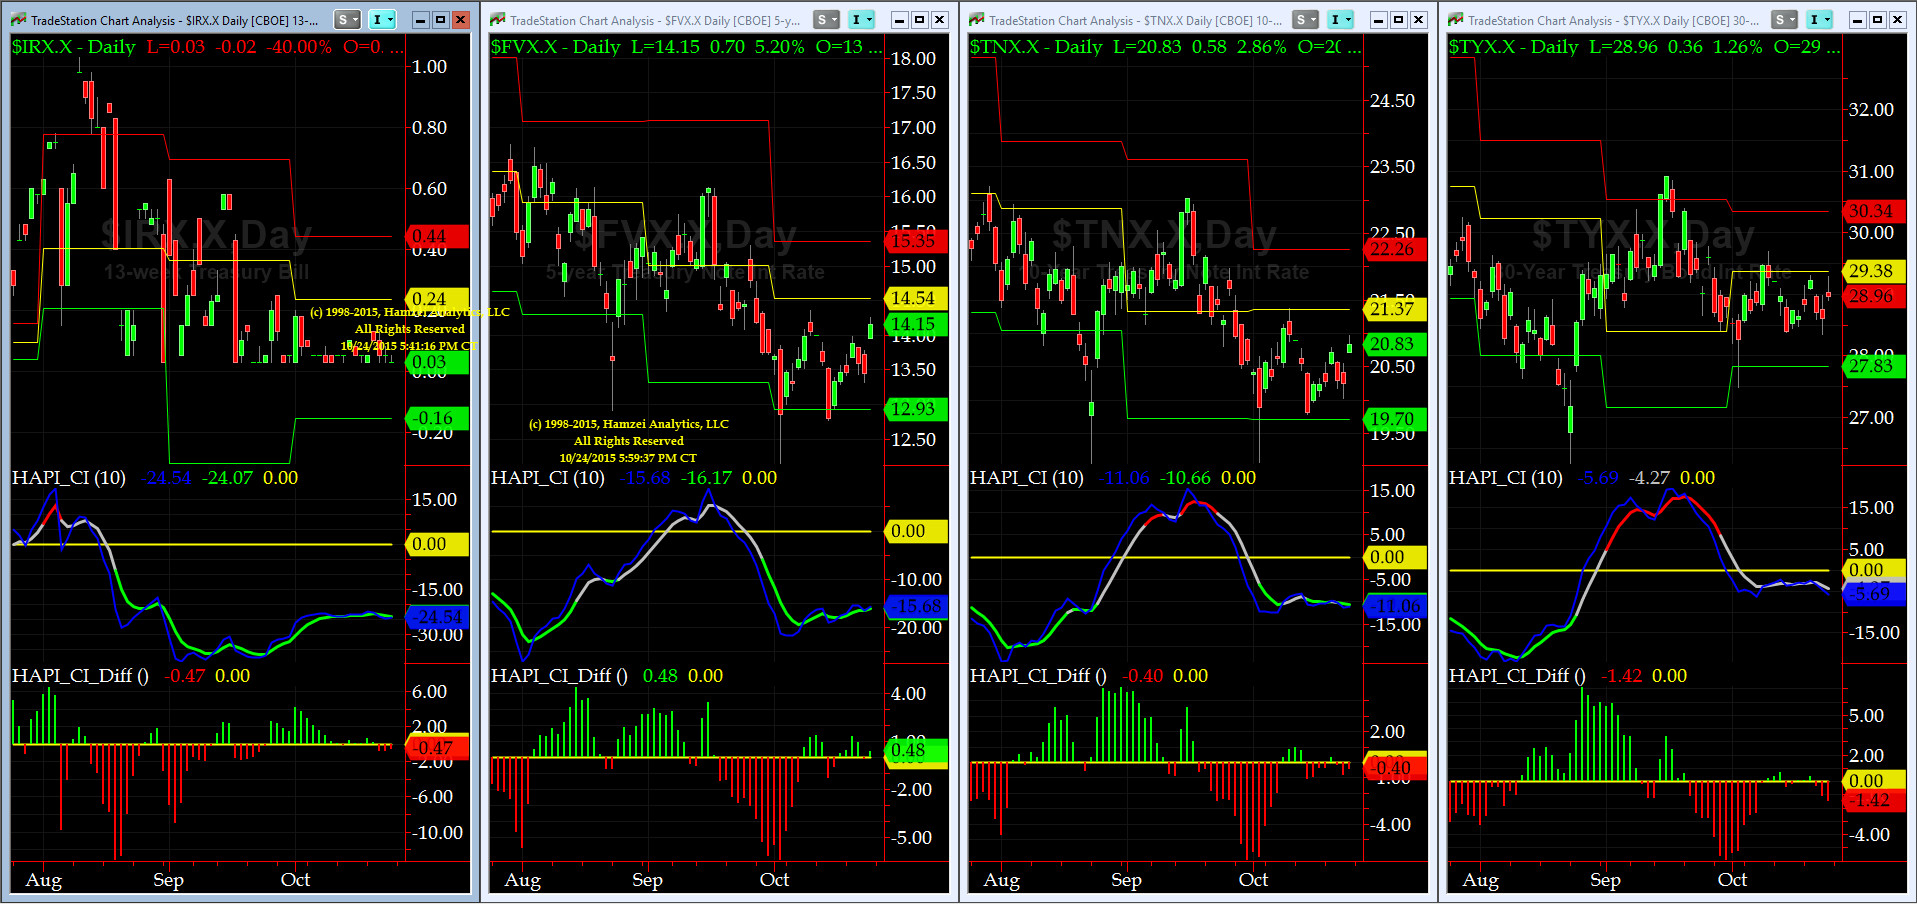
US Treasury T-Notes & T-Bonds Yields Chart
The Unwind of SHORT SP / LONG TY that started Thursday, October 15, continued at full force this past week.
Good luck this week,
Fari Hamzei
|
|
|
|
|
|
Customer Care:
|
|
|
|
|
|
|
 |
 |
|
 |
|
 |
 |
 |
HA YouTube Channel ::: HA Blog ::: Testimonials ::: Tutorials & FAQs ::: Privacy Policy
|
Trading Derivatives (Options & Futures) contains substantial risk and is not for every investor. An investor could potentially lose all or more than his/her initial investment.
Only risk capital should be used for trading and only those with sufficient risk capital should consider trading derivatives. Past performance is not
necessarily indicative of future results. Testimonials appearing on this website may not be representative of other clients or customers
and are not a guarantee of future performance or success.
|
| (c) 1998-2025, Hamzei Analytics, LLC.® All Rights Reserved. |
|
|