
|
 |
 |
 |
 |
 |
 |
 |
 |
 Proactive Market Timing Proactive Market Timing
|
|
|
Most Recent PMT vs SPX Performance Chart

|
|
|
|
Monday, November 2, 2015, 0945CT
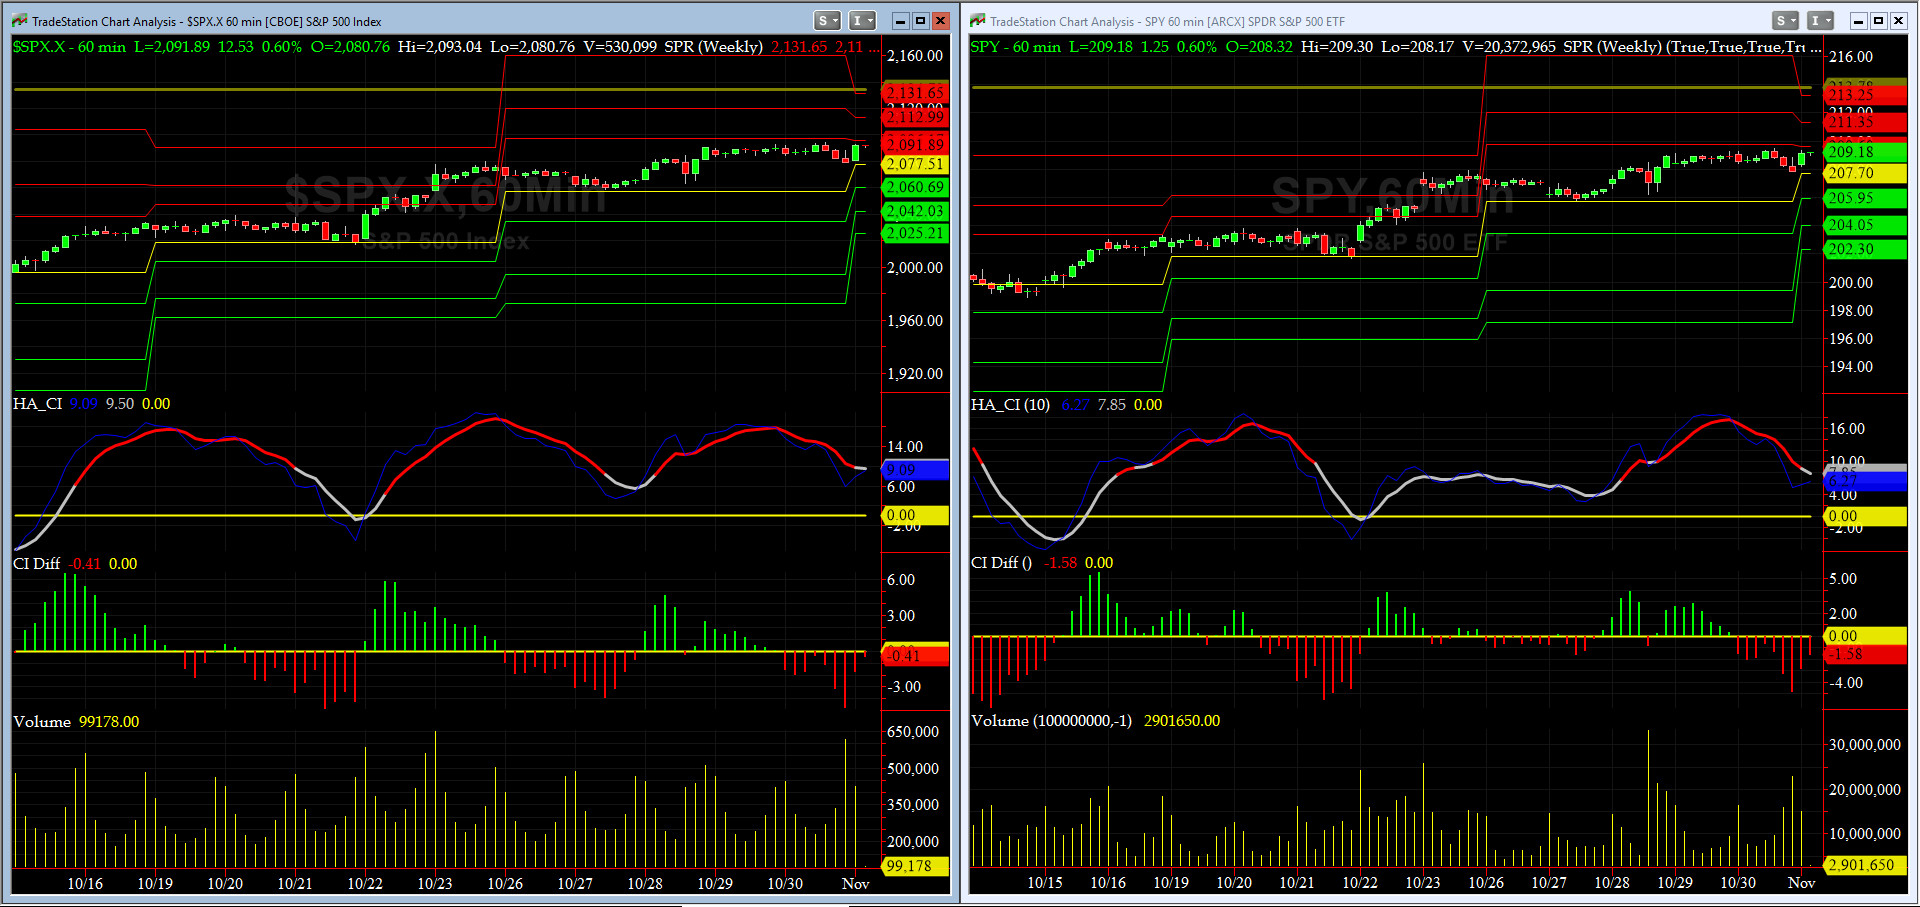
Companion Chart for Market Bias Review, Issue #117
|
|
|
|
|
|
Sunday Night, November 1, 2015, 1900CT
Market Bias Review, Issue #117
Most recent S&P-500 Cash Index (SPX): 2079.36 up +4.21 (up +0.2%) for the week ending on Friday, October 30th, 2015, which again closed at its +1.5 sigma.
SPX ALL TIME INTRADAY HIGH = 2134.72 (reached on Wednesday, May 20th, 2015)
SPX ALL TIME CLOSING HIGH = 2130.82 (reached on Thursday, May 21st, 2015)
Current DAILY +2 Sigma SPX = 2102 with WEEKLY +2 Sigma = 2167
Current DAILY 0 Sigma (20 day MA) SPX = 2033 with WEEKLY 0 Sigma = 2036
Current DAILY -2 Sigma SPX = 1965 with WEEKLY -2 Sigma = 1905
50-Day MA SPX =1980 or +5.0% below SPX (max observed in last 5 yrs = +8.6%, min = -9.3% )
200-Day MA SPX = 2061 or +0.9% below SPX (max observed in last 5 yrs = 15.2%, min = -14%)
VIX = 15.07 which closed Friday at its -1 sigma (remember it�s the VIX�s vol pattern (its sigma channels) that matters, and not the level of VIX itself (this is per Dr. Robert Whaley, a great mentor and the inventor of original VIX, now called VXO. VIX usually peaks around a test of its +4 sigma)
NYSE McClellan Oscillator = +18 (-150 is start of the O/S area; around -275 to -300 area or lower, we go into the �launch-pad� mode, over +150, we are in O/B area)
NYSE Breadth Thrust = 51.19 (40 is considered as oversold and 65 as overbought)
WEEKLY Timing Model = on a SELL Signal since Friday 8/7/15 CLOSE (first time in 32 months)
DAILY Timing Model = on a BUY Signal since Tuesday 10/6/15 CLOSE
Max SPX 52wk-highs reading last week = 36 (over 120-140, the local maxima is in)
Max SPX 52wk-Lows reading last week = 15 (over 40-60, the local minima is in)
HA_SP1 = at just about its +1 Sigma
HA_Momo = +1.04 (reversals most likely occur above +10 or below -10)
HA_SP2 = 65.3(Buy signal <= 20, Sell Signal >= 80)
3-mo. VX Futures Spread (long NOV short FEB) = -2.01 (-3 to -2.5 SELL signal, 0 BUY Signal)
SPX SKEW (Tail Risk) = 125 (normal = 120-125, range 100-150)
Current SPX Bias with Timer Digest: LONG SPX as of Tuesday, October 20th, 2015 Close at 2030.77
Previous Bias: SHORT SPX (since Tuesday, October 6th, 2015 Close at 1979.92)
This WEEK�s Bias = Cautiously, LONG SPX Complex via Long Call Spreads as most of the large-cap Q3 Earnings are behind us and we head into October NFP due this Friday.
Profit Target = 2130
Money Management Stop = 2060
BOTTOM LINE: Still we have a tough trading period in the next 3 to 4 weeks.... Always watch your bet size, and, no need to be a cowboy.
NOTE: All LEVELS mentioned here have been, are, and will be, based on the S&P-500 SPX Cash Index, and not the ES Futures. Tomorrow after the first hour is complete, we will post here a companion chart showing critical short-term WEEKLY levels to watch for possible �retest failures.�
Fari Hamzei
|
|
|
|
|
|
Sunday, November 1, 2015 1815CT
Market Timing Charts & Comments
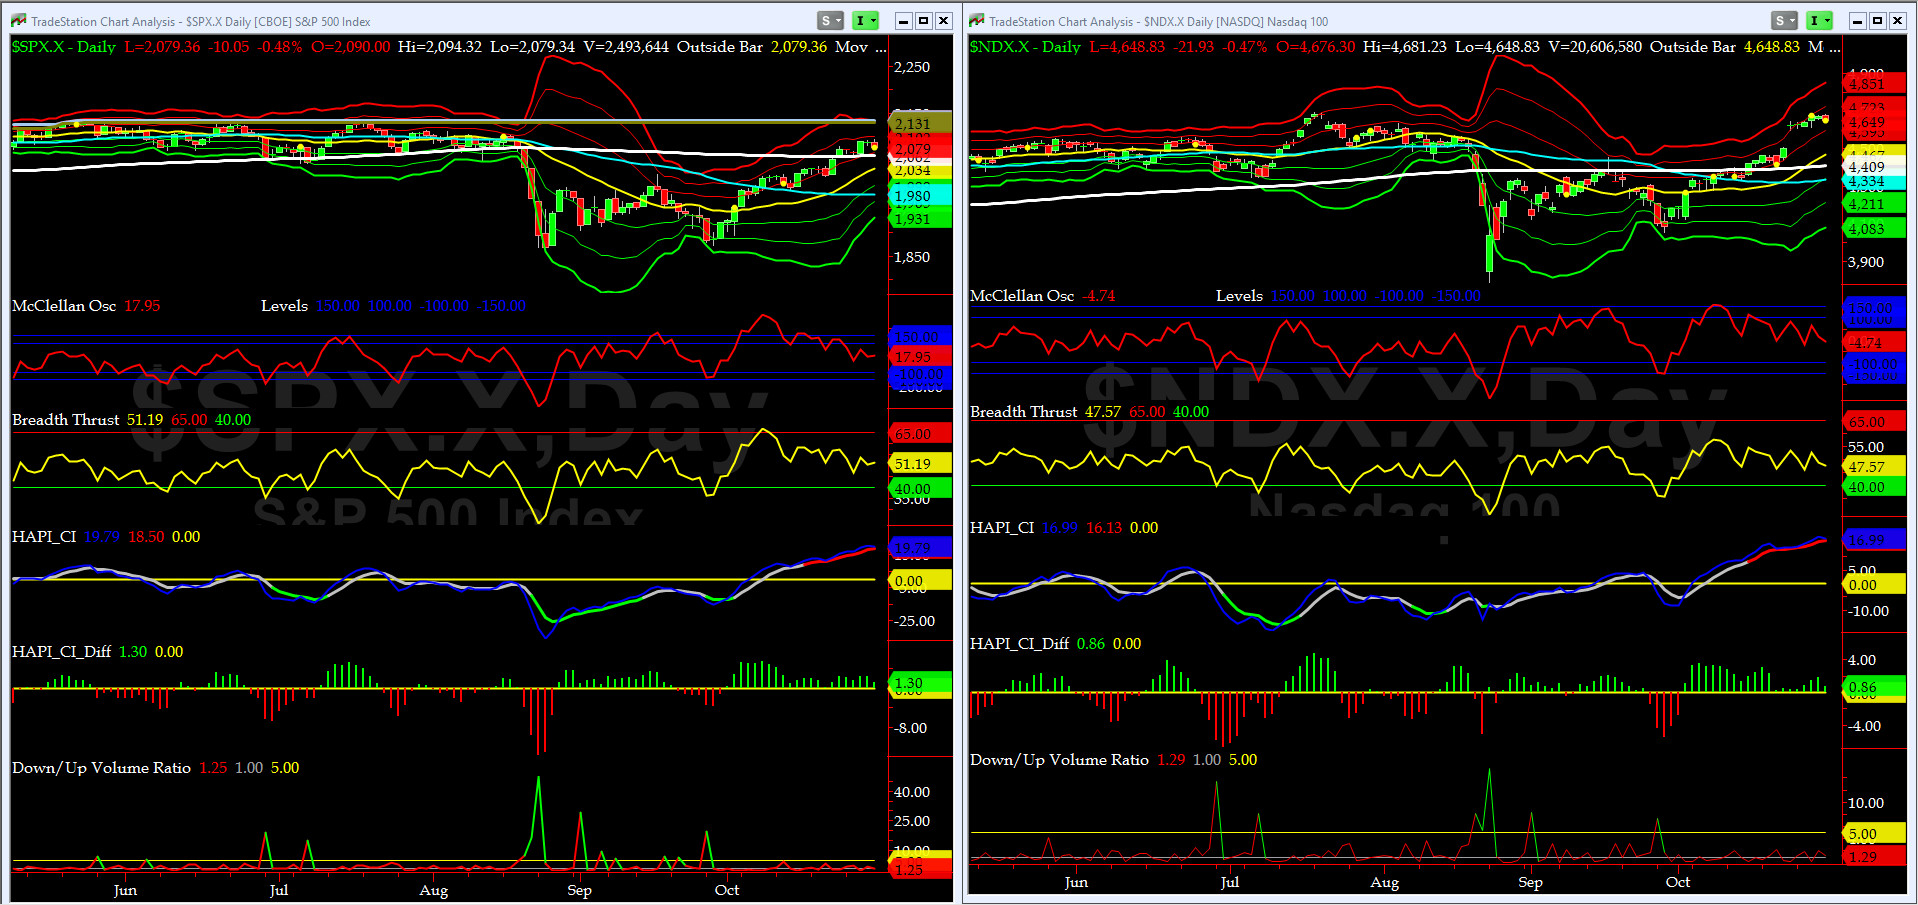
Timer Chart of S&P-500 Cash Index (SPX)
SPX had an otherwise a very quiet week till FOMC Day burst up (Wednesday) and sell off in the last 2 hours of Friday (end of year rebalancing for mutual funds). The breadth indicators also remained in the middle of the road too. But worth noting is that in October, SPX posts largest monthly gain since 2011.
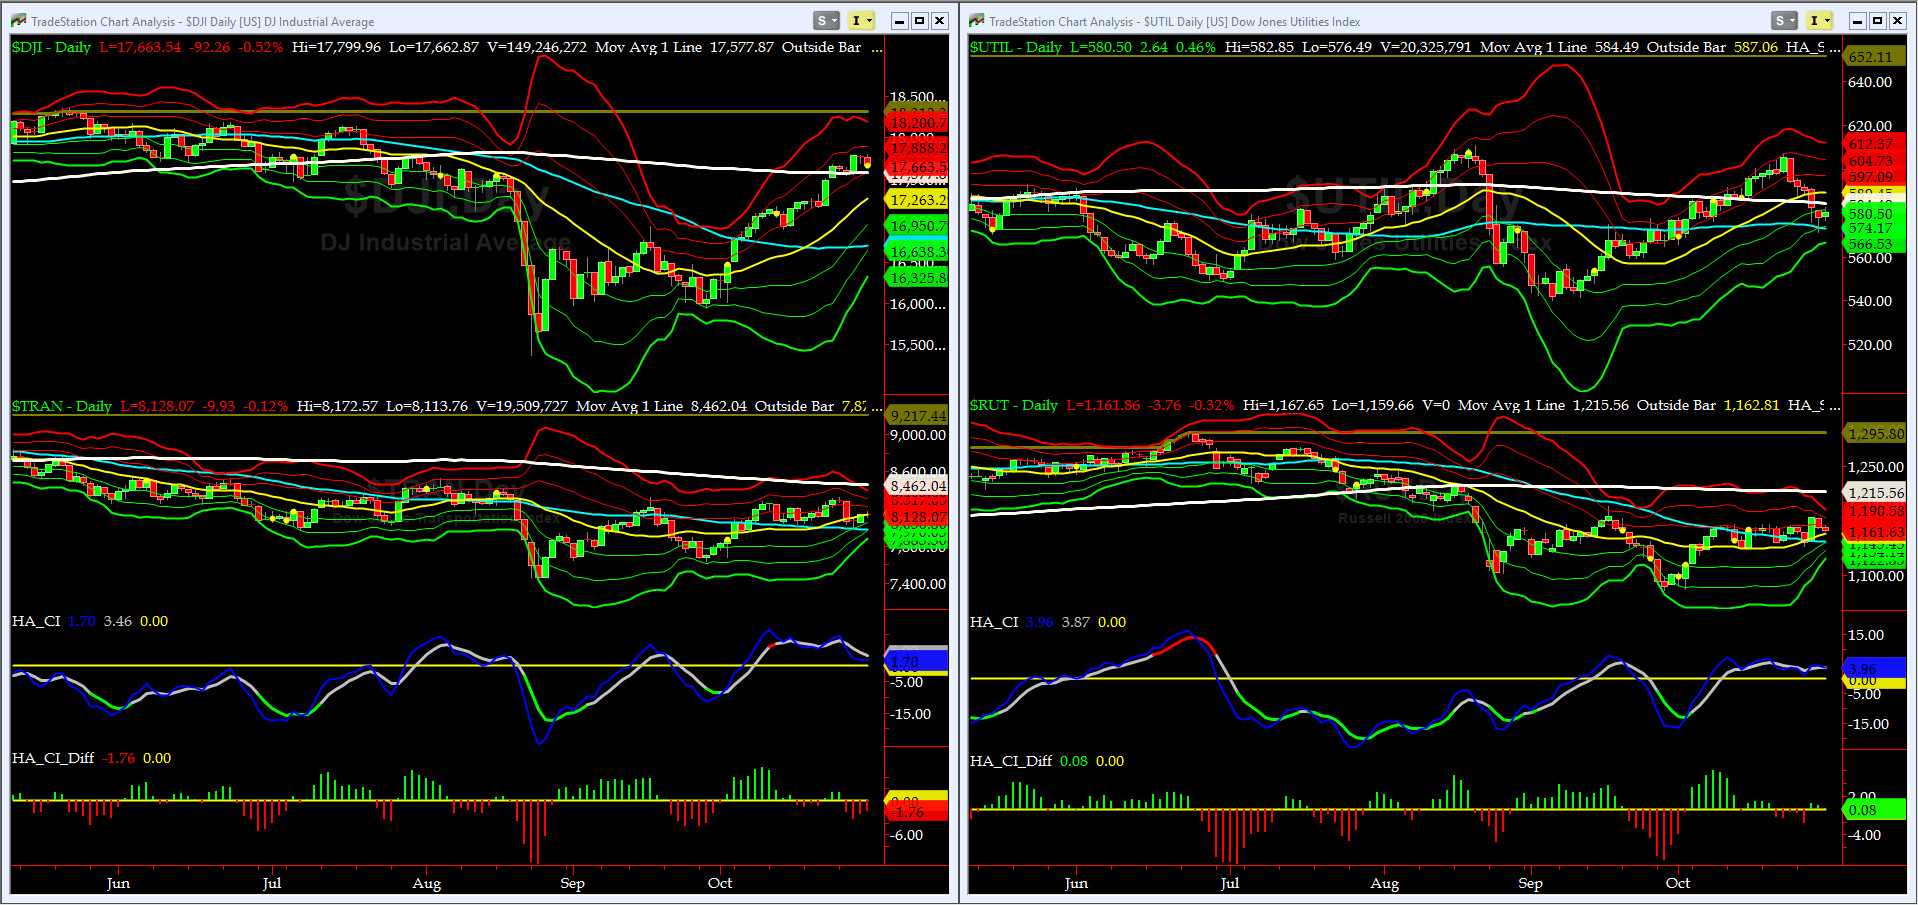
Canaries [in the Coal Mine] Chart for DJ TRAN & RUT Indices
This week the breakout by DJ Transports (proxy for economic conditions 6 to 9 months hence) gave back but Russell 2000 Small Caps (RUT) managed to break out strongly on FOMC Day, albeit gave back some on Thursday.
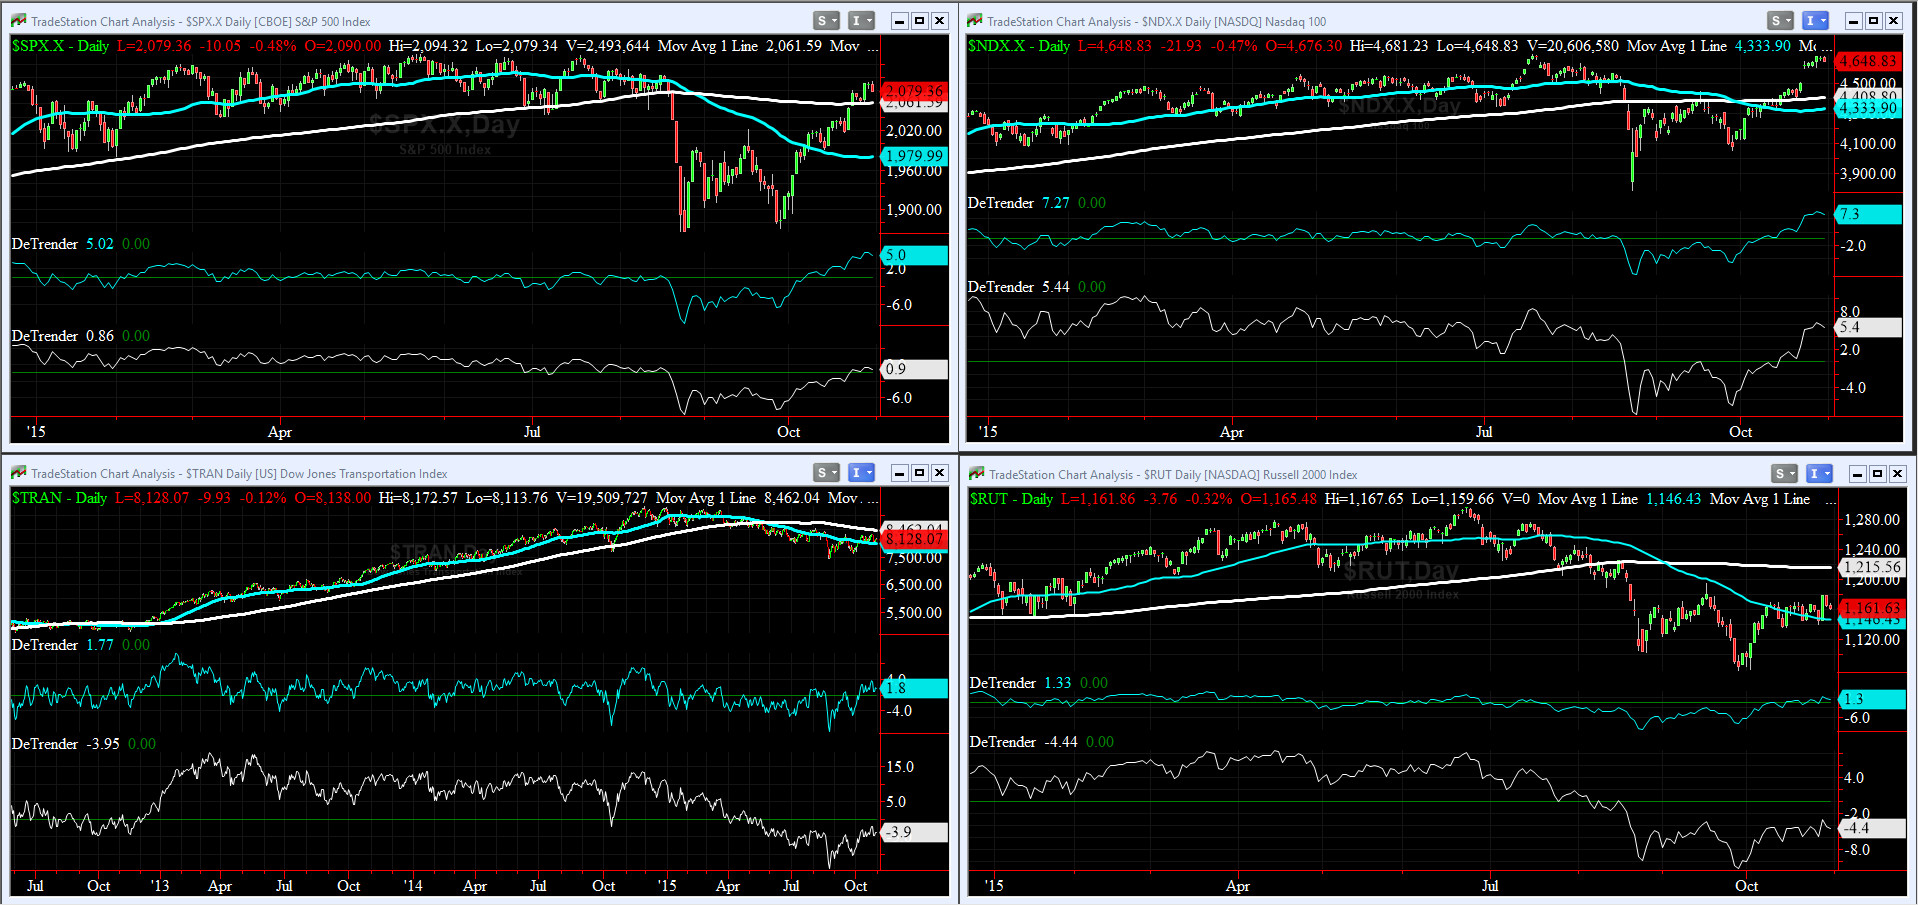
DeTrenders Charts for SPX, NDX, TRAN & RUT Indices
We repeat the same comment from that week: 50DTs are positive for all four indices covered here SPX, NDX, DJ TRAN & RUT, while only two of our 200DTs are positive (SPX & NDX).
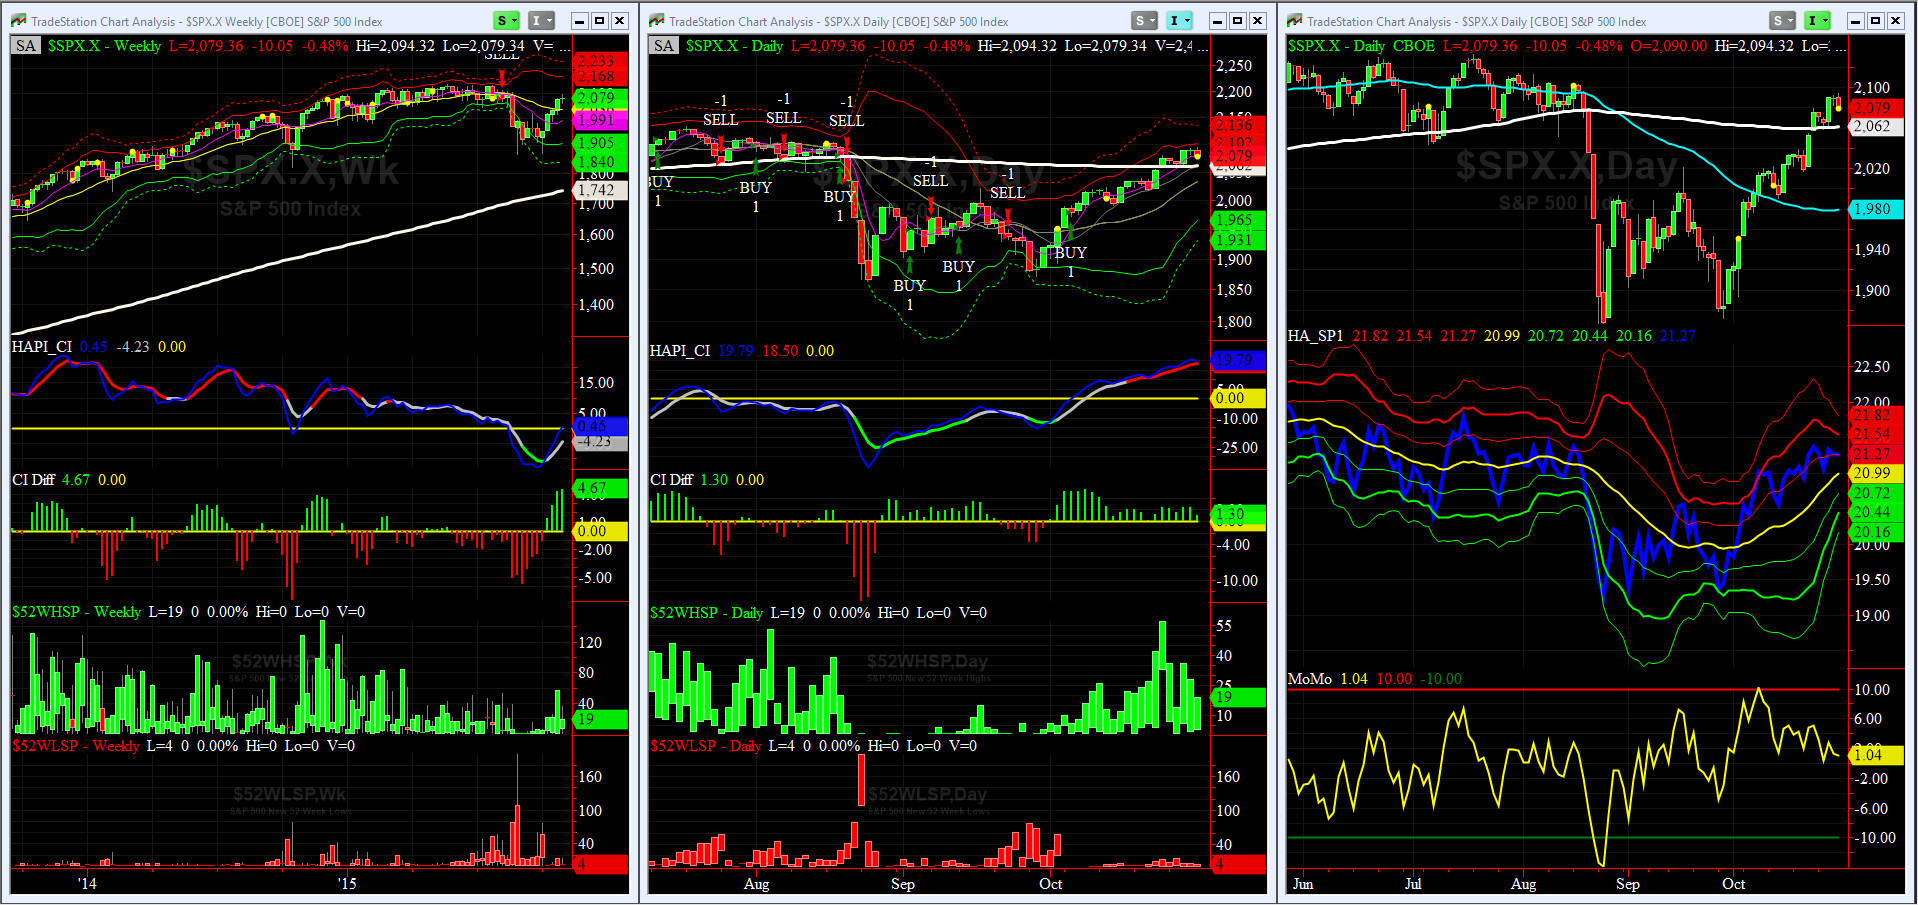
HA_SP1_momo Chart
We are on SELL (WEEKLY Timing Model) & BUY (DAILY Timing Model) as of Tuesday, October 6th.
HA_momo, at +1.04, is also in divergence with SPX Cash & HA_SP1.
Last week New 52week Highs receded to 36.
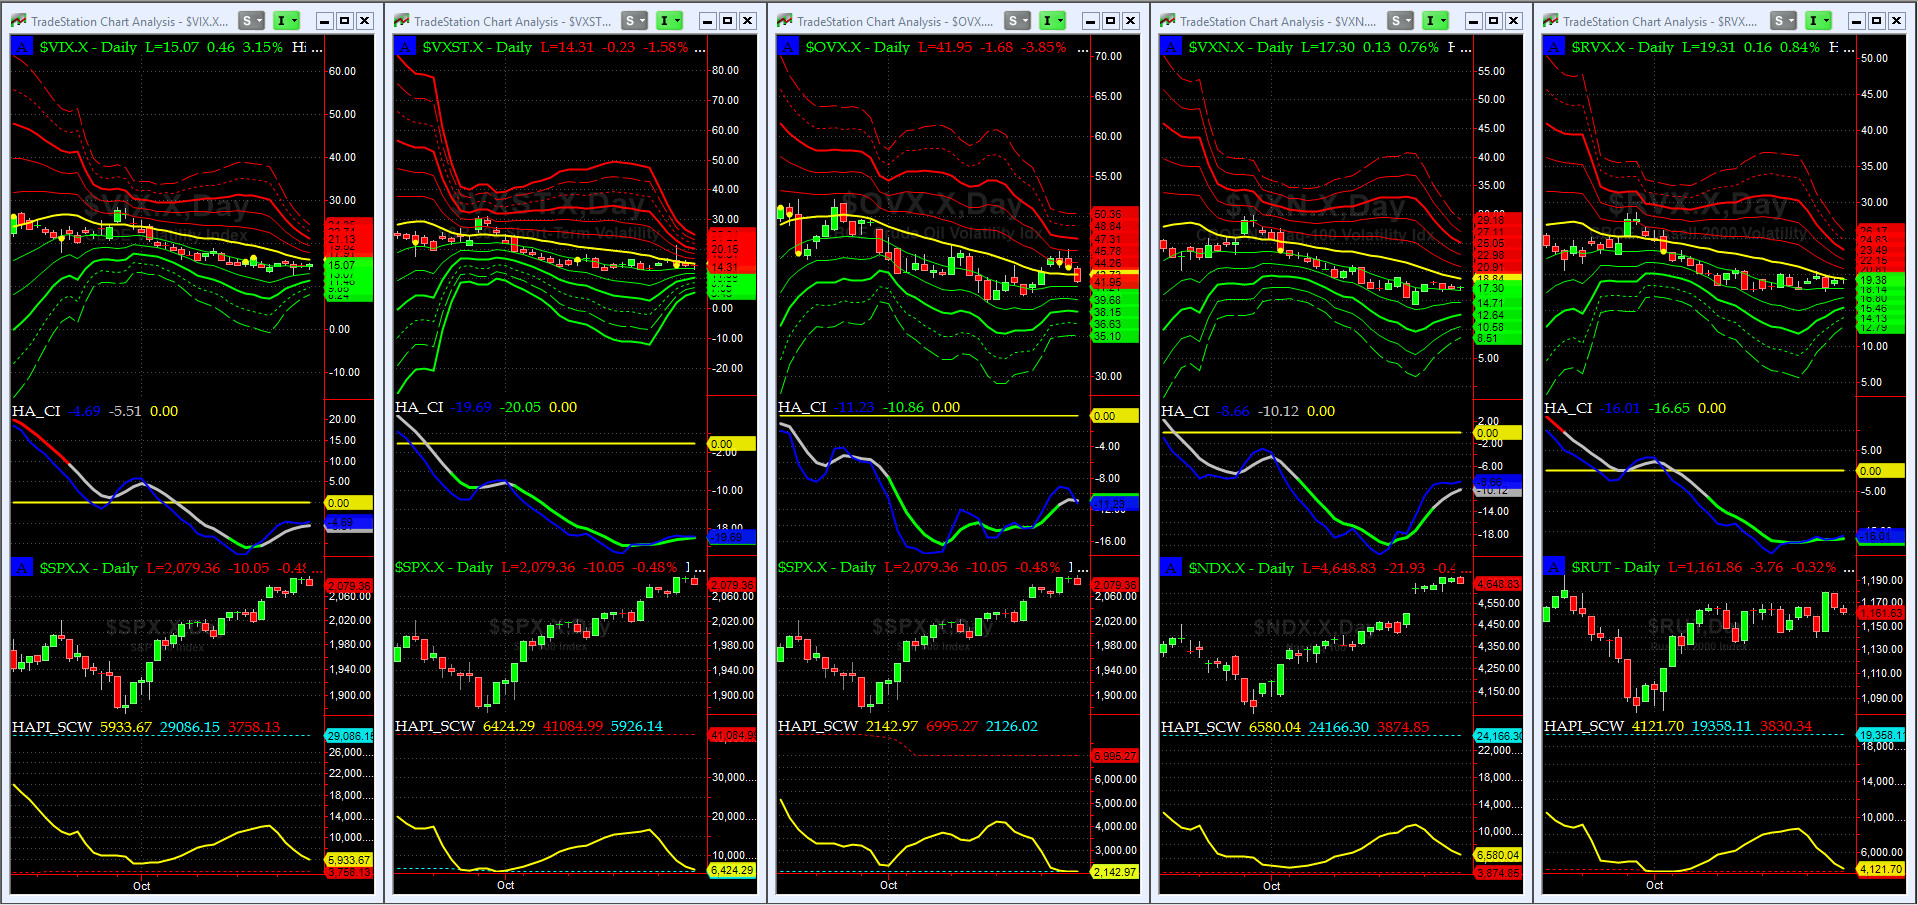
Vol of the Vols Chart
No signal here other than OVX (Crude Oil Volatility) as we saw Dec contract rally to 47 on Thursday and Friday .
All Quiet on Mid-Western Front (where VIX is traded)? Yes, at least for now & until the other shoe drops.
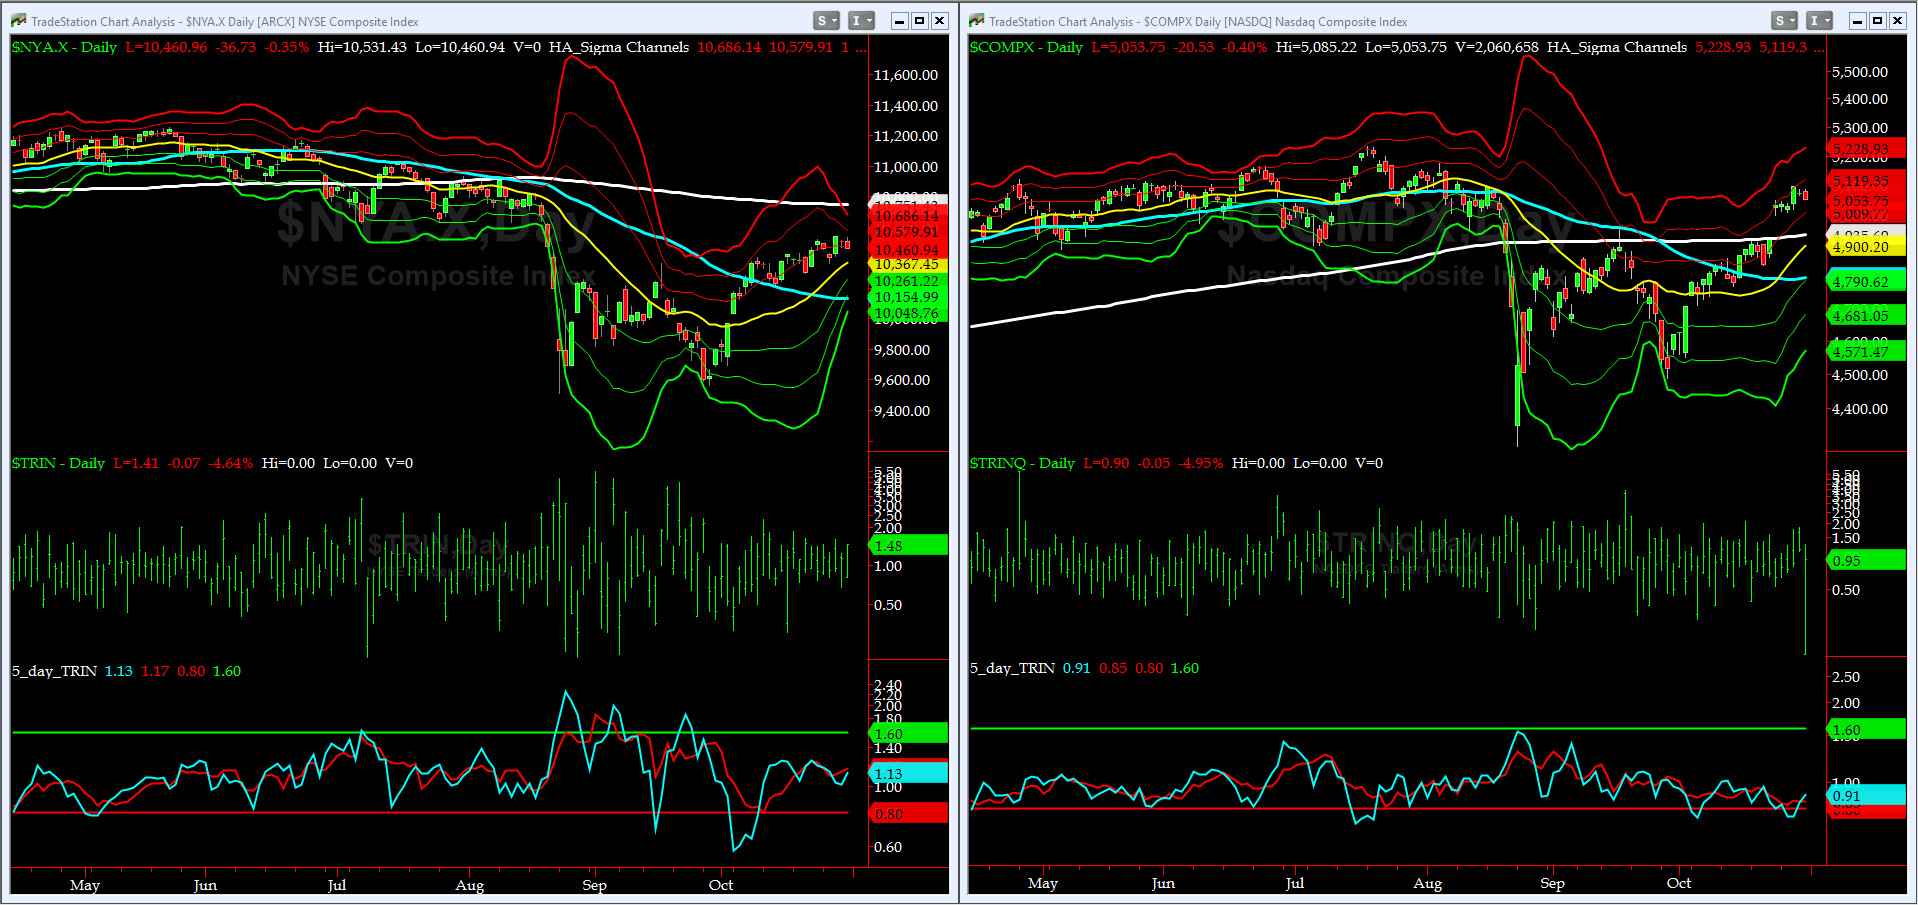
5-day TRIN & TRINQ Charts
TRIN for NASDAQ Composite gave a SELL signal on Wednesday.
Note: last one for both SPX and NDX failed.
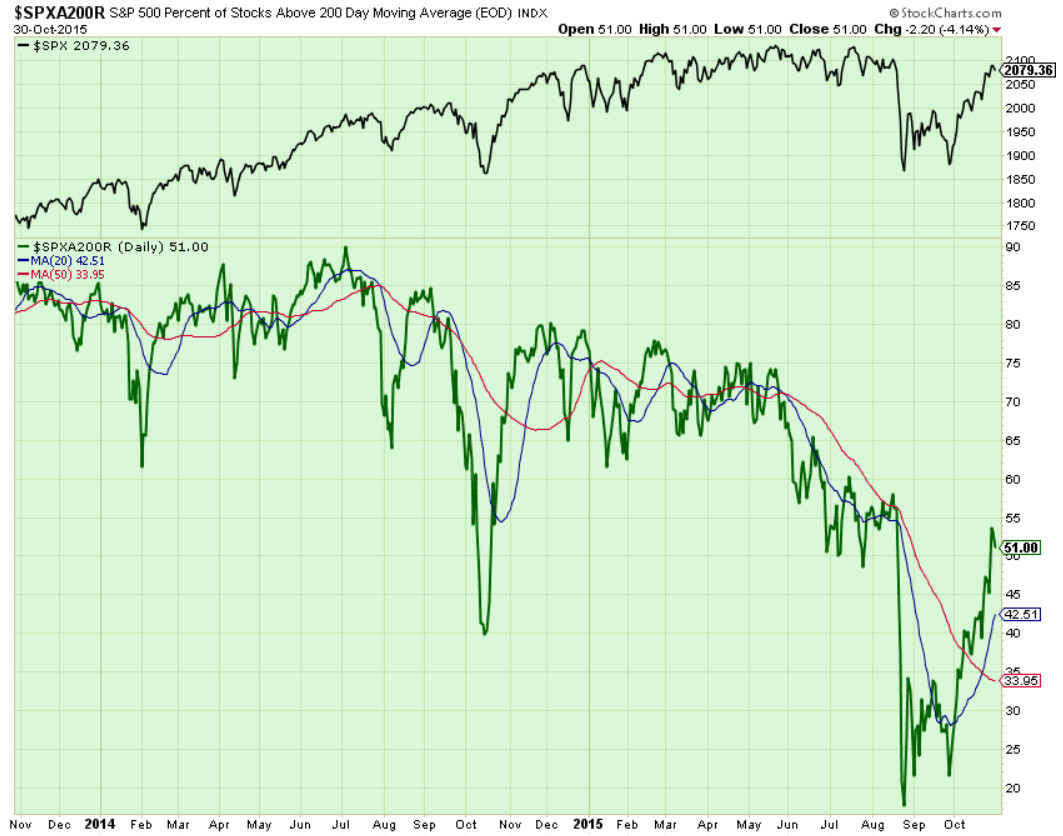
Components of SPX above their respective 200day MA Chart
We are at 51% now. Next target is 55% and then at 65% (critical level), we feel more comfortable about our LONG bias. In addition, the 20-Day MA crossed 50-Day MA and now the separation between these two MAs will be a tell. Stay tuned sailors.
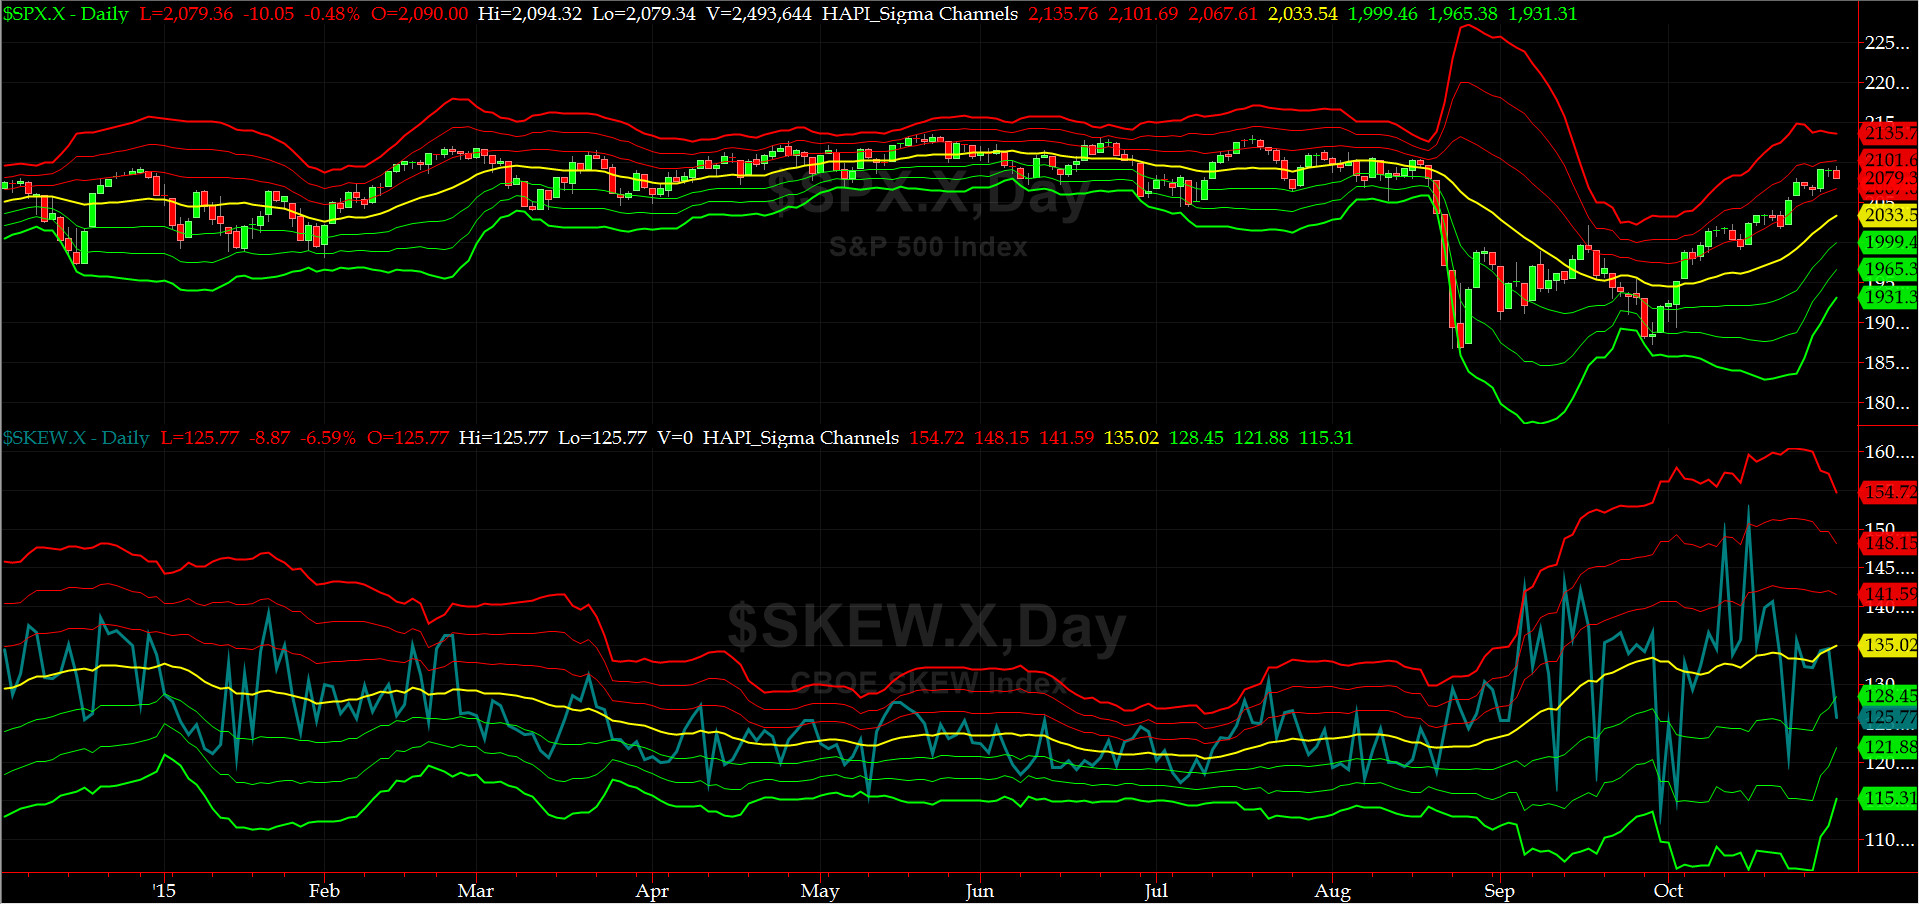
SPX SKEW (Tail Risk) Chart
After Friday close, SPX SKEW (Tail Risk) sank to its "normal" level of 125. All Quiet on the Mid-Western Front? Getting quieter fast but in this journey we never walk in a straight line.

3-month VIX Futures Spread(VX) Chart
Our 3-month VIX Futures Spread is still, we repeat, too high, ioho. This spread, based on historical norms, should be around negative 2.5 to negative 3 here. We interpret that as some of our market participants [the smarter ones] STILL have some worries, even though SPX has rallied for 16 out of last 23 sessions.
Note in our OTF Chart (bottom sub-graph), the Front Month VX contract (NOV), is still on a BUY as of now.
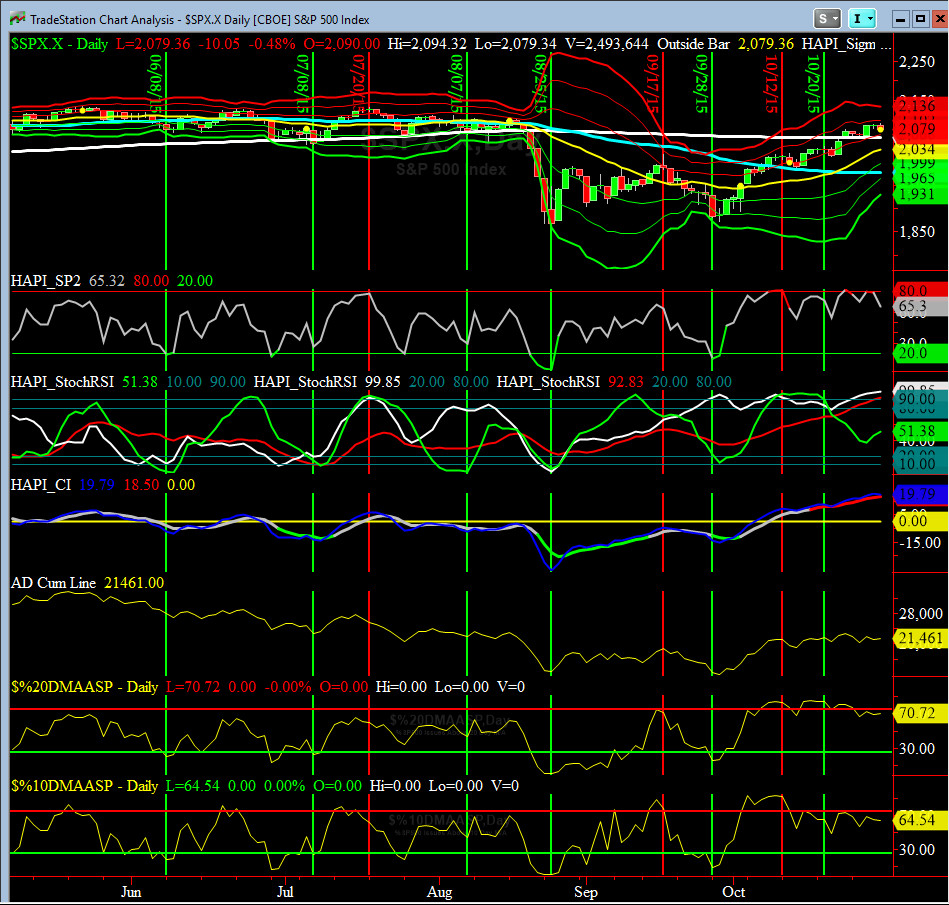
HA_SP2 Chart
At 65, this prop indicator is back to divergence with SPX Cash.
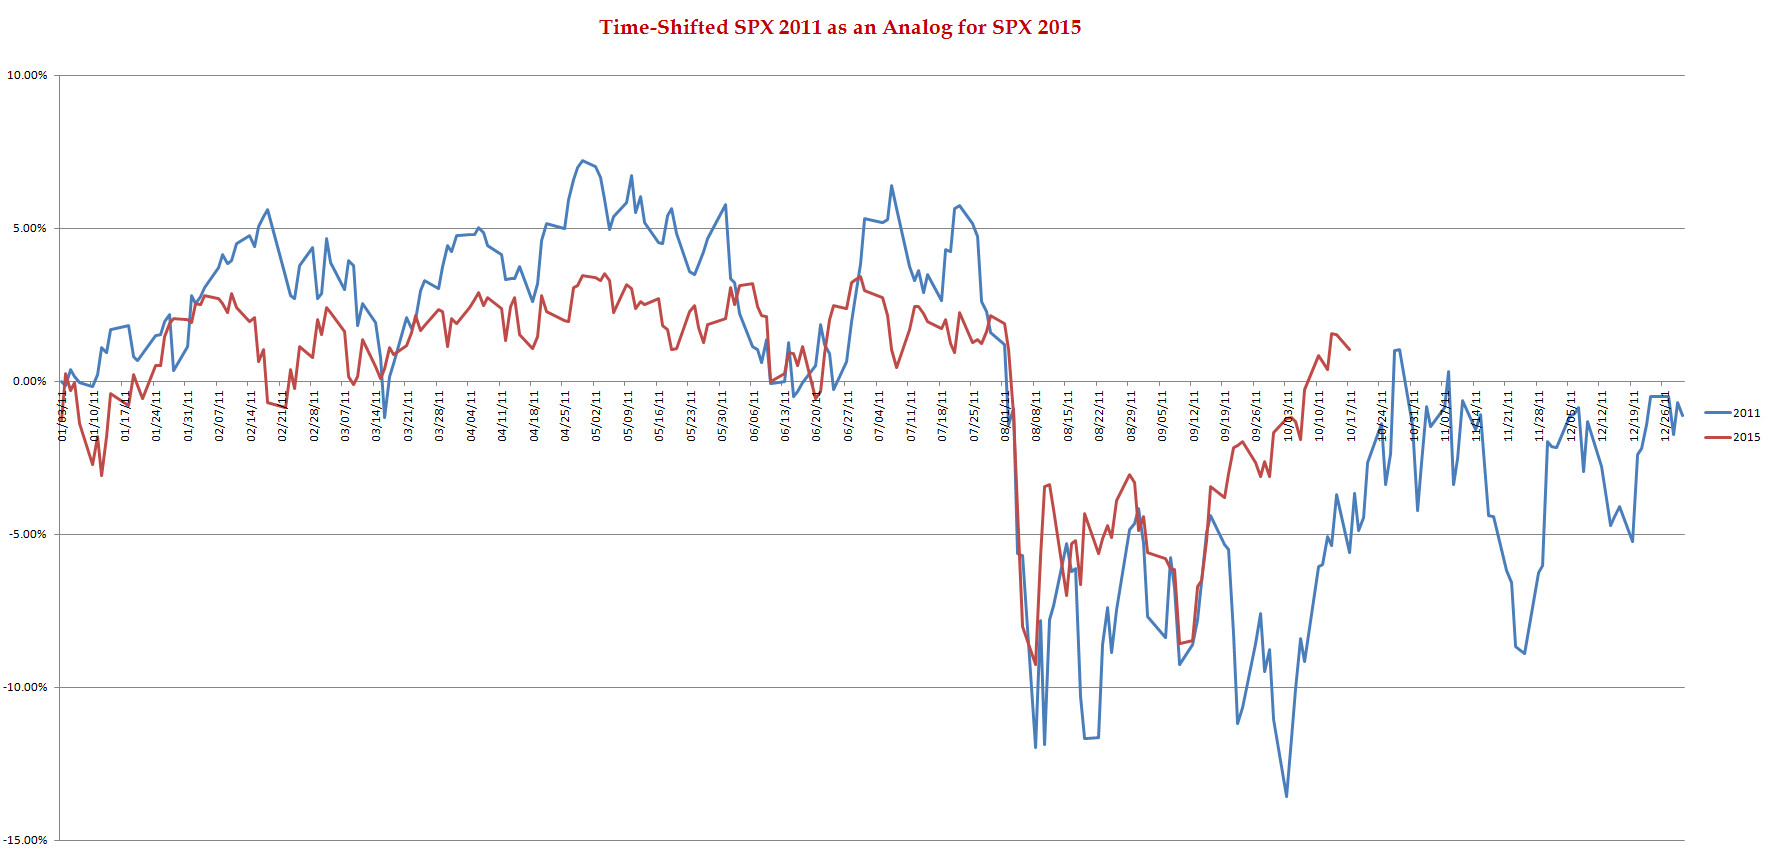
SPX 2011 Time-Shifted Analog for SPX 2015
This week we shall find out which Analog wins this race. It is a tough call right now.
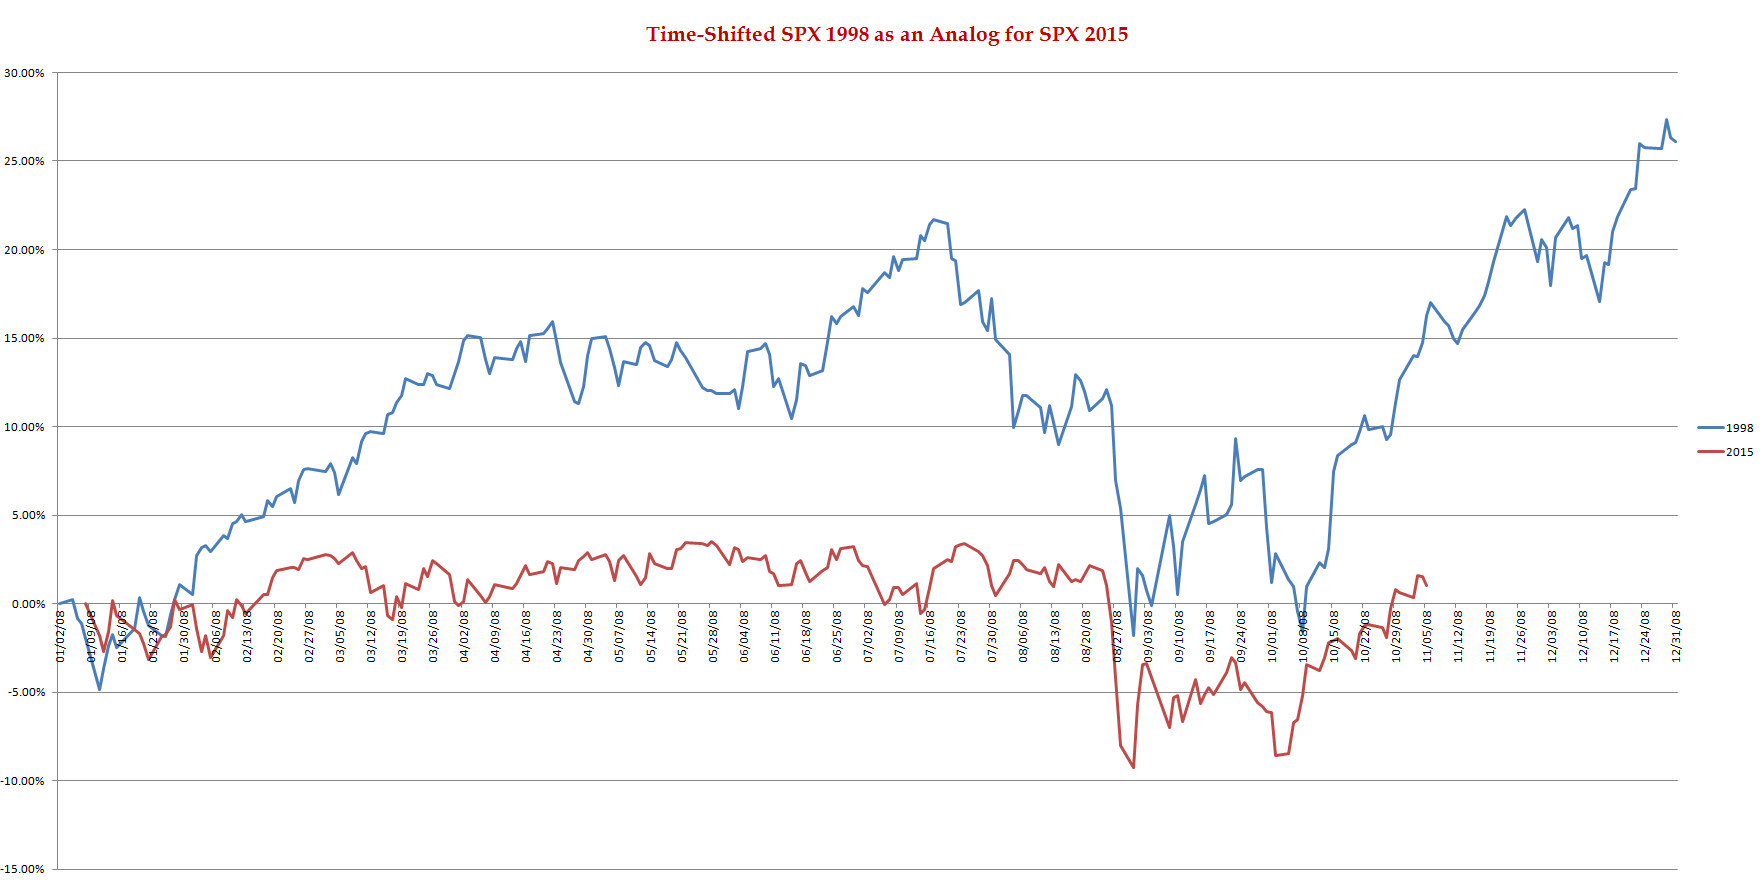
SPX 1998 Time-Shifted Analog for SPX 2015
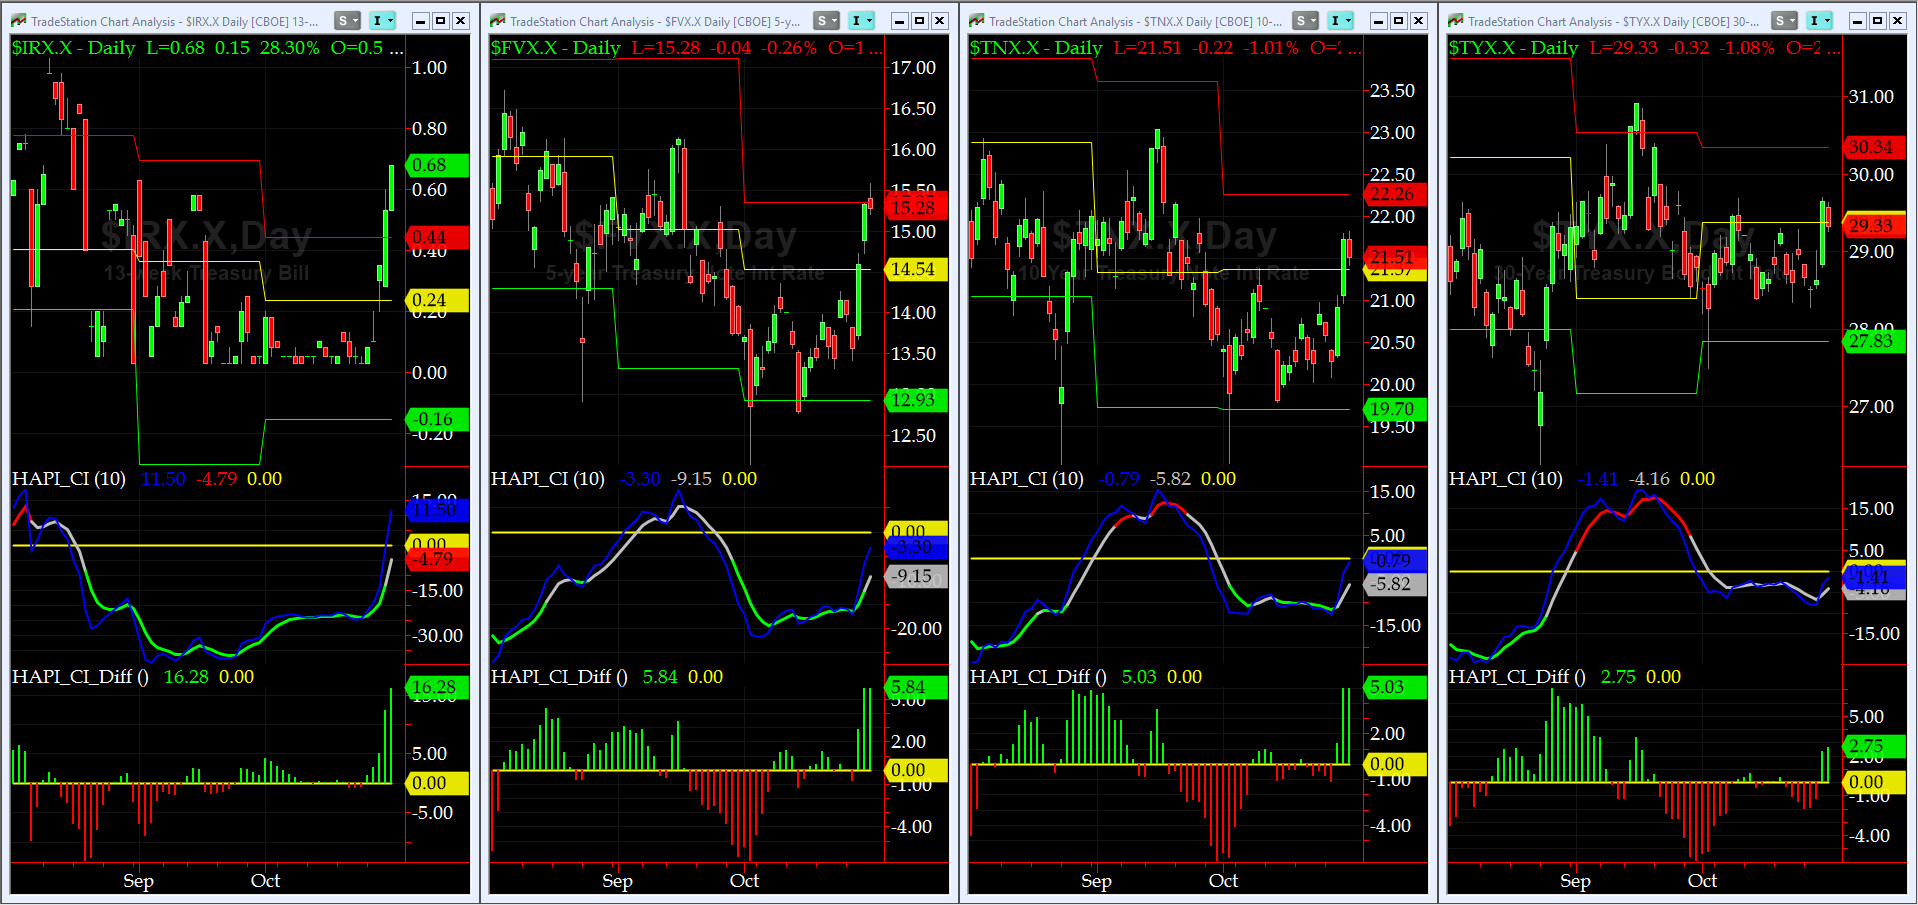
US Treasury T-Notes & T-Bonds Yields Chart
This past week, the YTM on Treasuries rallied, specially very aggressively on the front end (91-day T-Bills), and more then slowly, as we walk up the Yield Curve (into higher maturity).
Good luck this week,
Fari Hamzei
|
|
|
|
|
|
Customer Care:
|
|
|
|
|
|
|
 |
 |
|
 |
|
 |
 |
 |
HA YouTube Channel ::: HA Blog ::: Testimonials ::: Tutorials & FAQs ::: Privacy Policy
|
Trading Derivatives (Options & Futures) contains substantial risk and is not for every investor. An investor could potentially lose all or more than his/her initial investment.
Only risk capital should be used for trading and only those with sufficient risk capital should consider trading derivatives. Past performance is not
necessarily indicative of future results. Testimonials appearing on this website may not be representative of other clients or customers
and are not a guarantee of future performance or success.
|
| (c) 1998-2025, Hamzei Analytics, LLC.® All Rights Reserved. |
|
|