Investment Advice via real time put call ratio real time investment advice
Contact Us Home Products News About Members
Proactive Market Timing
 
Proactive Market Timing Service

Market Timer: Fari Hamzei

Executive Officer: @Fleet_Adm_Tiko

Editors: Nancy Scott

Here is the most recent How the PMT Market Bias Service Works Video

Weekly PMT Webinars on YouTube   PMT Archives   Current PMT Issue

Most Recent PMT vs SPX Performance Chart

Monday, November 30, 2015, 1300ET
Companion Chart for Market Bias Review, Issue #120

Sunday Night, November 29, 2015, 2230ET
Market Bias Review, Issue #120


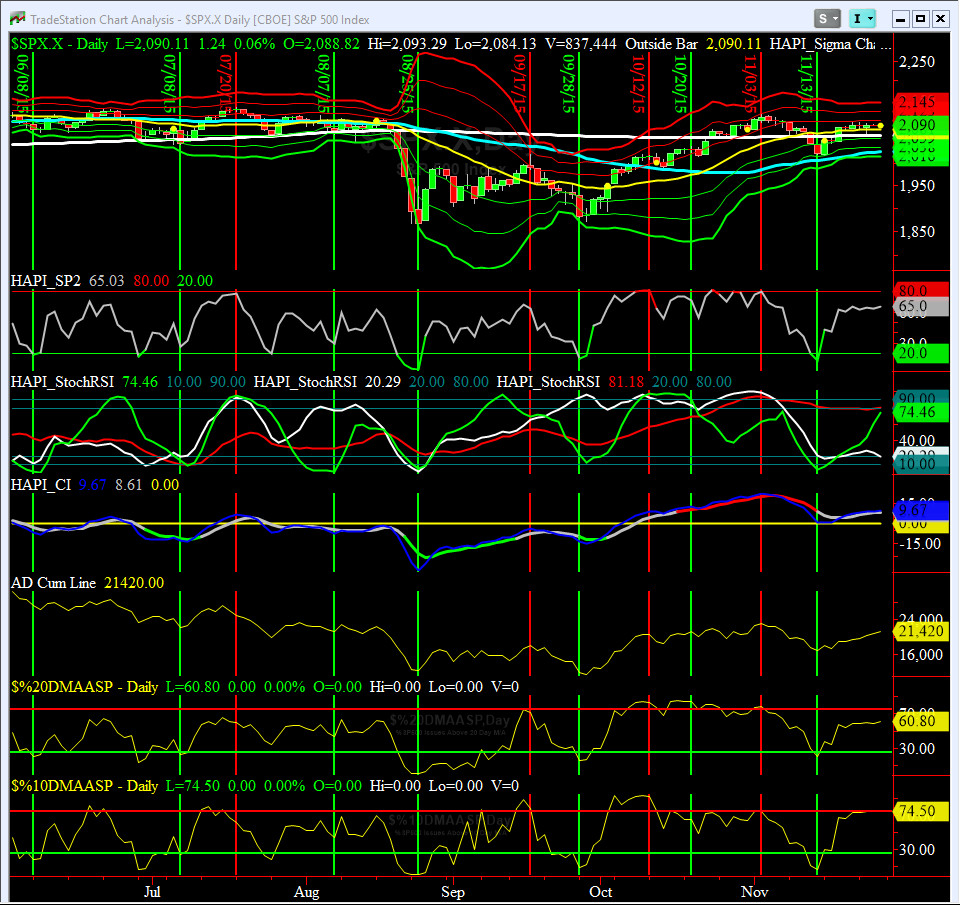
Most recent S&P-500 Cash Index (SPX): 2090.11 up 0.94 (up +0.05%) for the week ending on Friday, November 27th, 2015, which closed near its +0.5 sigma.

SPX ALL TIME INTRADAY HIGH = 2134.72 (reached on Wednesday, May 20th, 2015)
SPX ALL TIME CLOSING HIGH = 2130.82 (reached on Thursday, May 21st, 2015)

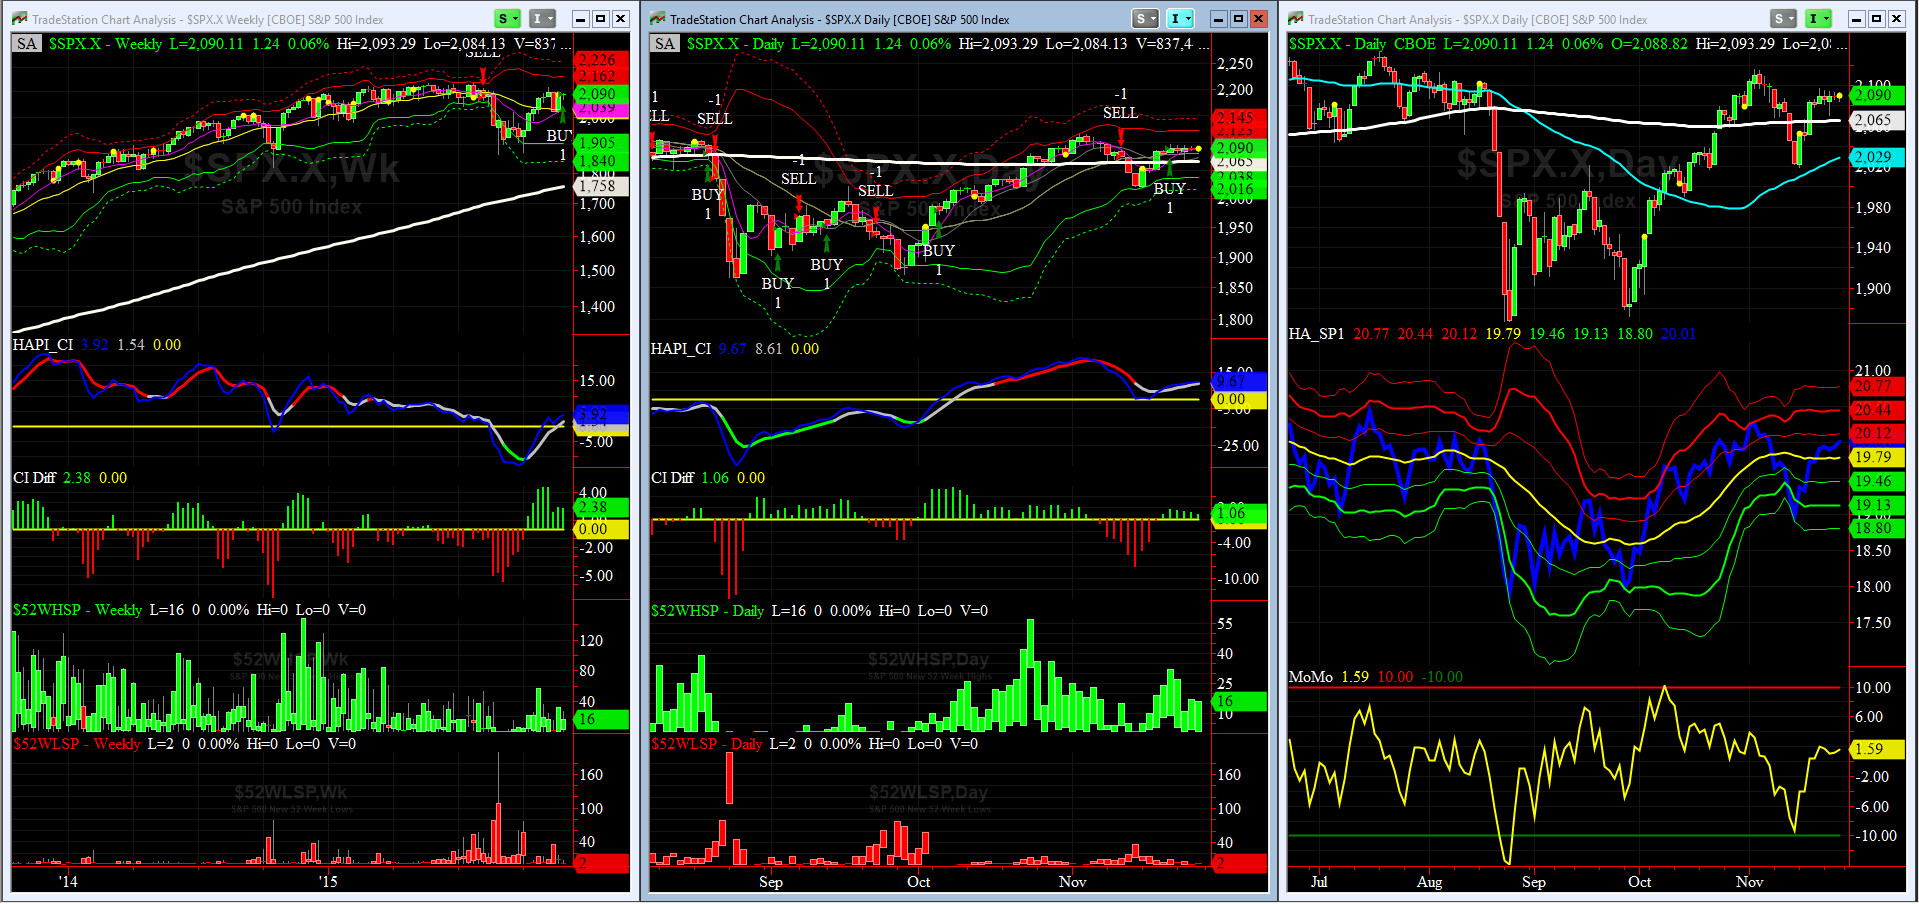
Current DAILY +2 Sigma SPX = 2123 with WEEKLY +2 Sigma = 2162
Current DAILY 0 Sigma (20 day MA) SPX = 2080 with WEEKLY 0 Sigma = 2033
Current DAILY -2 Sigma SPX = 2038 with WEEKLY -2 Sigma = 1905
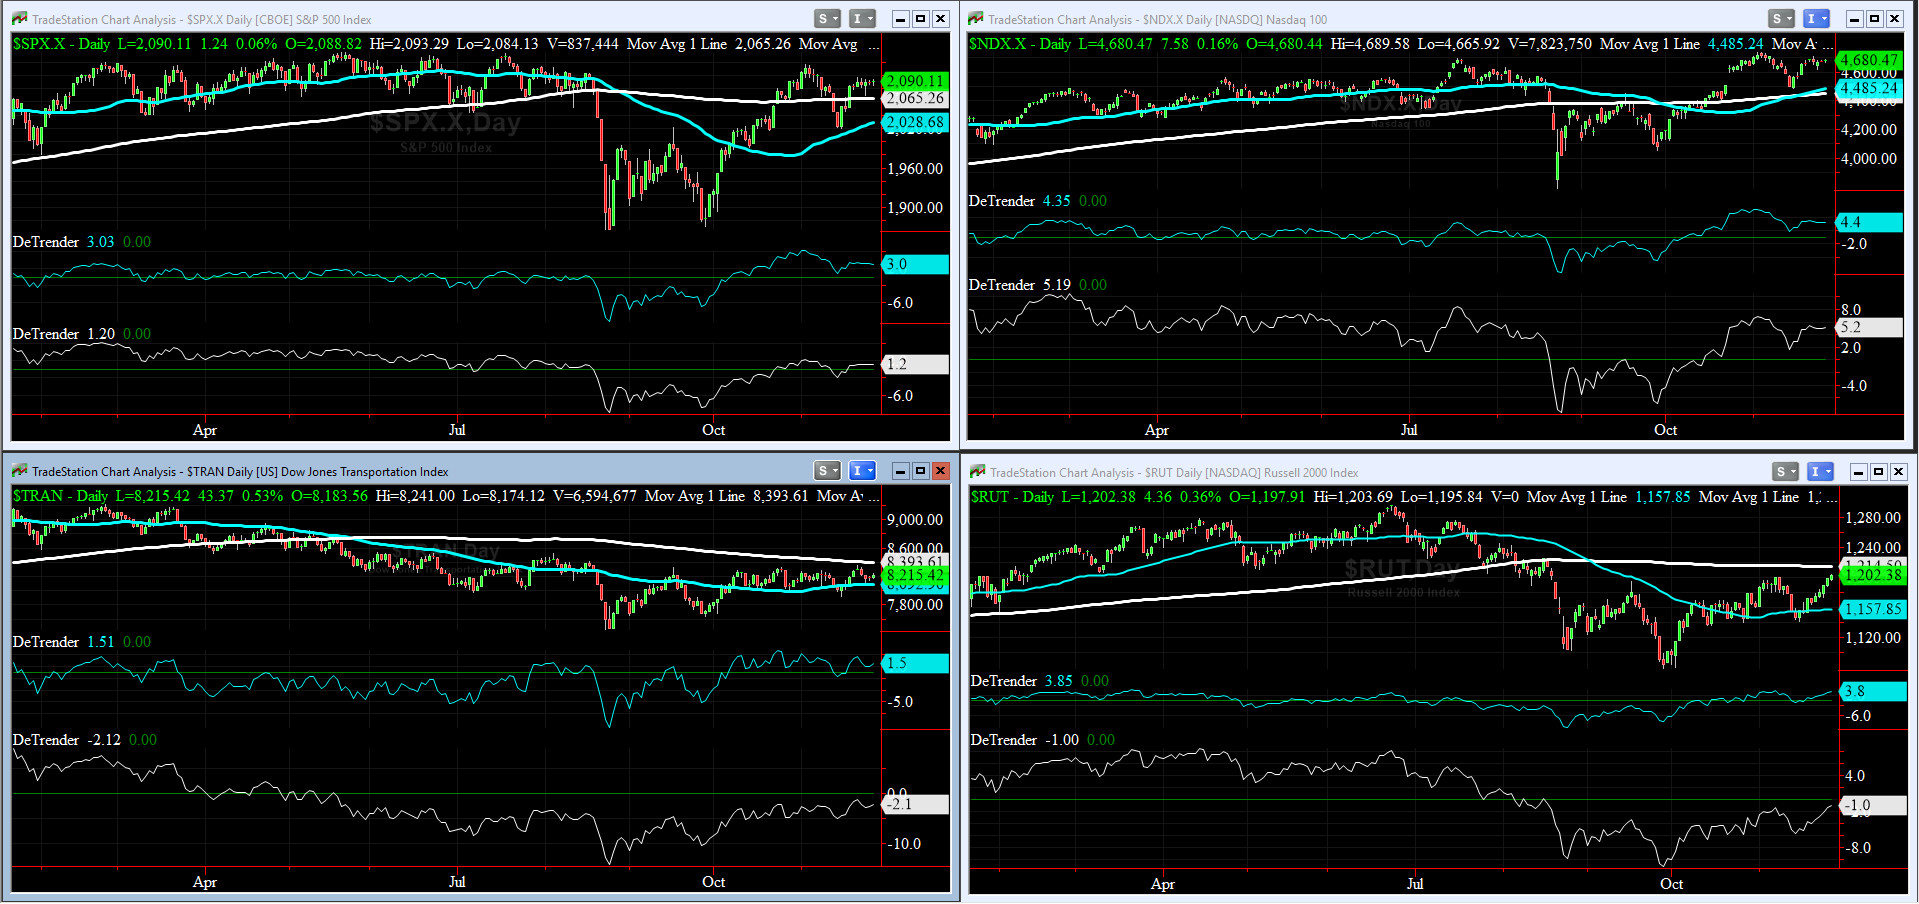
50-Day MA SPX =2029 or +3% below SPX (max observed in last 5 yrs = +8.6%, min = -9.3% )
200-Day MA SPX = 2065 or +1.2% below SPX (max observed in last 5 yrs = 15.2%, min = -14%)
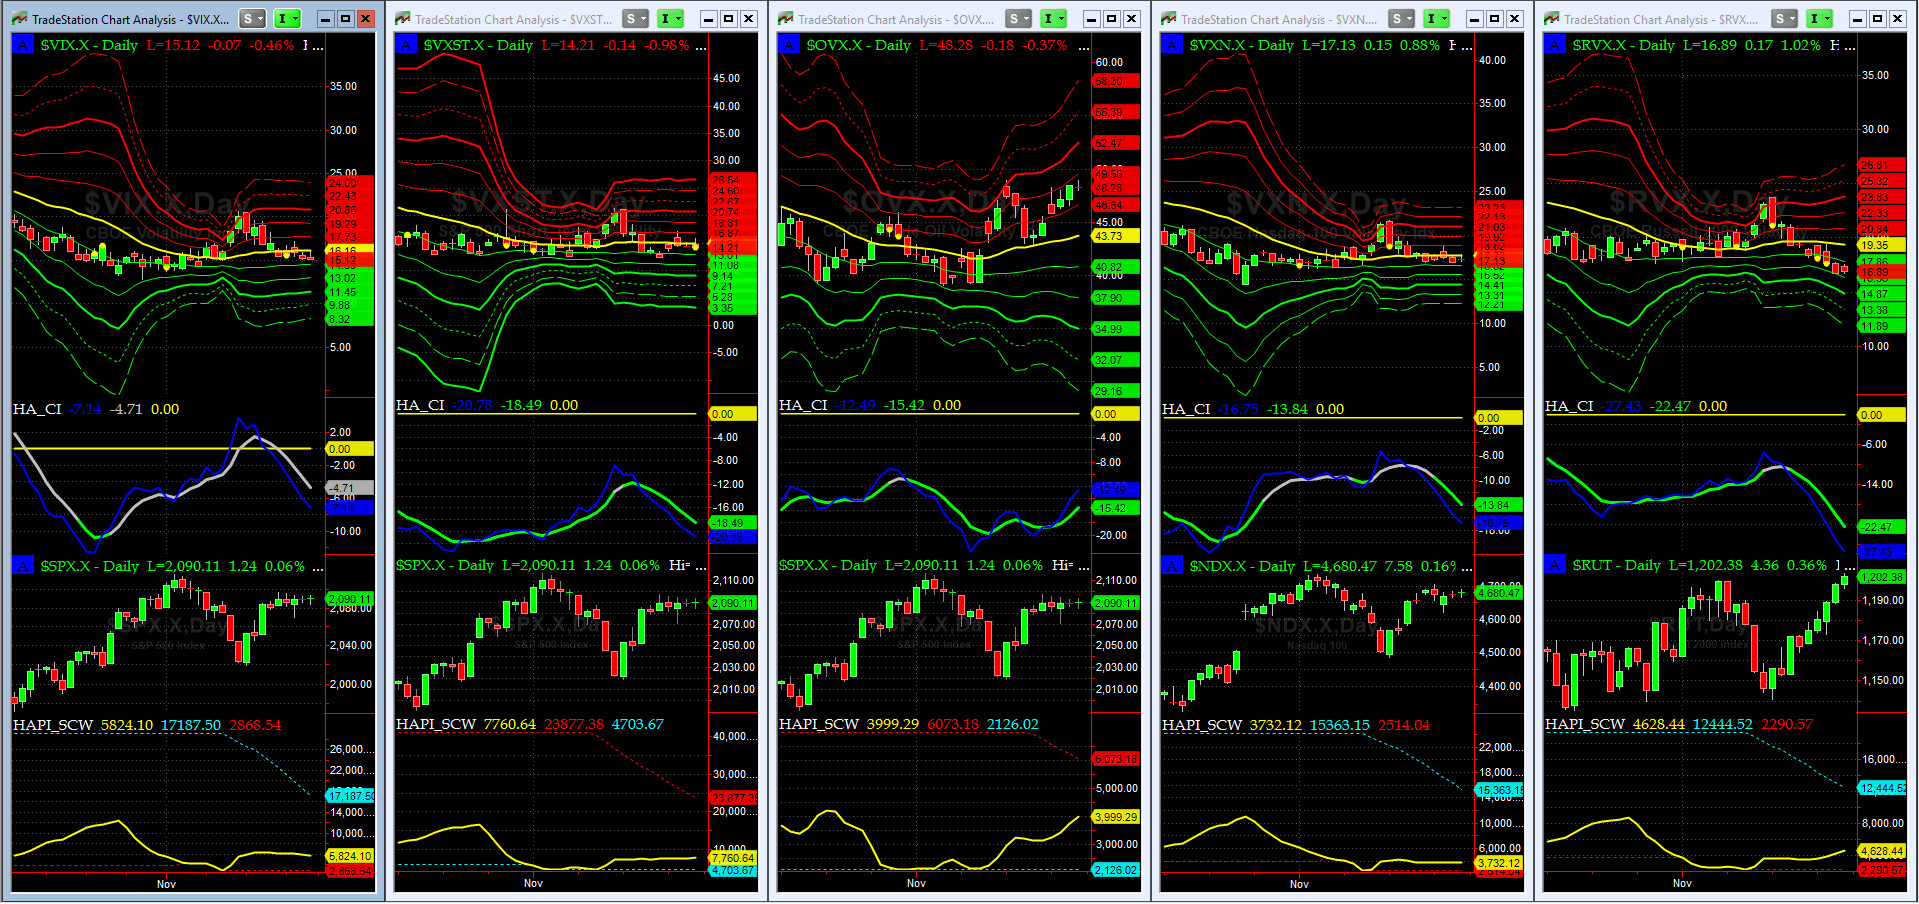
VIX = 20.08 which closed Friday above its +3 sigma (remember it’s the VIX’s vol pattern (its sigma channels) that matters, and not the level of VIX itself (this is per Dr. Robert Whaley, a great mentor and the inventor of original VIX, now called VXO. VIX usually peaks around a test of its +4 sigma))
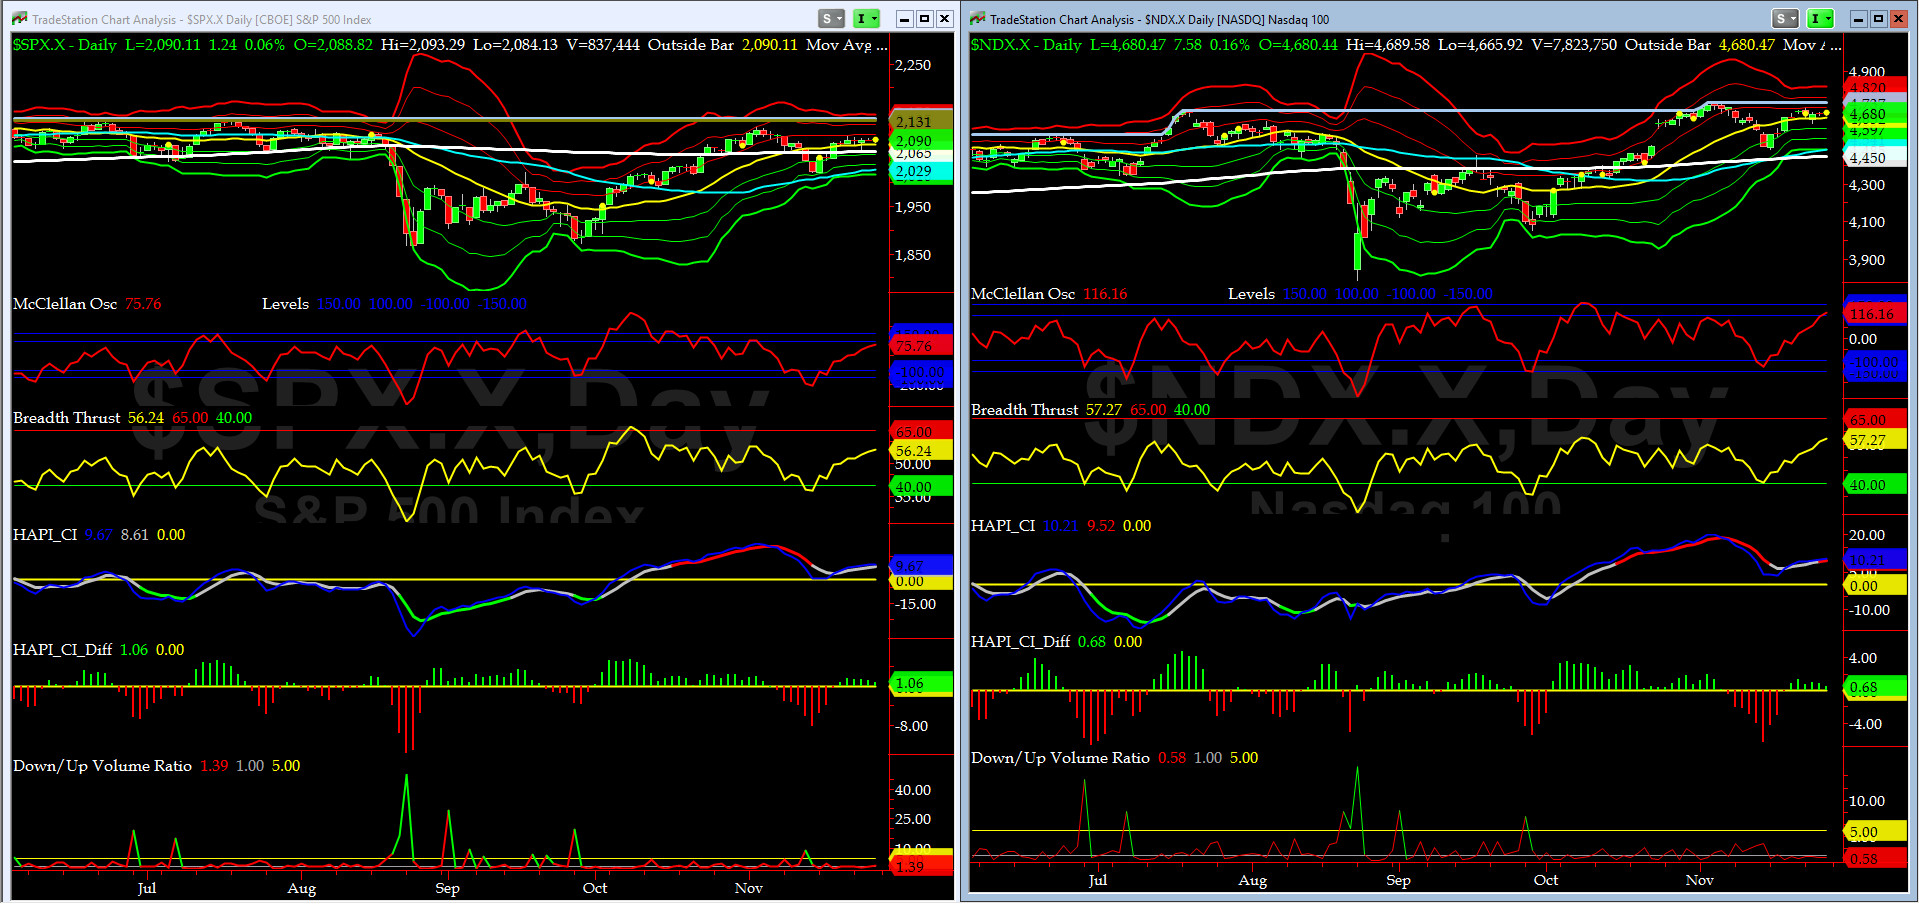
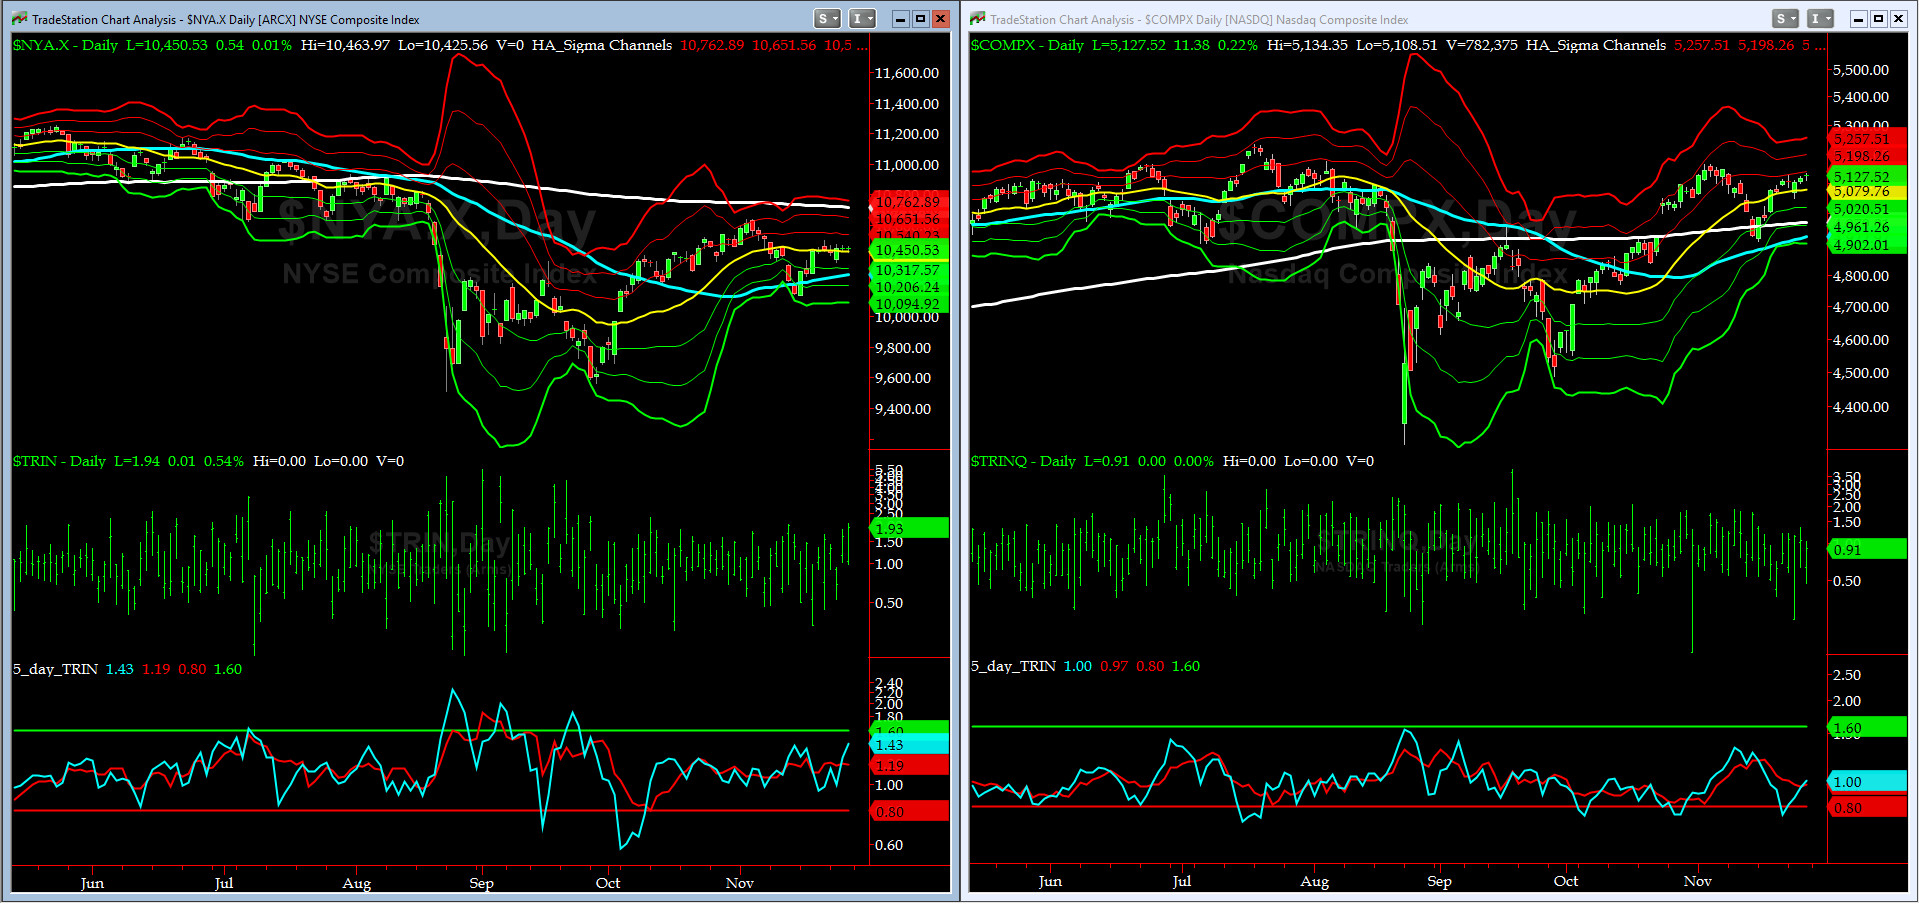
NYSE McClellan Oscillator = +75.8 (-150 is start of the O/S area; around -275 to -300 area or lower, we go into the “launch-pad” mode, over +150, we are in O/B area)
NYSE Breadth Thrust = 56.24 (40 is considered as oversold and 65 as overbought)
WEEKLY Timing Model = on a SELL Signal since Friday 8/7/15 CLOSE (first time in 32 months)
DAILY Timing Model = on a BUY Signal since Friday 10/20/15 CLOSE
Max SPX 52wk-highs reading last week = 27 (over 120-140, the local maxima is in)
Max SPX 52wk-Lows reading last week = 7 (over 40-60, the local minima is in)
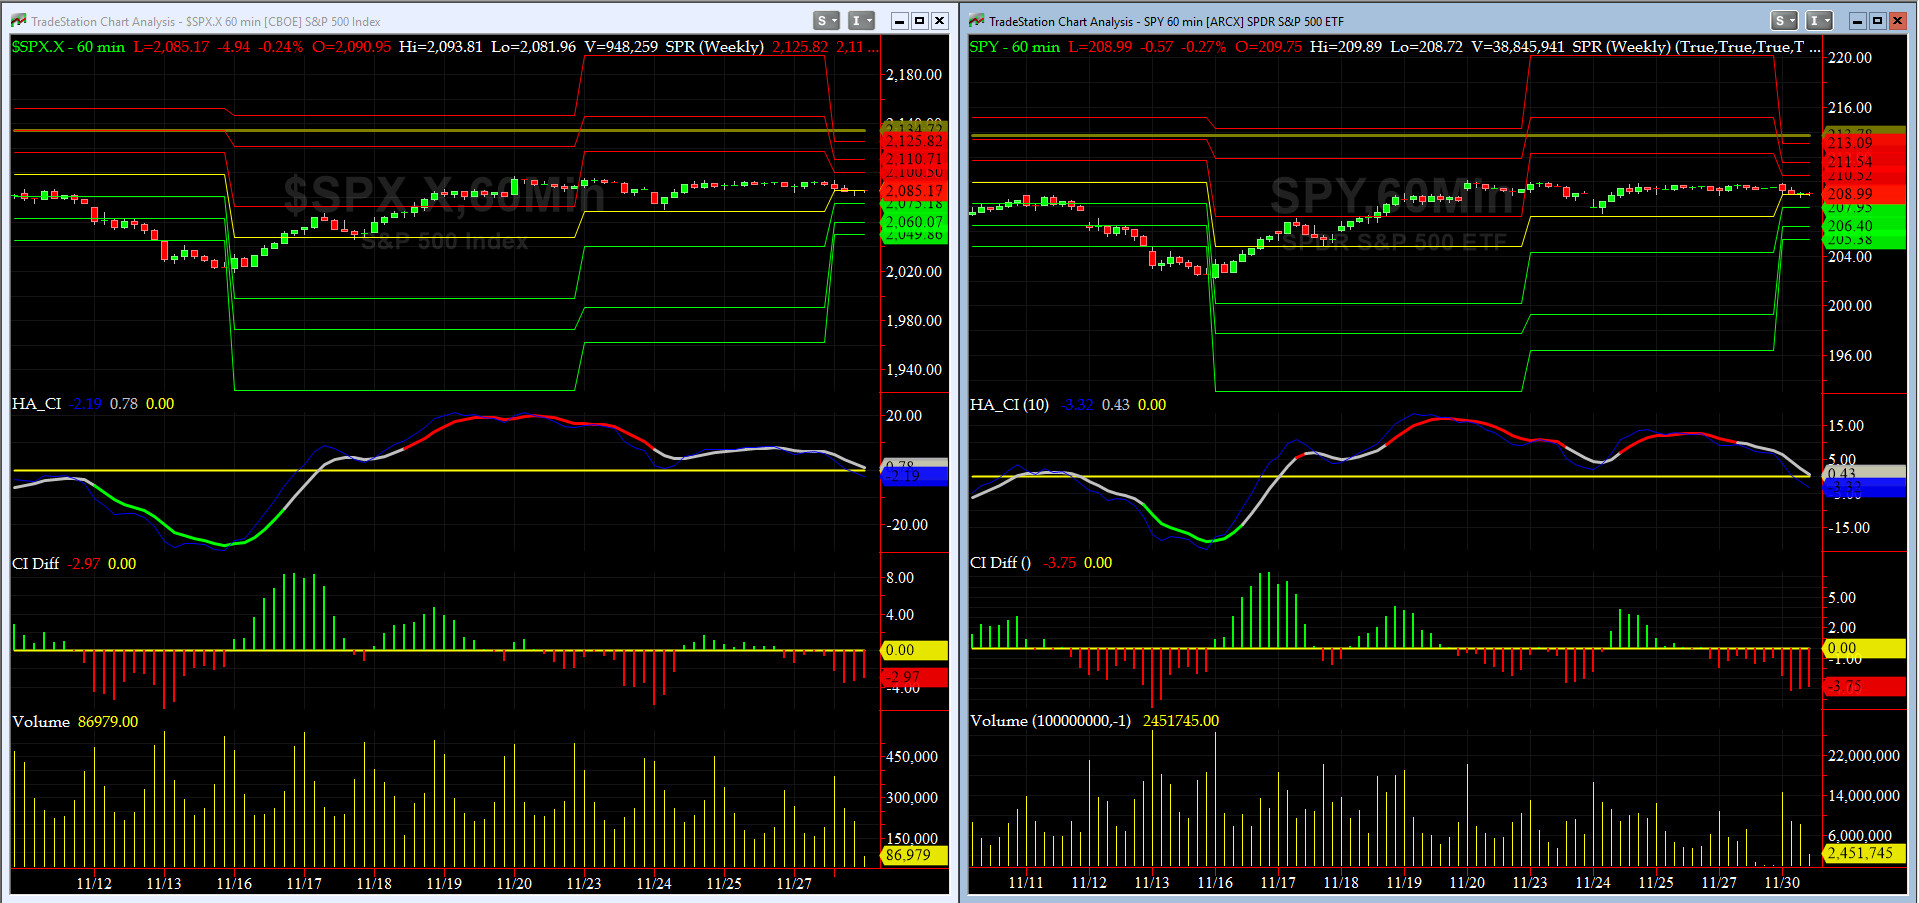
HA_SP1 = near its +0.5 Sigma
HA_Momo = +1.6 (reversals most likely occur above +10 or below -10)
HA_SP2 = 65.0(Buy signal <= 20, Sell Signal >= 80)
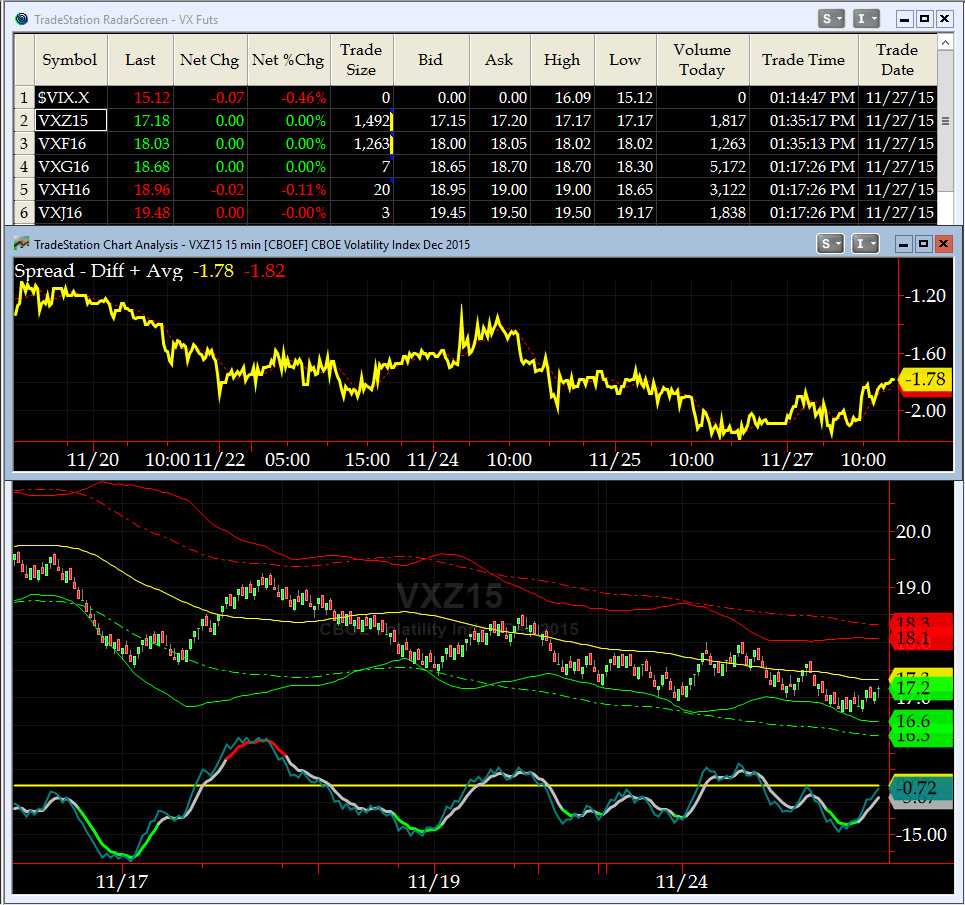
3-mo. VX Futures Spread (long NOV short FEB) = -1.78 (-3 to -2.5 SELL signal, 0 BUY Signal)
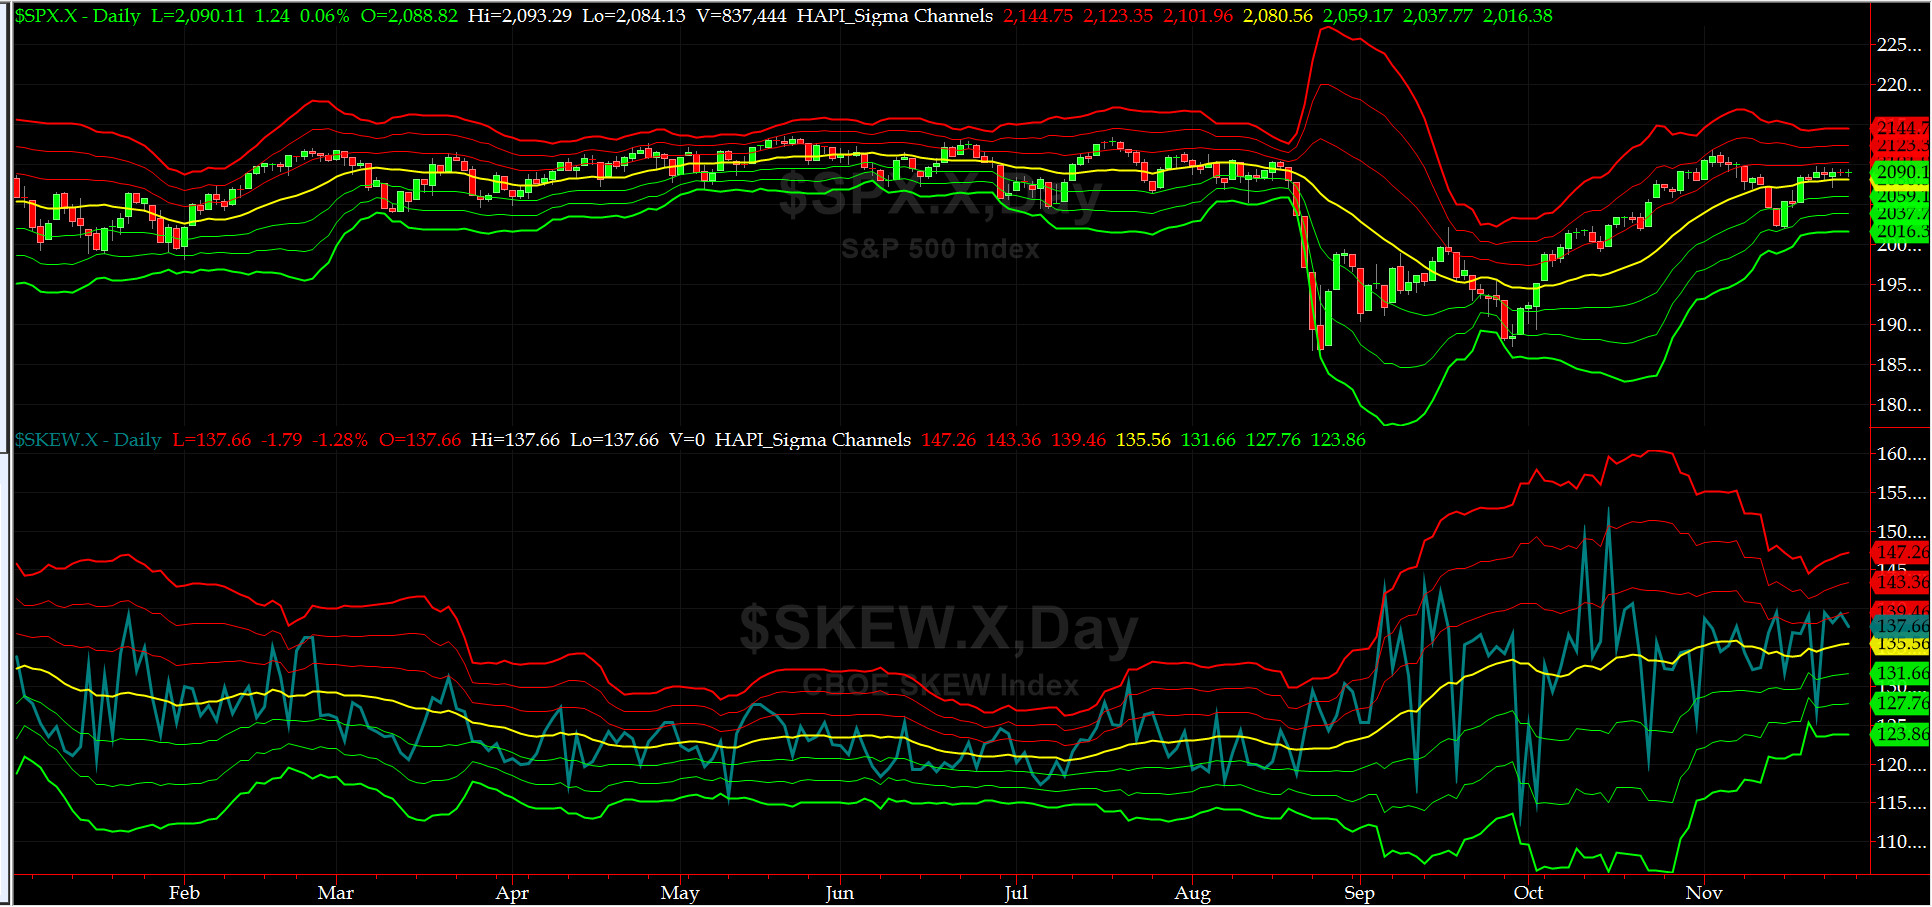
SPX SKEW (Tail Risk) = 137.7 (normal = 120-125, range 100-150)


Our current SPX Bias with Timer Digest: LONG SPX as of Tuesday, October 20th, 2015 Close at 2030.77
Our previous Bias: SHORT SPX (since Tuesday, October 6th, 2015 Close at 1979.92)


This WEEK’s Bias = Cautiously, LONG SPX Complex via Long Call Spreads.

Profit Target = 2105-2125
Money Management Stop = 2080

BOTTOM LINE: We are NOT short-term overbought yet. Tuesday (first of the new month) will be crucial ahead of NOV NFP on Friday at 0830ET. You may see an update from us, via email or on Twitter (from my co-pilot, @Capt_Tiko), should we hit overbought levels too fast.


NOTE: All LEVELS mentioned here have been, are, and will be, based on the S&P-500 SPX Cash Index, and not the ES Futures. Tomorrow after the first hour is complete, we will post here a companion chart showing critical short-term WEEKLY levels to watch for possible “retest failures.”

Fari Hamzei

Sunday, November 29, 2015 1315ET
Market Timing Charts & Comments


Timer Chart of S&P-500 Cash Index (SPX)

As in the past, the Thanksgiving week was a slow week for SPX. Our breadth & momentum indicators rose up to near overbought levels. NYSE McClellan Osc is at +75.8 and Breadth Thrust is at 56.24.


Canaries [in the Coal Mine] Chart for DJ TRAN & RUT Indices

The DJ Transports (proxy for economic conditions 6 to 9 months hence) went sideways but the Russell 2000 Small Caps (RUT, a proxy of RISK ON/OFF) had a channel breakout and took out Nov & Sept highs. RISK is ON again.


DeTrenders Charts for SPX, NDX, TRAN & RUT Indices

This past week, all of four 50DTs are positive, while only two of our four 200DTs are positive (SPX & NDX). Key 200DT to watch is RUT's.


HA_SP1_momo Chart

We are on SELL (WEEKLY Timing Model) as of August 8th, and BUY (DAILY Timing Model) as of Friday, November 20th. HA_SP1 is above its +1 sigma & HA_momo is now at +1.6.


Vol of the Vols Chart

Only OVX (Crude Oil Volatility) moved up this past week.
All Quiet on Mid-Western Front (where VIX is traded).... at least for now.


5-day TRIN & TRINQ Charts

Again, both 5-day TRIN & TRINQ are racing into BUY Zones (1.60 or higher).


Components of SPX above their respective 200day MA Chart

We are at 53% now after a hard bounce off of its 50Day MA (that's why we watch these MAs). Next target is 60%.


SPX SKEW (Tail Risk) Chart

After Friday Close, SPX SKEW (Tail Risk) dropped to 137 (to its +0.5 sigma). As we have mentioned here for several weeks now, this & our 3-mo. VX Spread have not been good tells.


3-month VIX Futures Spread(VX) Chart

Our 3-month VIX Futures Spread (Long DEEZ15 Short MAR16), is now at -1.78. This indicator nailed the Nov-13 bottom when it went positive. Only in America!!


HA_SP2 Chart

At 65, this prop indicator is slowly rising up to the overbought zone (80 plus) .


SPX 2011 Time-Shifted Analog for SPX 2015

If the Time-Shifted 2011 Analog holds, SPX is poised to have a pullback that should gather speed, dropping into middle of 2nd week of December. Size? roughly about 6% to 7% from where we are now. Of course, our other prop indicators must also confirm such a move.


SPX 1998 Time-Shifted Analog for SPX 2015


US Treasury T-Notes & T-Bonds Yields Chart

This past week, the YTM for the front end of Treasury Yield Curve took off to over its MONTHLY Resistance 3 Level (1.55%) while the longer-dated paper pulled back near their respective MONTHLY Resistance 1 Levels (inline with RISK_ON sentiment).

Good luck this week,
Fari Hamzei


Customer Care:


Chat with Fari on TradeStation.com Fari Hamzei writes for CBOE Options Hub on event-deriven basis       Futures & Options for Stock Indices
HA YouTube Channel  :::  HA Blog  :::  Testimonials  :::  Tutorials & FAQs  :::  Privacy Policy
(c) 1998-2024, Hamzei Analytics, LLC.   All Rights Reserved.