
|
 |
 |
 |
 |
 |
 |
 |
 |
 Proactive Market Timing Proactive Market Timing
|
|
|
Most Recent PMT vs SPX Performance Chart

|
|
|
|
Monday, December 28, 2015, 1045ET
Companion Chart for Market Bias Review, Issue #124

|
|
|
|
|
|
Sunday, December 27, 2015, 1930ET
Market Bias Review, Issue #124
Most recent S&P-500 Cash Index (SPX): 2060.99 up +55.44 (up +2.76%) for the week ending on Thursday, December 24th, 2015, which closed near its zero sigma.
SPX ALL TIME INTRADAY HIGH = 2134.72 (reached on Wednesday, May 20th, 2015)
SPX ALL TIME CLOSING HIGH = 2130.82 (reached on Thursday, May 21st, 2015)
Current DAILY +2 Sigma SPX = 2109 with WEEKLY +2 Sigma = 2139
Current DAILY 0 Sigma (20 day MA) SPX = 2055 with WEEKLY 0 Sigma = 2022
Current DAILY -2 Sigma SPX = 2003 with WEEKLY -2 Sigma = 1906
50-Day MA SPX =2065 or 0.2% above SPX (max observed in last 5 yrs = +8.6%, min = -9.3% )
200-Day MA SPX = 2061 or 0% above SPX (max observed in last 5 yrs = 15.2%, min = -14%)
VIX = 15.7 which is just above its -1 sigma (remember it�s the VIX�s vol pattern (its sigma channels) that matters, and not the level of VIX itself (this is per Dr. Robert Whaley, a great mentor and the inventor of original VIX, now called VXO. VIX usually peaks around a test of its +4 sigma))
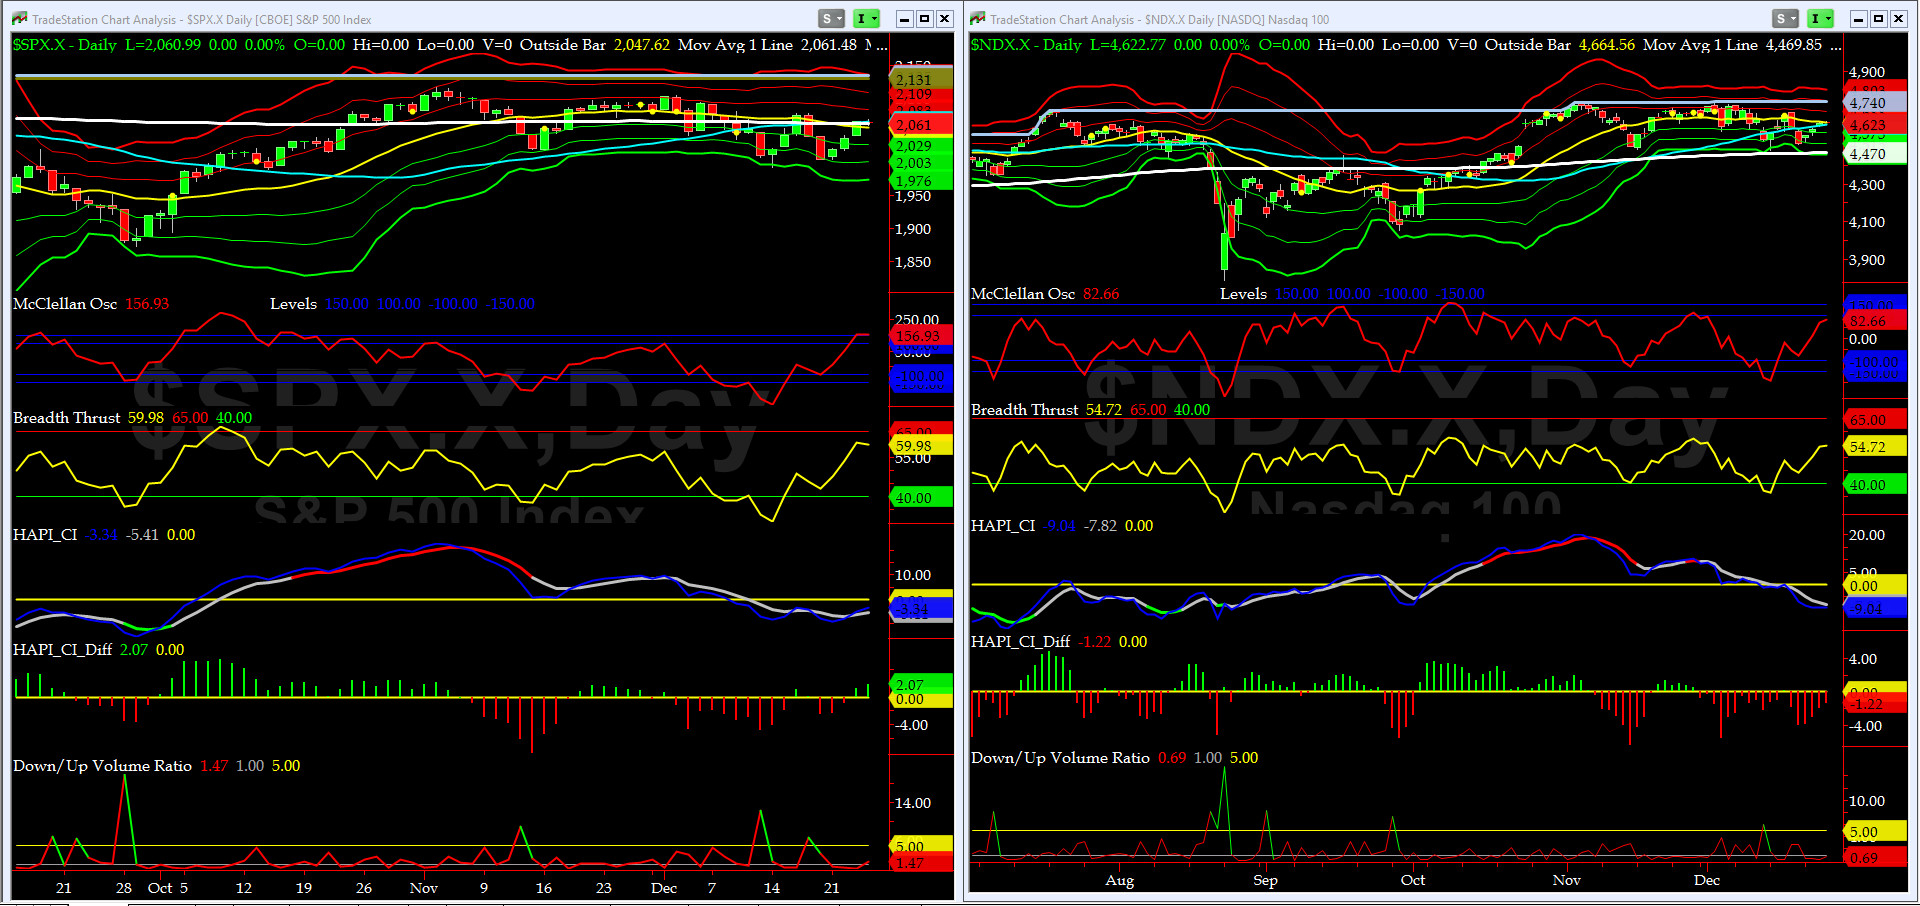
NYSE McClellan Oscillator = +157 (-150 is start of the O/S area; around -275 to -300 area or lower, we go into the �launch-pad� mode, over +150, we are in O/B area)
NYSE Breadth Thrust = 60 (40 is considered as oversold and 65 as overbought)
WEEKLY Timing Model = on a BUY Signal since Friday 11/27/15 CLOSE
DAILY Timing Model = on a SELL Signal since Thursday 12/3/15 CLOSE
Max SPX 52wk-highs reading last week = 14 (over 120-140, the local maxima is in)
Max SPX 52wk-Lows reading last week = 20 (over 40-60, the local minima is in)
HA_SP1 = near its +1 Sigma
HA_Momo = +3.8 (reversals most likely occur above +10 or below -10)
HA_SP2 = 59.3 (Buy signal <= 20, Sell Signal >= 80)
3-mo. VX Futures Spread (long JAN short APR) = -1.24 (-3 to -2.5 SELL signal, 0 BUY Signal)
SPX SKEW (Tail Risk) = 128.8 which is below its -1 sigma (normal = 120-125, range 100-150)
Our current SPX Bias with Timer Digest: SHORT SPX as of Thursday, December 24th, 2015 Close at 2060.99
Our previous Bias: LONG SPX (since Tuesday, October 20th, 2015 Close at 2030.77)
This WEEK�s Bias = SHORT SPX or SPY via Put Spreads
Profit Target = 2020 to 2000
Money Management Stop = 2070
BOTTOM LINE: We expect some year-end tax selling in the next couple of trading days -- beyond that, something else is wrong out there: High Yield Credit, Crude Oil or both. Keep your bet size in check.
NOTE: All LEVELS mentioned here have been, are, and will be, based on the S&P-500 SPX Cash Index, and not the ES Futures. Tomorrow after the first hour is complete, we will post here a companion chart showing critical short-term WEEKLY levels to watch for possible �retest failures.�
Happy New Year to All....
Fari Hamzei
|
|
|
|
|
|
Sunday, December 27, 2015, 1917ET
Notice of Change of Market Bias with Timer Digest
Dear Jim,
We are going SHORT SPX as of Thursday Close at 2060.99 and thereby locking in a tad over 30 SPX handles since October 20th.
This is a very short term trade, duration should be about one week to 10 calendar days.
Fari Hamzei
|
|
|
|
|
|
Saturday, December 26, 2015 1030ET
Market Timing Charts & Comments
Timer Chart of S&P-500 Cash Index (SPX)
The bounce off of the Friday December 18 (my BD) Low was strong and solid. ZH & Dougie Followers ran for the hills as predicted on Twitter by yours truly. It was a no-brainer.
Our momentum and breadth indicators were short-term very oversold with Bullish Divergences almost on every equity chart.
Now we are entering a mild overbought condition.
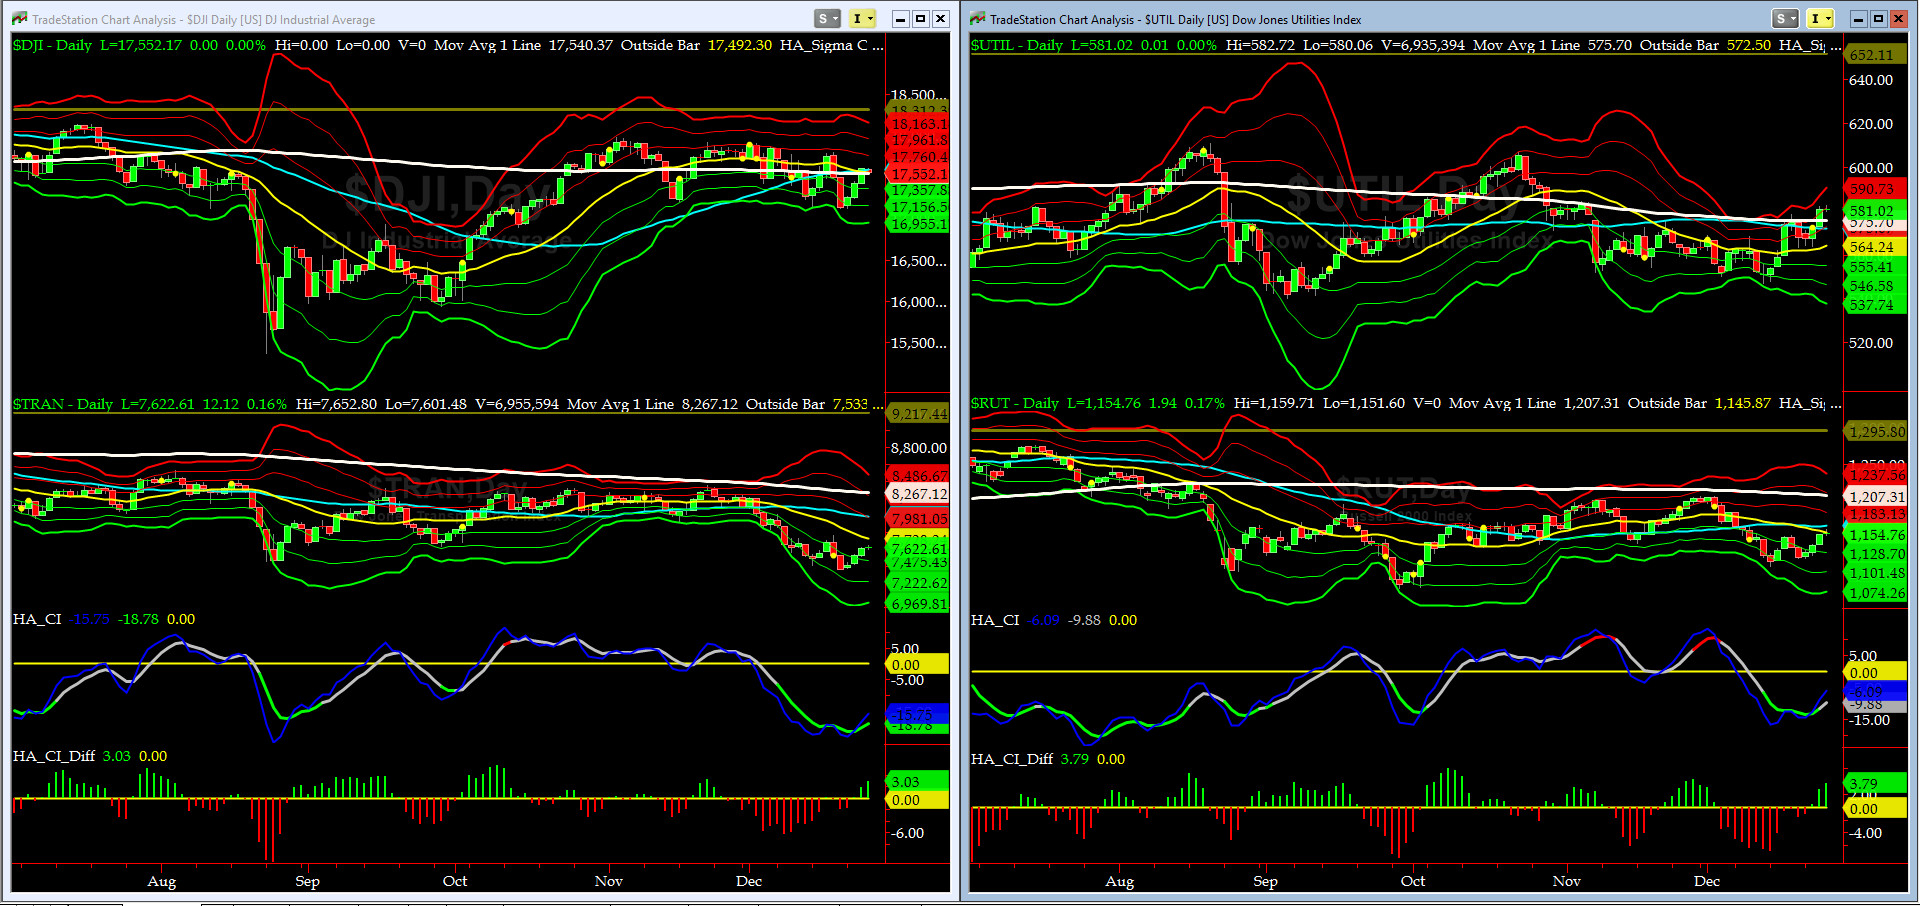
Canaries [in the Coal Mine] Chart for DJ TRAN & RUT Indices
By Thursday, Xmas Eve, both the DJ Transports (proxy for economic conditions 6 to 9 months hence) & Russell 2000 Small Caps (proxy for RISK ON/OFF), had recovered about 30% & 50% (respectively) of their December drop with their CIs still in green but now with positive slopes. RISK is coming back but still OFF for now.
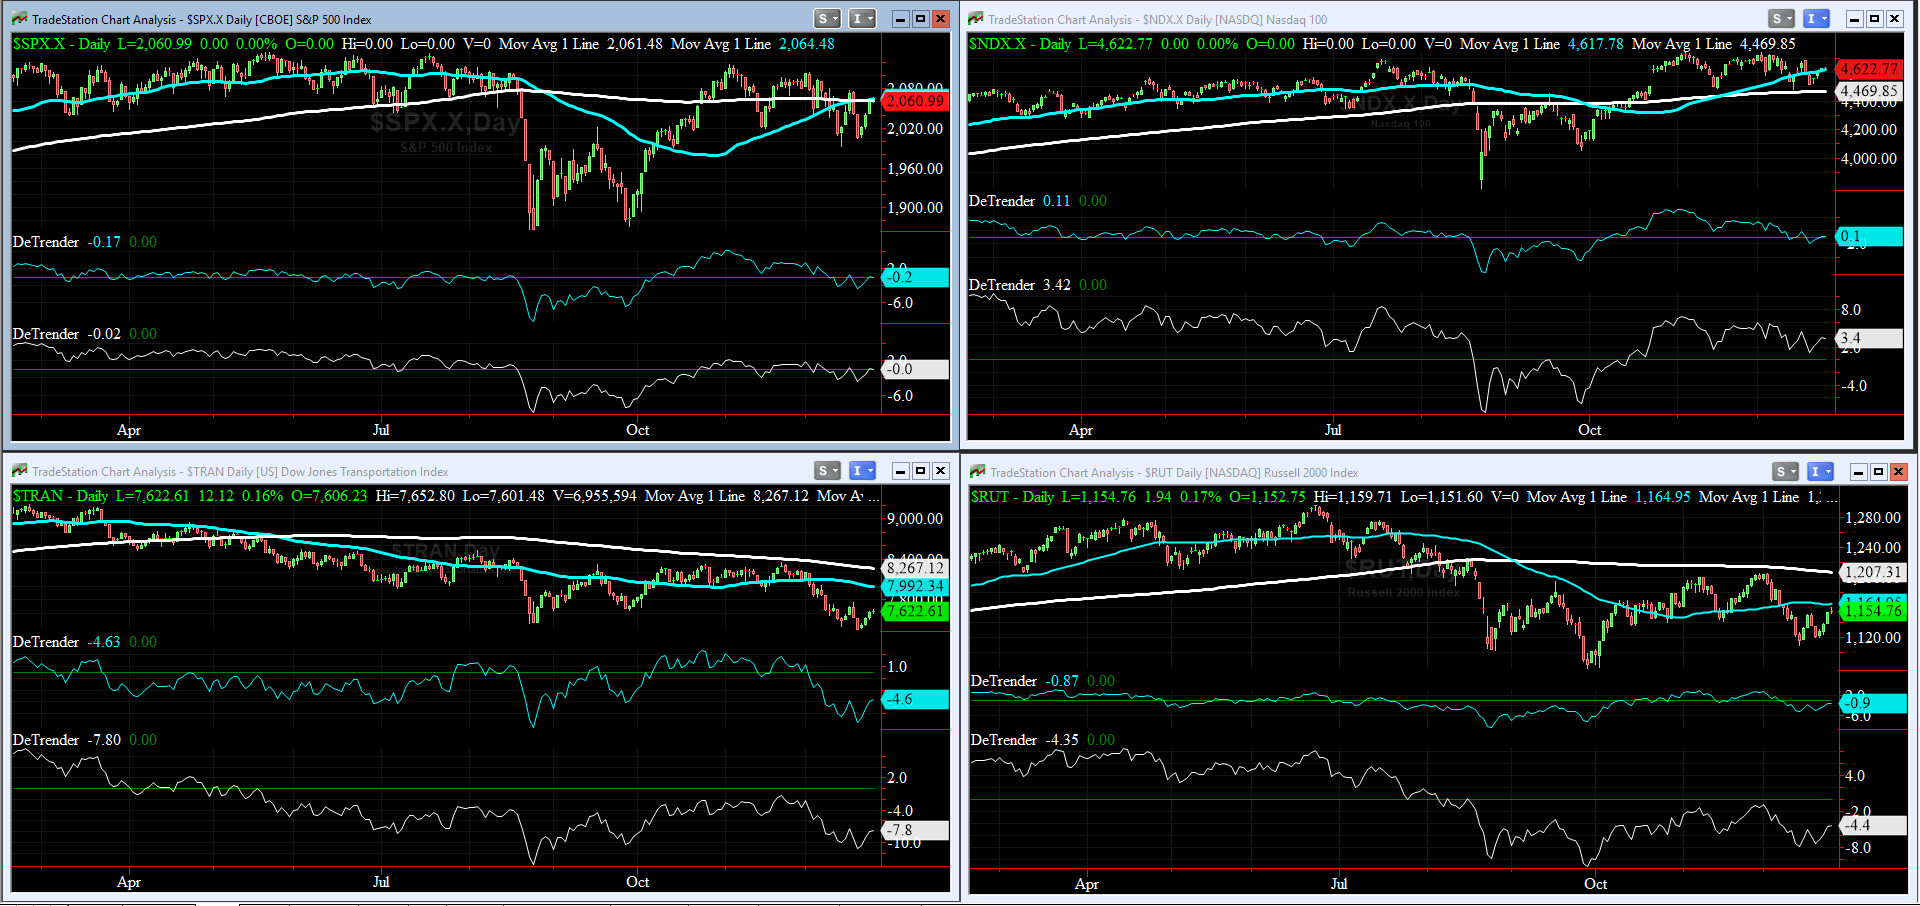
DeTrenders Charts for SPX, NDX, TRAN & RUT Indices
Much like a week ago, as of Friday Close, SIX out of our EIGHT 50DTs & 200DTs are negative, while only NDX DTs are positive this week.

HA_SP1_momo Chart
Our WEEKLY Timing Model remains on a BUY while our DAILY Timing Model is on a SELL (this should change very soon, ioho).
HA_SP1 remains around its +1 sigma & HA_momo is now at +3.8. The new 52wk highs for SPX rose to 14, while new 52wk lows eased off to 20 (40 is generally accepted as the threshold for reversal).
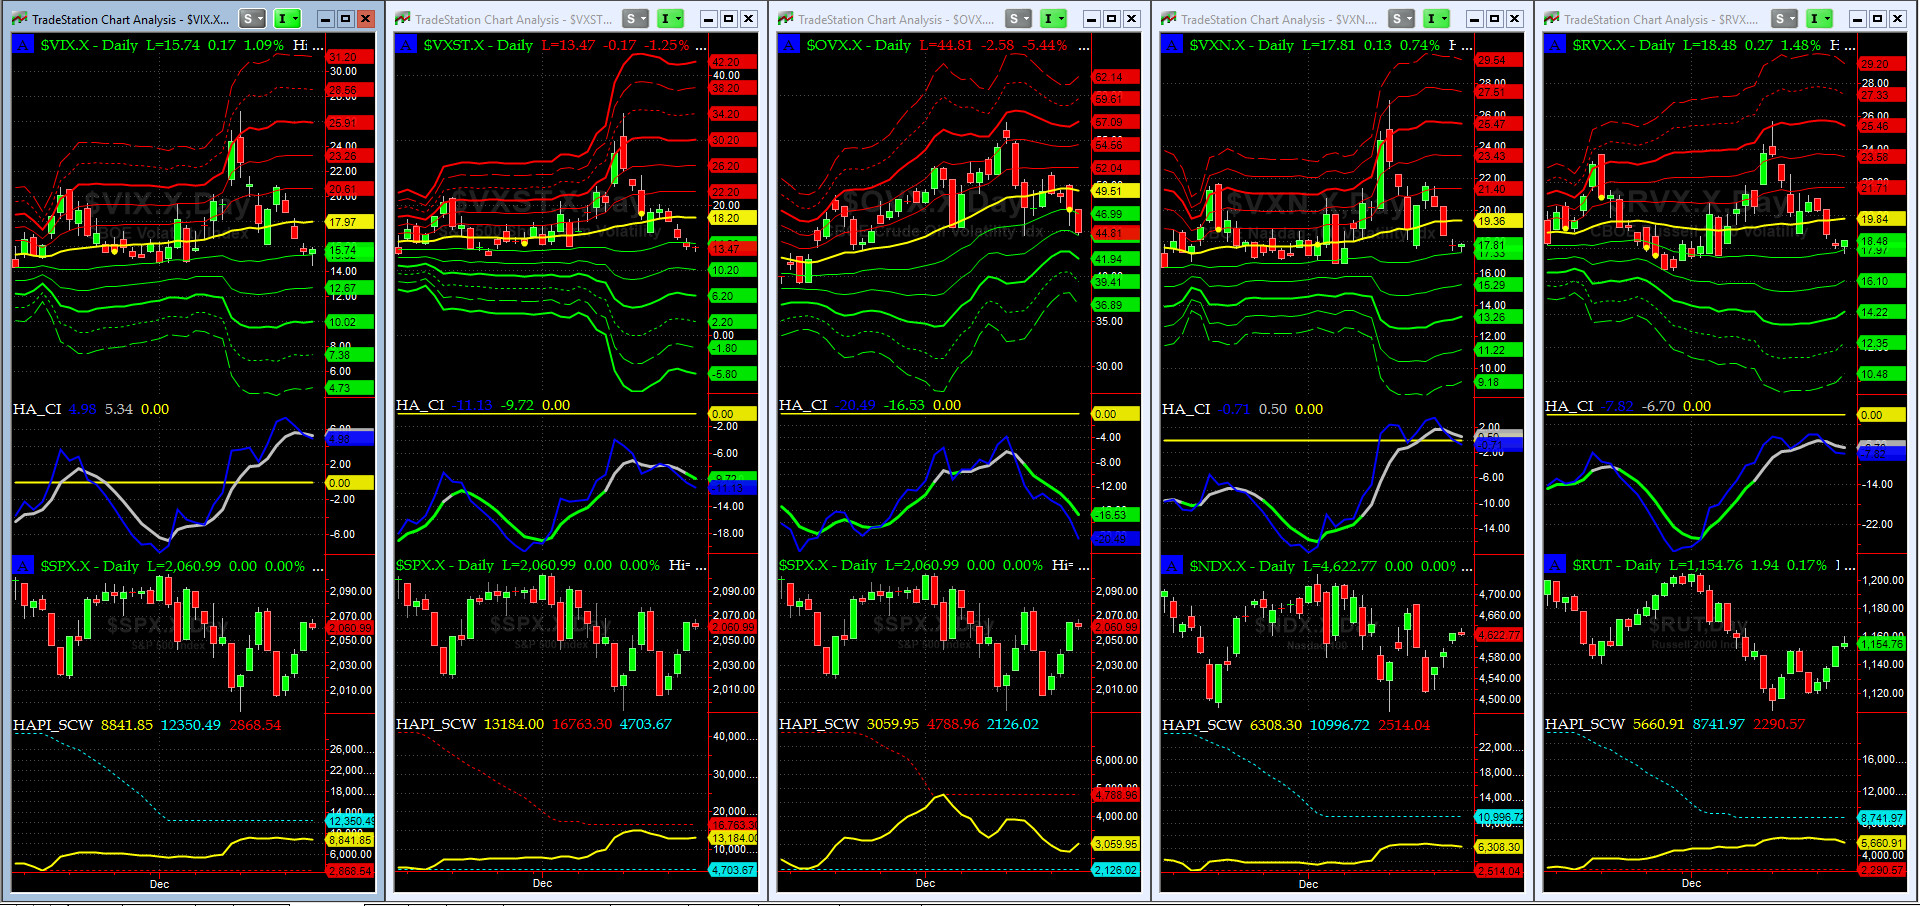
Vol of the Vols Chart
As discussed in PMT Review #123, vols collapsed this week. Again, another no-brainer. Must pay attention to Sigma Channels and this week to CIs.
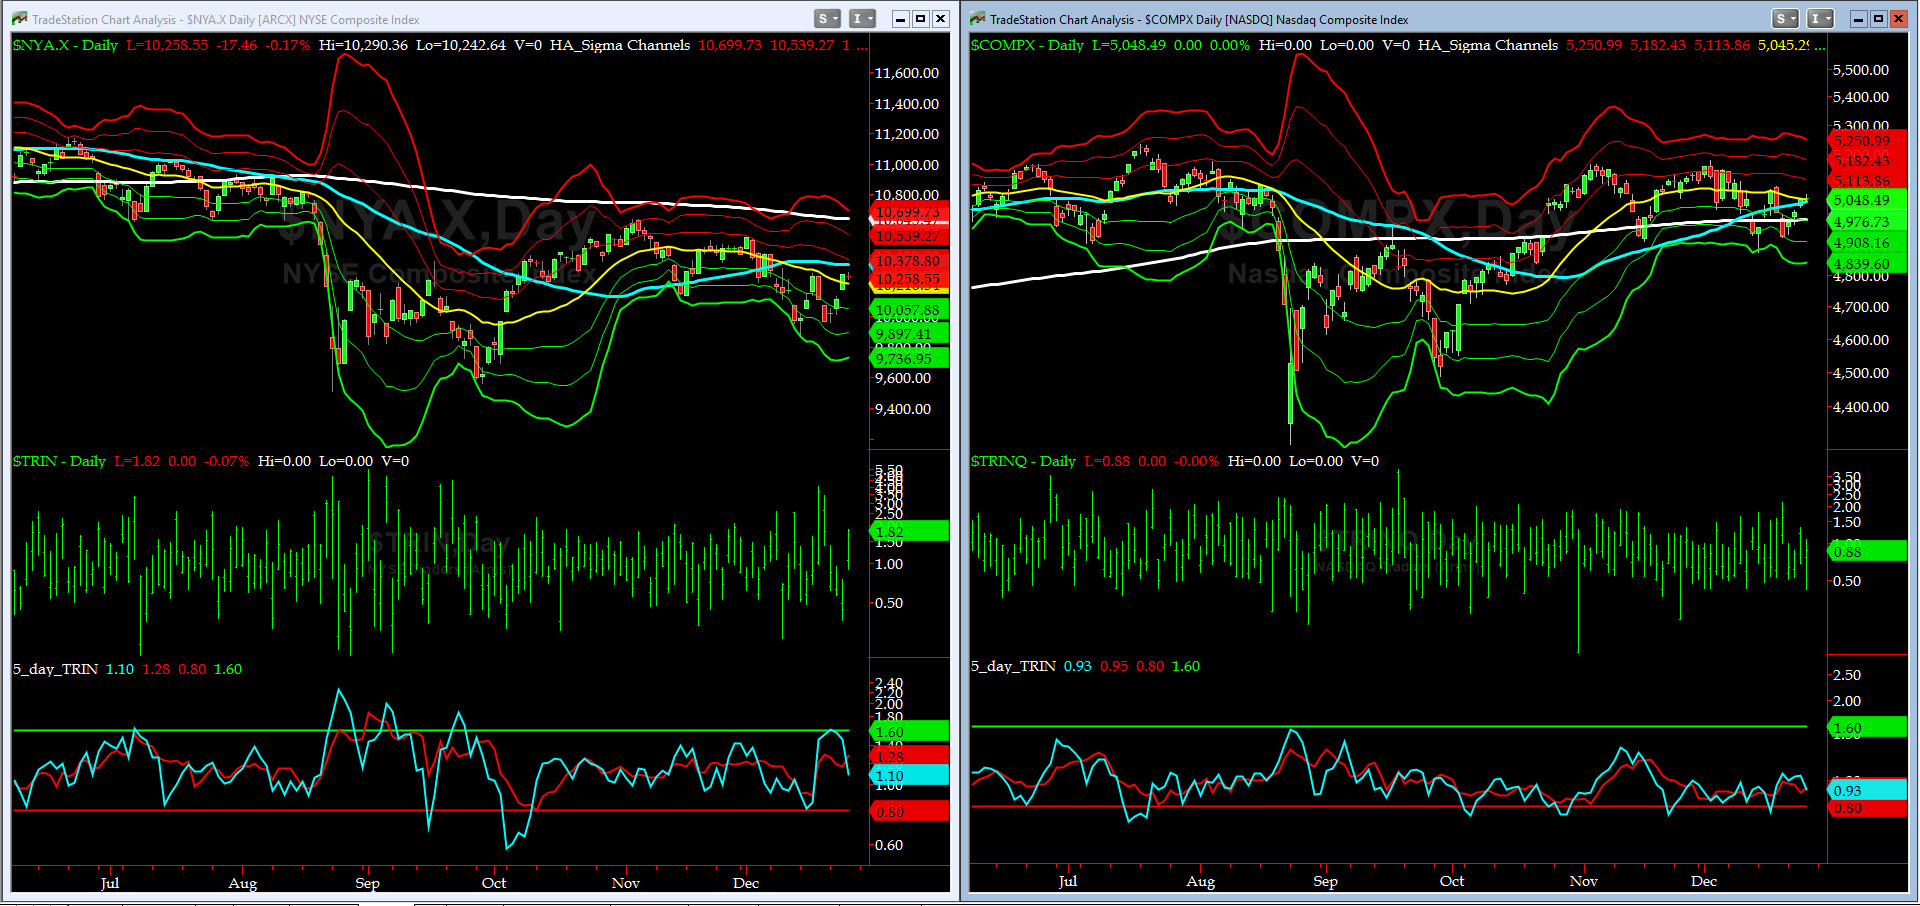
5-day TRIN & TRINQ Charts
Excellent [confirming] BUY signal by the 5-day TRIN (for NYSE), while TRINQ (for NASDAQ) is still neutral with a 0.93 reading.
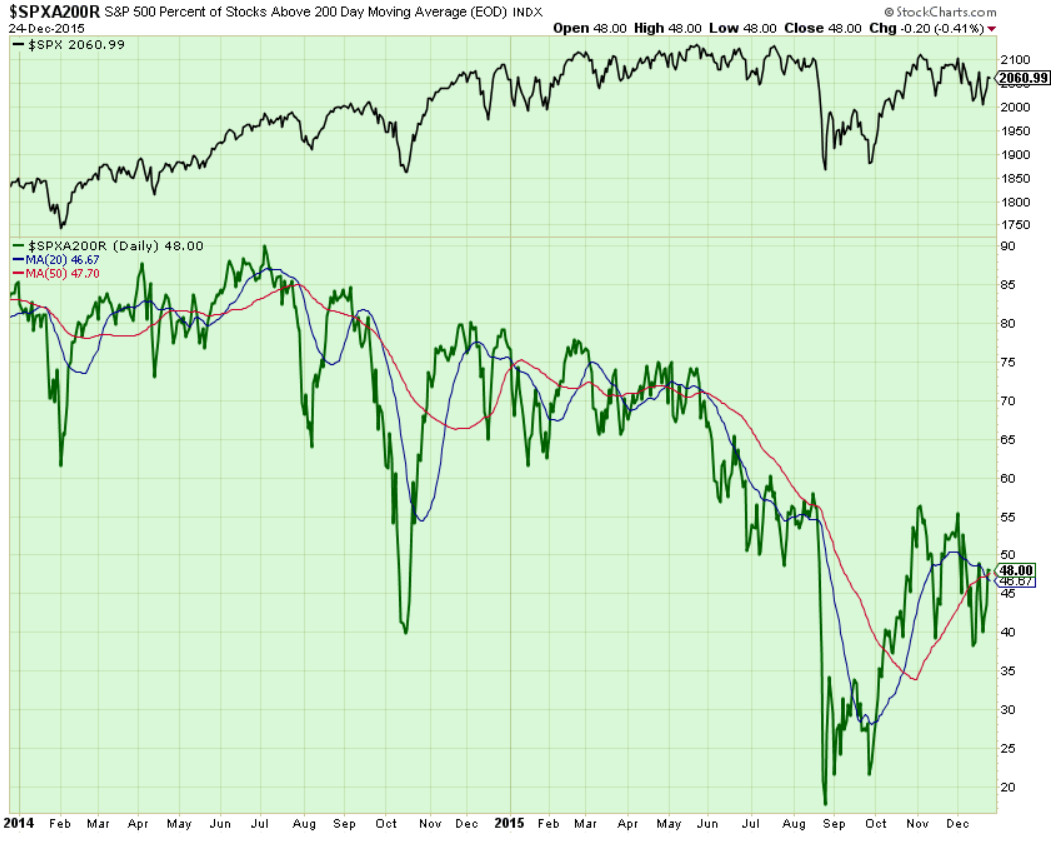
Components of SPX above their respective 200day MA Chart
This scoring indicator went nowhere fast last week. Our co-pilot, @Capt_Tiko is right. We need more Foumanat Tea.
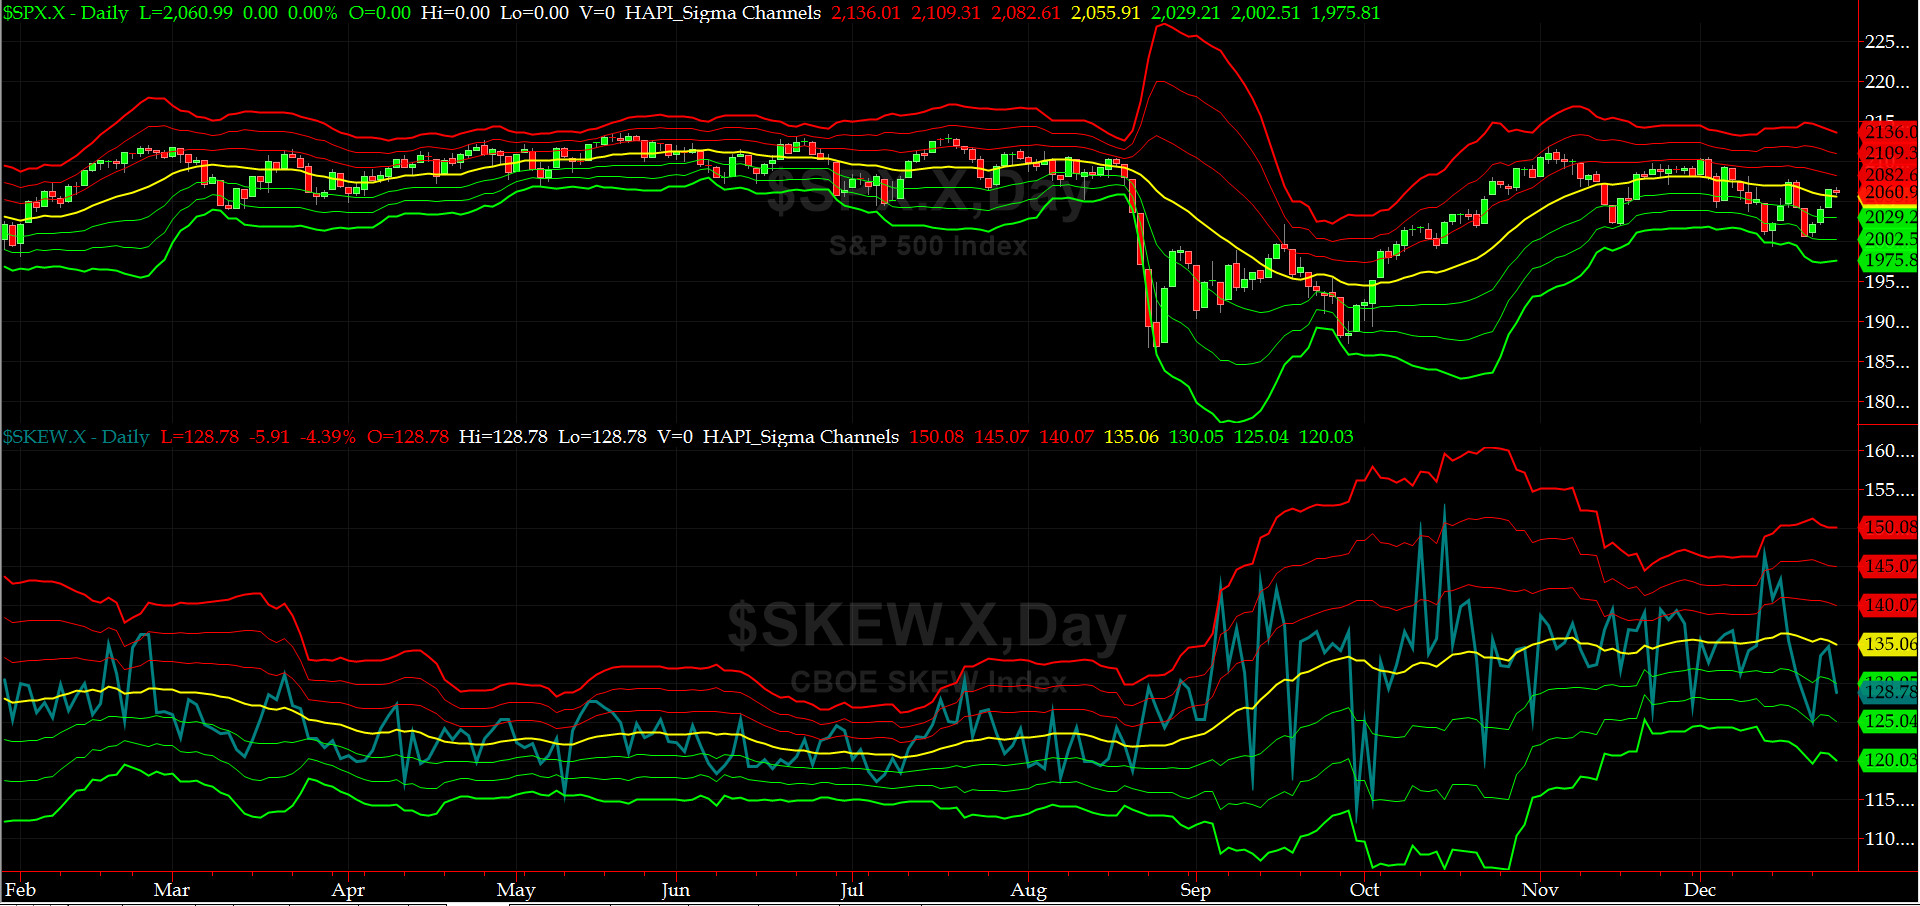
SPX SKEW (Tail Risk) Chart
It turns out that on December 18, prelim calcs for SPX SKEW stopped CBOE from publishing it (shot over design limits? most likely....).
On Xmas Eve, SPX SKEW (Tail Risk) plummeted to 128.8 (below its -1 sigma).
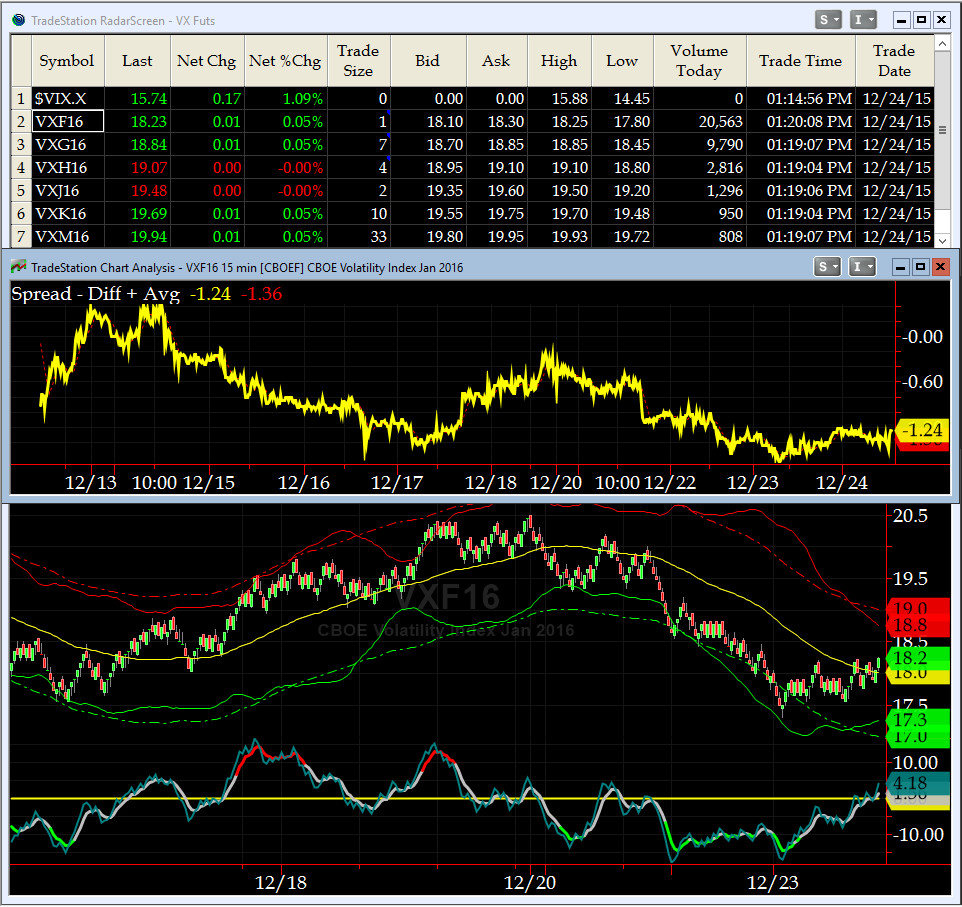
3-month VIX Futures Spread(VX) Chart
Our 3-month VIX Futures Spread (Long JAN16 Short APR16), closed at -1.24 on XMas Eve (again, great signaling by this indicator last weekend -- you can read more about this awesome algo on CBOE Options Hub under HA section).
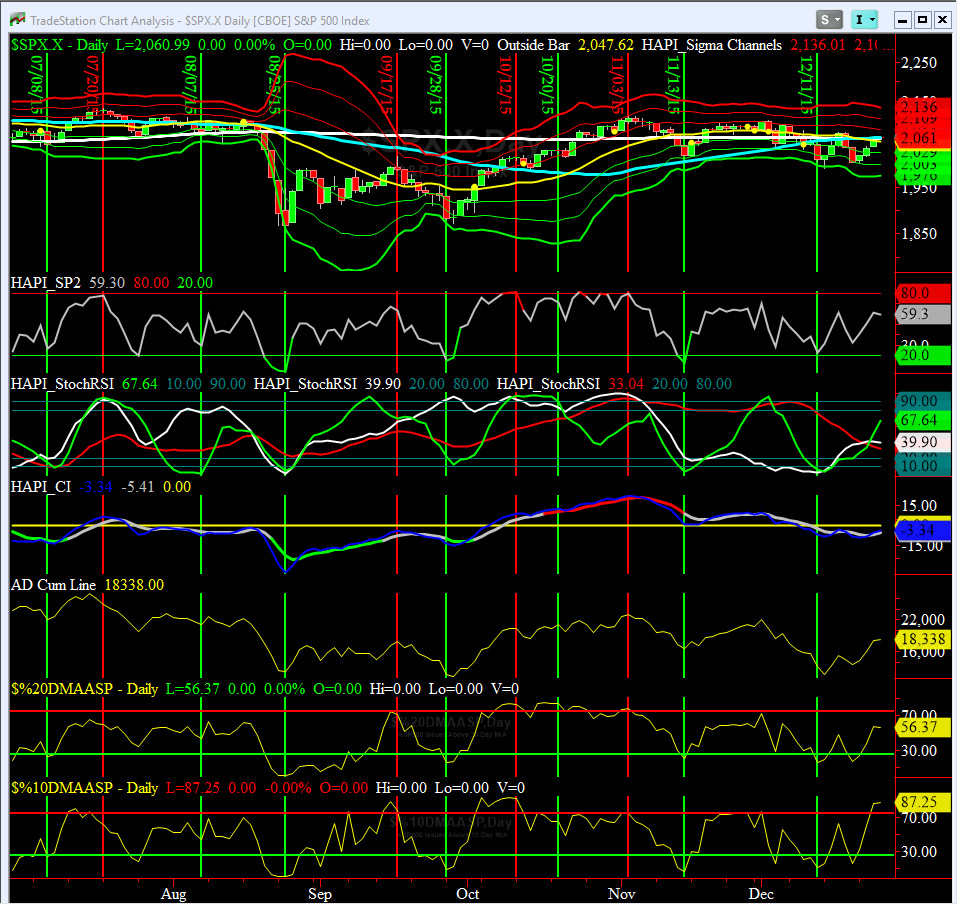
HA_SP2 Chart
At 59, this prop indicator is neutral, for now.
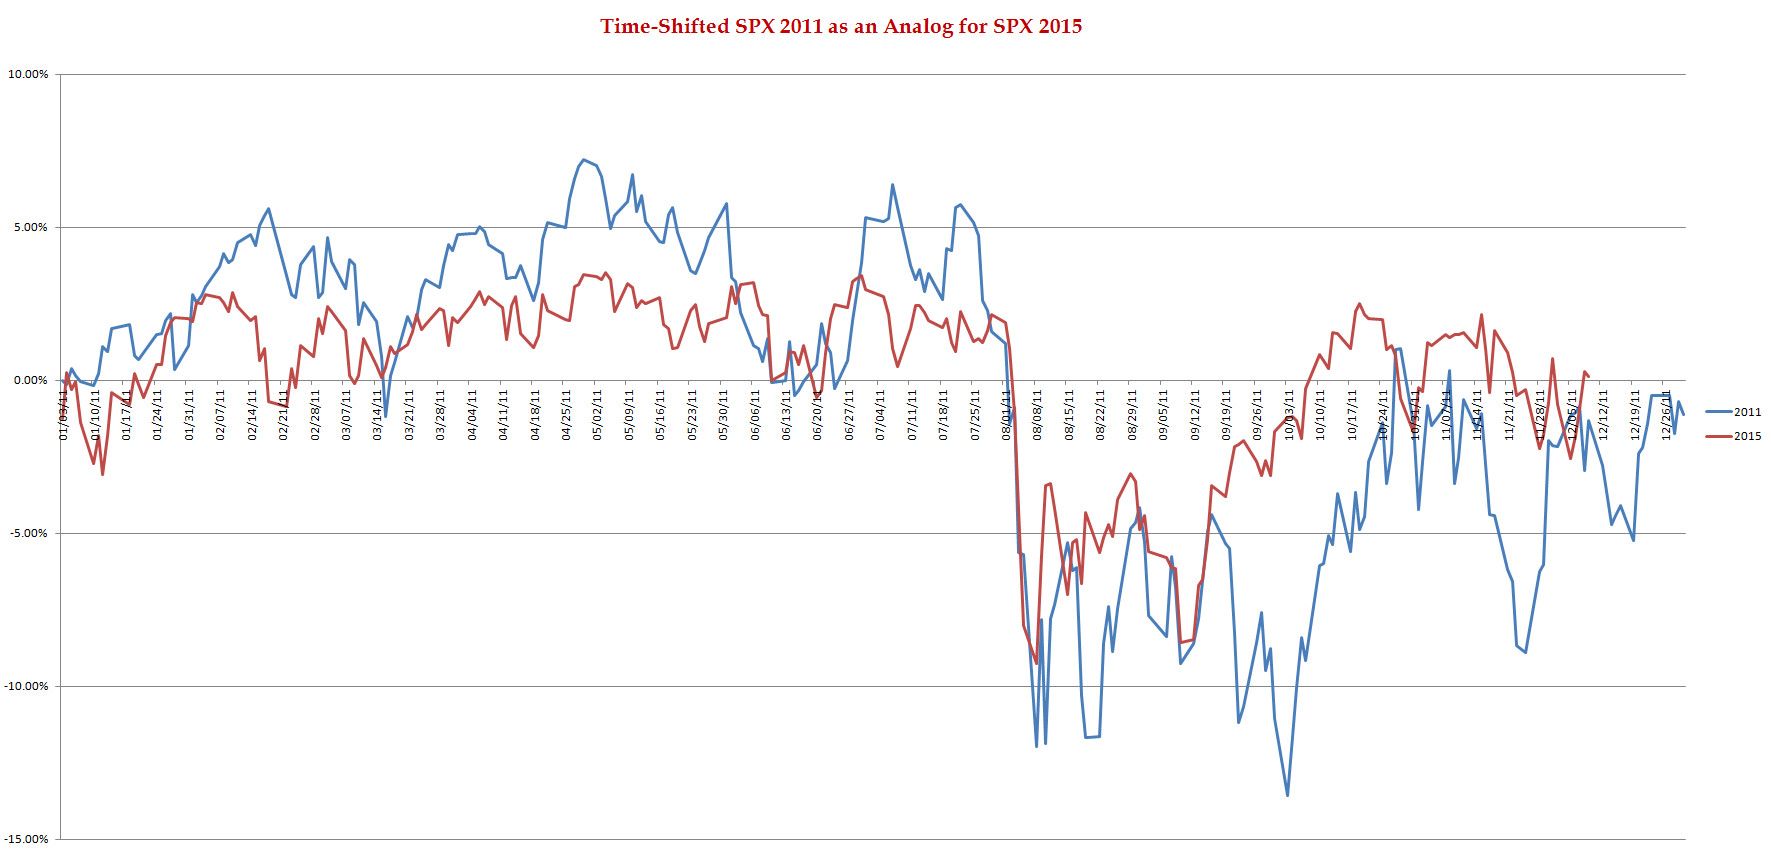
SPX 2011 Time-Shifted Analog for SPX 2015
Our coveted Time-Shifted 2011 Analog Chart, in its final week, shows that we might have another [small] leg down before the start of 2016. As we say in the NAVY, fasten your harnesses. Sailors, the ride into the New Year could get rather bumpy.
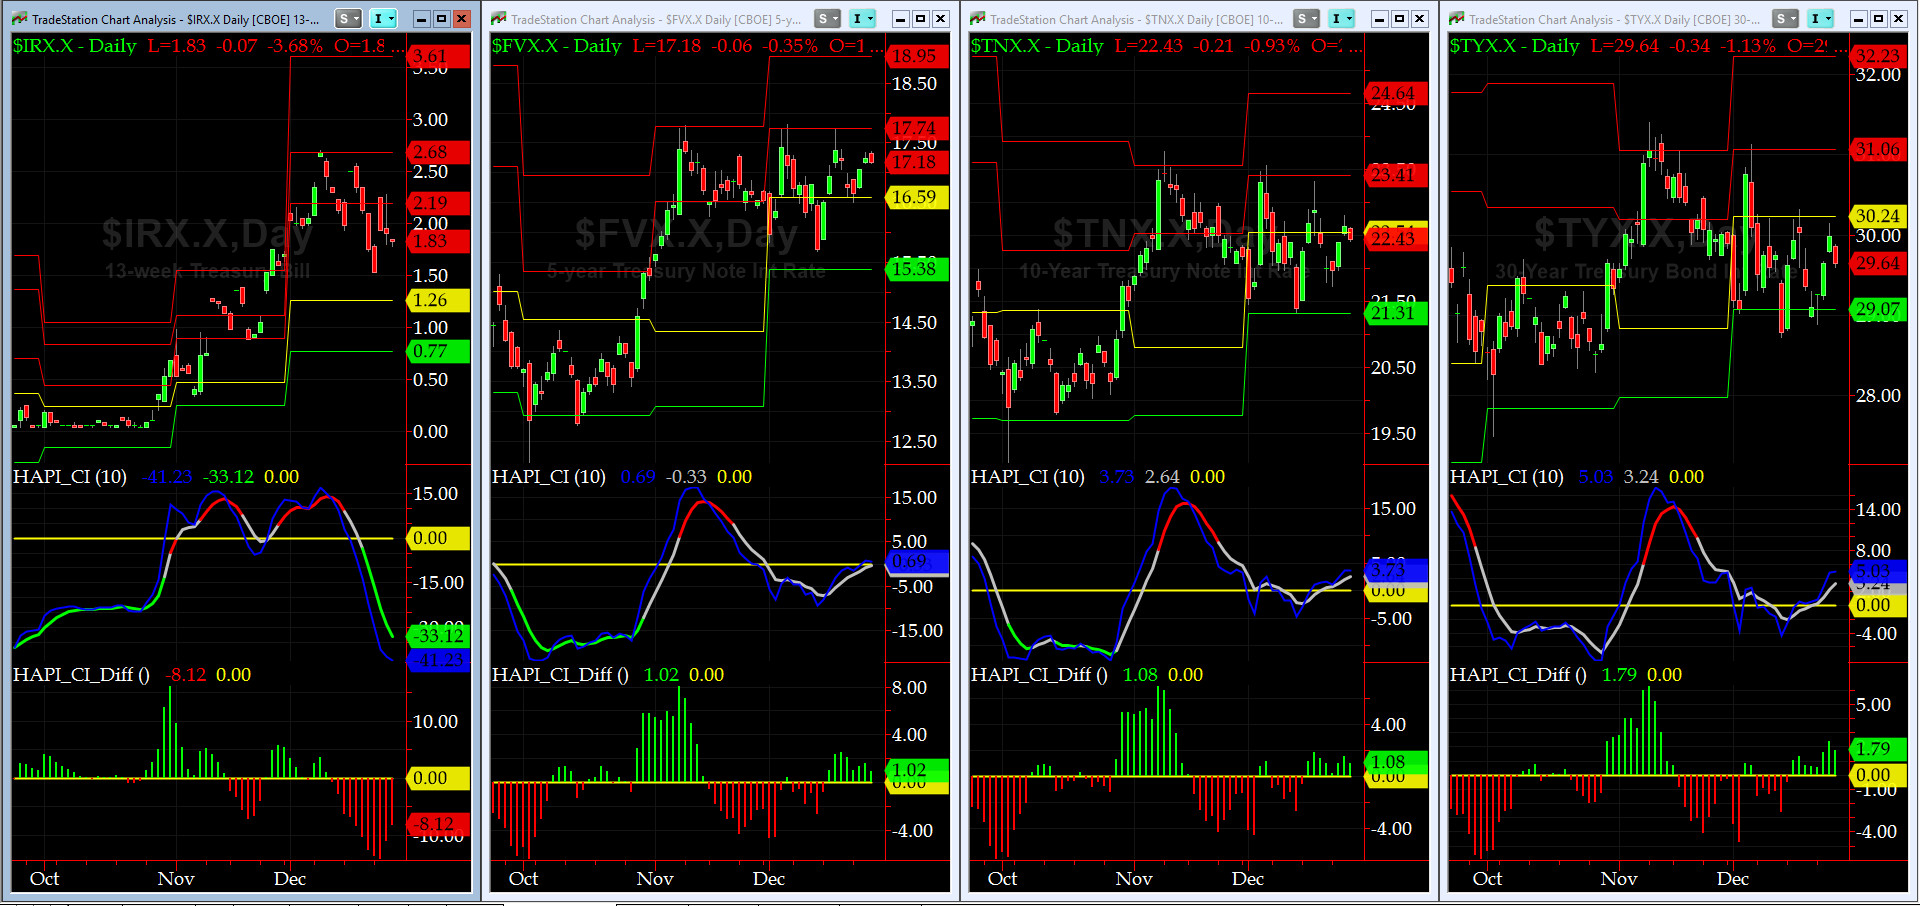
US Treasury T-Notes & T-Bonds Yields Chart
This past week, the Treasury Complex put in a bunch of dojis -- YTMs went nowhere fast. Big Boys were in the Hamptons, working on their tans. Retail was stuck in Del Boca Vista....LOL.
Good luck this week,
Fari Hamzei
|
|
|
|
|
|
Customer Care:
|
|
|
|
|
|
|
 |
 |
|
 |
|
 |
 |
 |
HA YouTube Channel ::: HA Blog ::: Testimonials ::: Tutorials & FAQs ::: Privacy Policy
|
Trading Derivatives (Options & Futures) contains substantial risk and is not for every investor. An investor could potentially lose all or more than his/her initial investment.
Only risk capital should be used for trading and only those with sufficient risk capital should consider trading derivatives. Past performance is not
necessarily indicative of future results. Testimonials appearing on this website may not be representative of other clients or customers
and are not a guarantee of future performance or success.
|
| (c) 1998-2025, Hamzei Analytics, LLC.® All Rights Reserved. |
|
|