
|
 |
 |
 |
 |
 |
 |
 |
 |
 Proactive Market Timing Proactive Market Timing
|
|
|
Most Recent PMT vs SPX Performance Chart

|
|
|
|
Thursday, January 7, 2016, 2300ET
Notice of Change of Market Bias with Timer Digest
Dear Jim,
We are going LONG SPX from tonight�s close at 1943.09 and thus locking in almost 118 S&P handles from December 24th close at 2060.99.
Cheers��� ONLY IN AMERICA!!
Fari Hamzei
|
|
|
|
|
|
Wednesday, January 6, 2016 1030ET
Updated Market Timing Select Charts & Comments

Timer Chart of S&P-500 Cash Index (SPX)
NYSE McClellan Osc is about -90 and Breadth Thrust is at 50.
HA_SP1_momo Chart
Just noticed our DAILY Timing Model went to a SELL after Monday night close.
HA_SP1 is now around its -2 sigma while HA_momo is now at -7.4 (-10 is the threshold of reversal). The new 52wk low for SPX rose to 27 (40 is generally accepted as the threshold for reversal).
Vol of the Vols Chart
Vols are still too tame sigma wise. We want to see +4 sigmas. Still seeing no babies with bath water thrown out of torpedo tubes.
Updated Bias for balance of this week = staying SHORT SPX or SPY via Put Spreads for one more day
Profit Target = 1950
Money Management Stop = 2015
BOTTOM LINE: As @Capt_Tiko reminds us, better watch the crude oil and exogenous news closely this week before 2015 Q4 EPS rolls in next week.
Fari Hamzei
|
|
|
|
|
|
Tuesday, January 5, 2016, 0920ET
Updated Targets for Market Bias Review, Issue #125
New Bias for today [and may be tomorrow] = staying SHORT SPX or SPY via Put Spreads
Profit Target = 1975
Money Management Stop = 2015
BOTTOM LINE: As my co-pilot @Capt_Tiko reminds us, crude oil and exogenous news are key here.
Fari Hamzei
|
|
|
|
|
|
Monday, January 4, 2016, 1111ET
Companion Chart for Market Bias Review, Issue #125
|
|
|
|
|
|
Sunday, January 3, 2016, 2030ET
Market Bias Review, Issue #125
Most recent S&P-500 Cash Index (SPX): 2043.94 down -17.05 (up -0.83%) for the week ending on Thursday, December 31st, 2015, which closed just below zero sigma.
SPX ALL TIME INTRADAY HIGH = 2134.72 (reached on Wednesday, May 20th, 2015)
SPX ALL TIME CLOSING HIGH = 2130.82 (reached on Thursday, May 21st, 2015)
Current DAILY +2 Sigma SPX = 2095 with WEEKLY +2 Sigma = 2133
Current DAILY 0 Sigma (20 day MA) SPX = 2050 with WEEKLY 0 Sigma = 2020
Current DAILY -2 Sigma SPX = 2006 with WEEKLY -2 Sigma = 1907
50-Day MA SPX =2067 or -1.1% above SPX (max observed in last 5 yrs = +8.6%, min = -9.3% )
200-Day MA SPX = 2061 or -0.8% above SPX (max observed in last 5 yrs = 15.2%, min = -14%)
VIX = 18.2 which is just above its zero sigma (remember it�s the VIX�s vol pattern (its sigma channels) that matters, and not the level of VIX itself (this is per Dr. Robert Whaley, a great mentor and the inventor of original VIX, now called VXO. VIX usually peaks around a test of its +4 sigma))
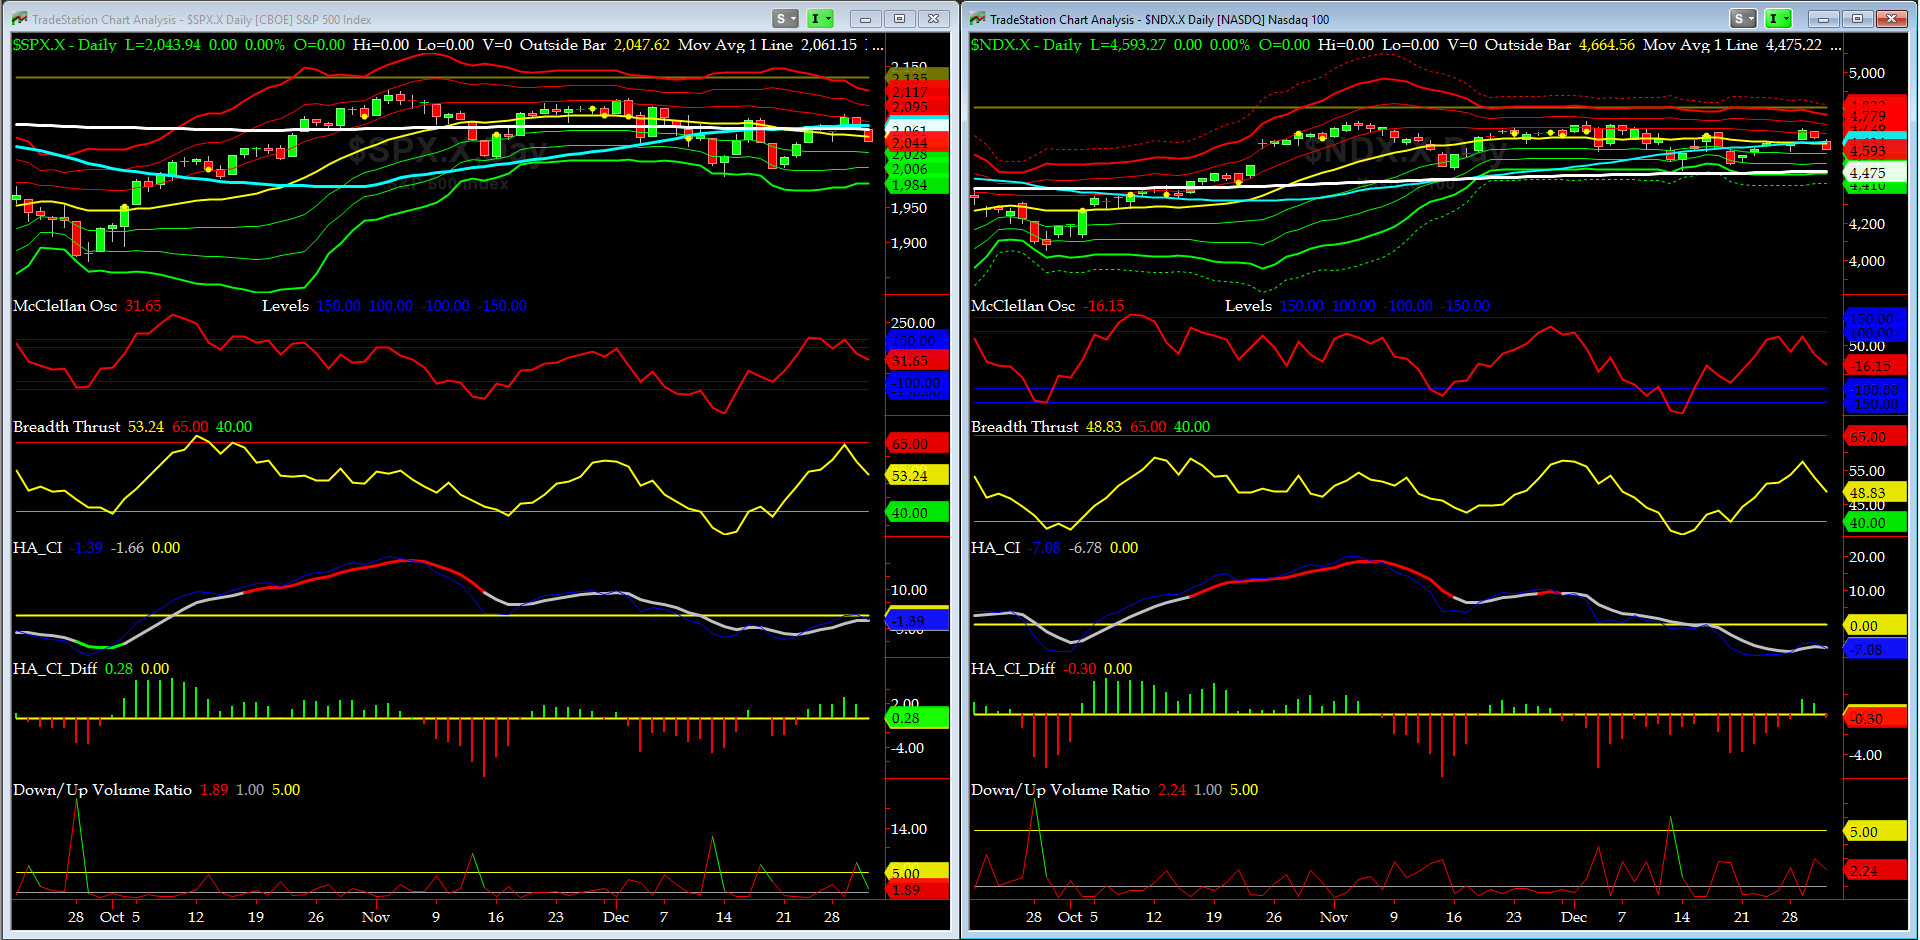
NYSE McClellan Oscillator = +31.7 (-150 is start of the O/S area; around -275 to -300 area or lower, we go into the �launch-pad� mode, over +150, we are in O/B area)
NYSE Breadth Thrust = 53.2 (40 is considered as oversold and 65 as overbought)
WEEKLY Timing Model = on a BUY Signal since Friday 11/27/15 CLOSE
DAILY Timing Model = on a BUY Signal since Thursday 12/28/15 CLOSE
Max SPX 52wk-highs reading last week = 30 (over 120-140, the local maxima is in)
Max SPX 52wk-Lows reading last week = 2 (over 40-60, the local minima is in)
HA_SP1 = just below zero Sigma
HA_Momo = -2.4 (reversals most likely occur above +10 or below -10)
HA_SP2 = 42.8 (Buy signal <= 20, Sell Signal >= 80)
3-mo. VX Futures Spread (long JAN short APR) = -0.83 (-3 to -2.5 SELL signal, 0 BUY Signal)
SPX SKEW (Tail Risk) = 124.4 which is at its -2 sigma (normal = 120-125, range 100-150)
Our current SPX Bias with Timer Digest: SHORT SPX as of Thursday, December 24th, 2015 Close at 2060.99
Our previous Bias: LONG SPX (since Tuesday, October 20th, 2015 Close at 2030.77)
This WEEK�s Bias = staying SHORT SPX or SPY via Put Spreads for 1 to 2 more days more
Profit Target = 2000
Money Management Stop = 2060
BOTTOM LINE: Better watch the crude oil and exogenous news closely this week. And early next week, 2015 Q4 EPS rolls in.
NOTE: All LEVELS mentioned here have been, are, and will be, based on the S&P-500 SPX Cash Index, and not the ES Futures. Tomorrow after the first hour is complete, we will post here a companion chart showing critical short-term WEEKLY levels to watch for possible �retest failures.�
Happy New Year to All....
Fari Hamzei
|
|
|
|
|
|
Saturday, January 2, 2016 1430ET
Market Timing Charts & Comments
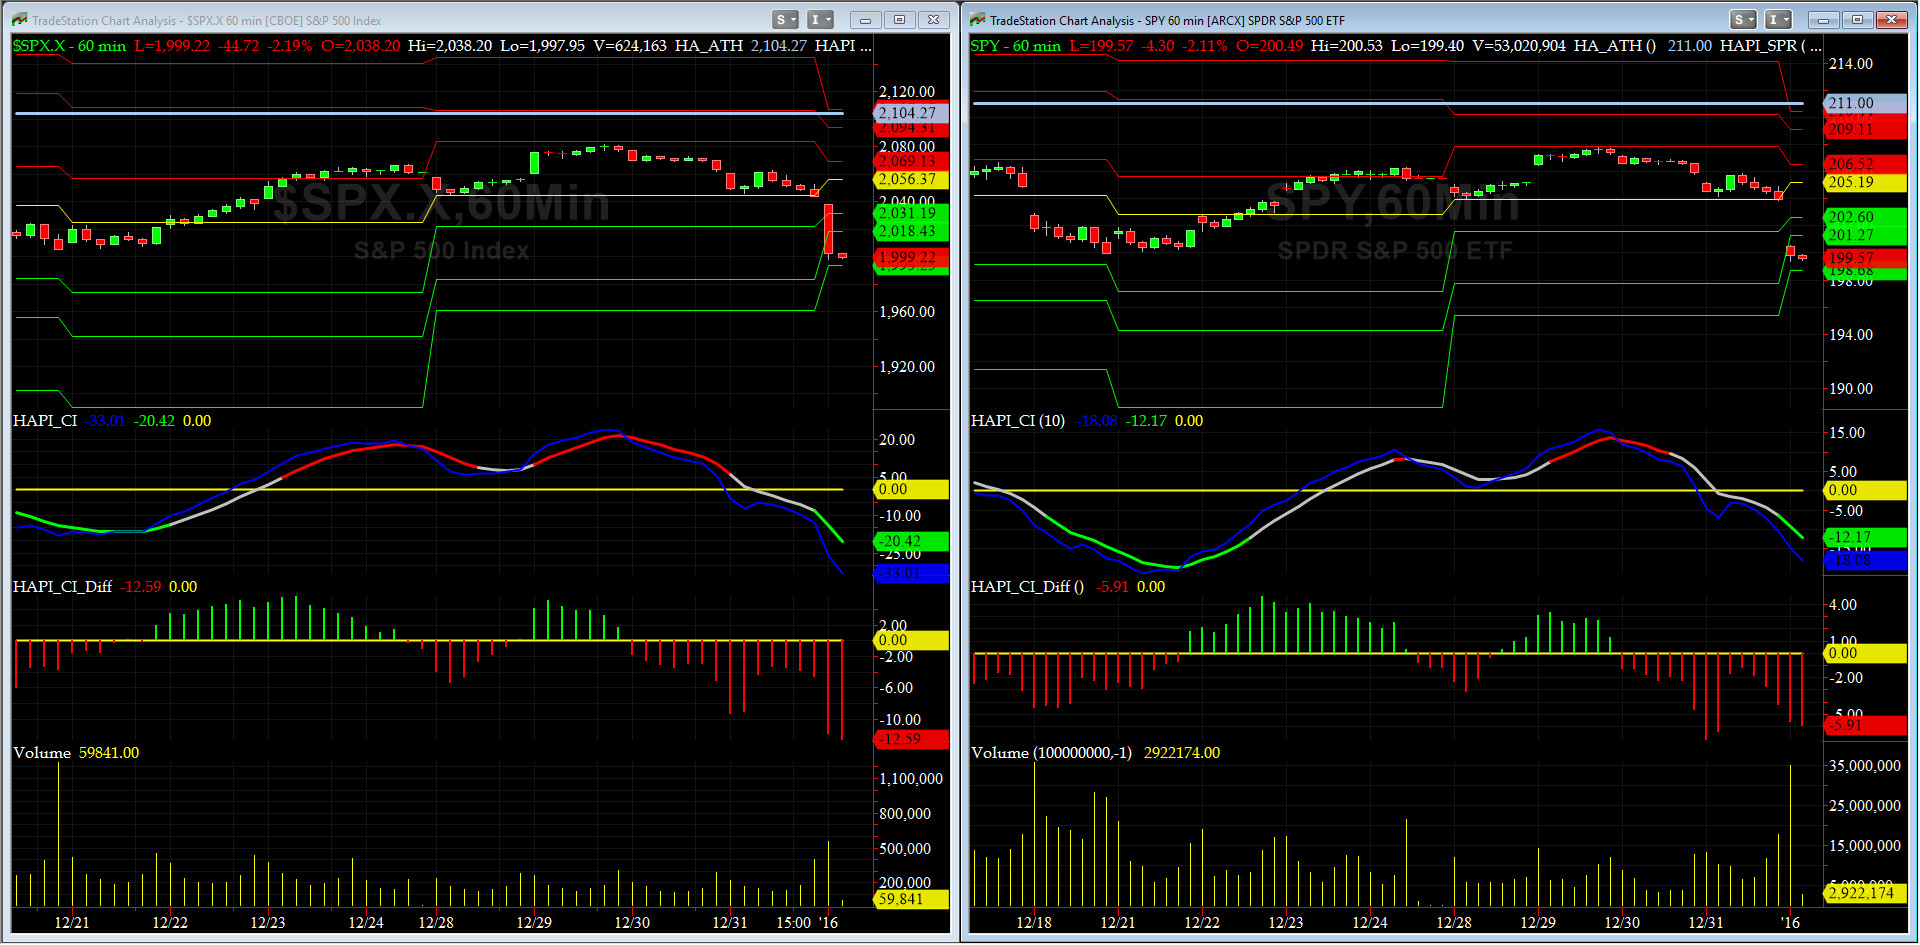
Timer Chart of S&P-500 Cash Index (SPX)
As discussed last week here, SPX was entering a mild overbought condition. SPX reversed Tuesday in after hours and sold off pretty hard, specially in the last 30 minutes of each of the last two sessions of 2015, for a total of 40 handles.
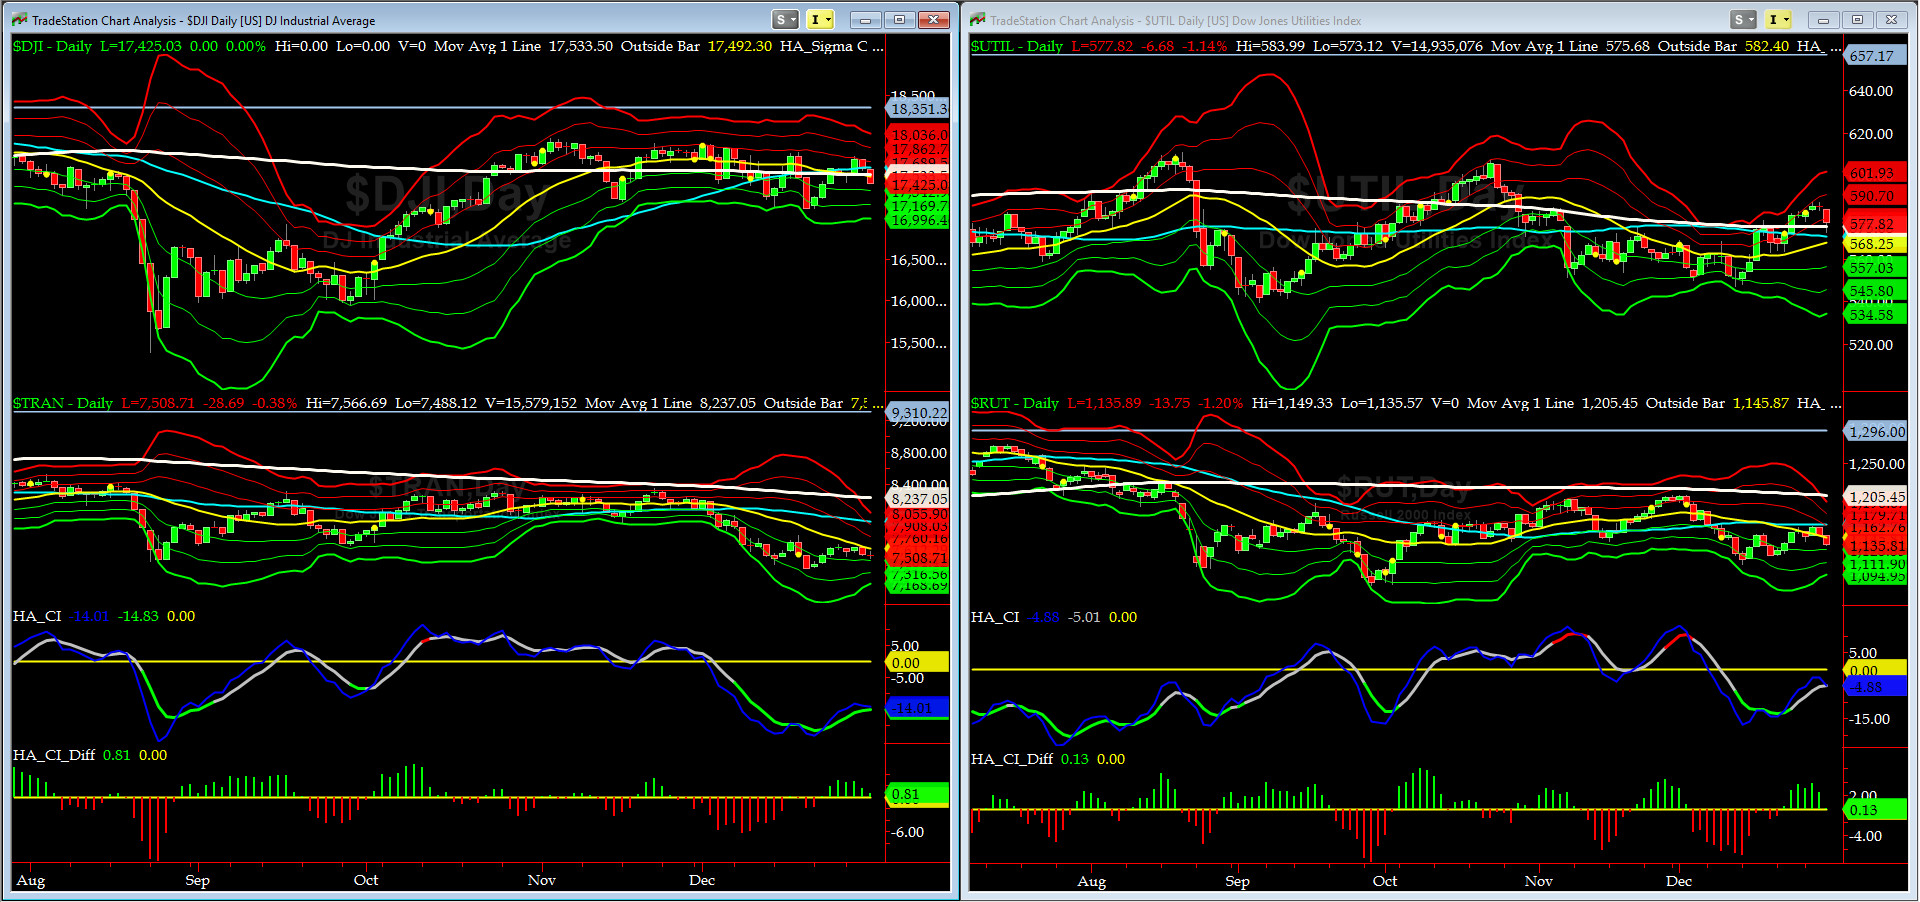
Canaries [in the Coal Mine] Chart for DJ TRAN & RUT Indices
The inability of both DJ Transports (proxy for economic conditions 6 to 9 months hence) & Russell 2000 Small Caps (proxy for RISK ON/OFF) to regain their zero sigma (and her 50bar in case of RUT) is not a good tell for the first week of trading in 2016. RISK is now clearly OFF.
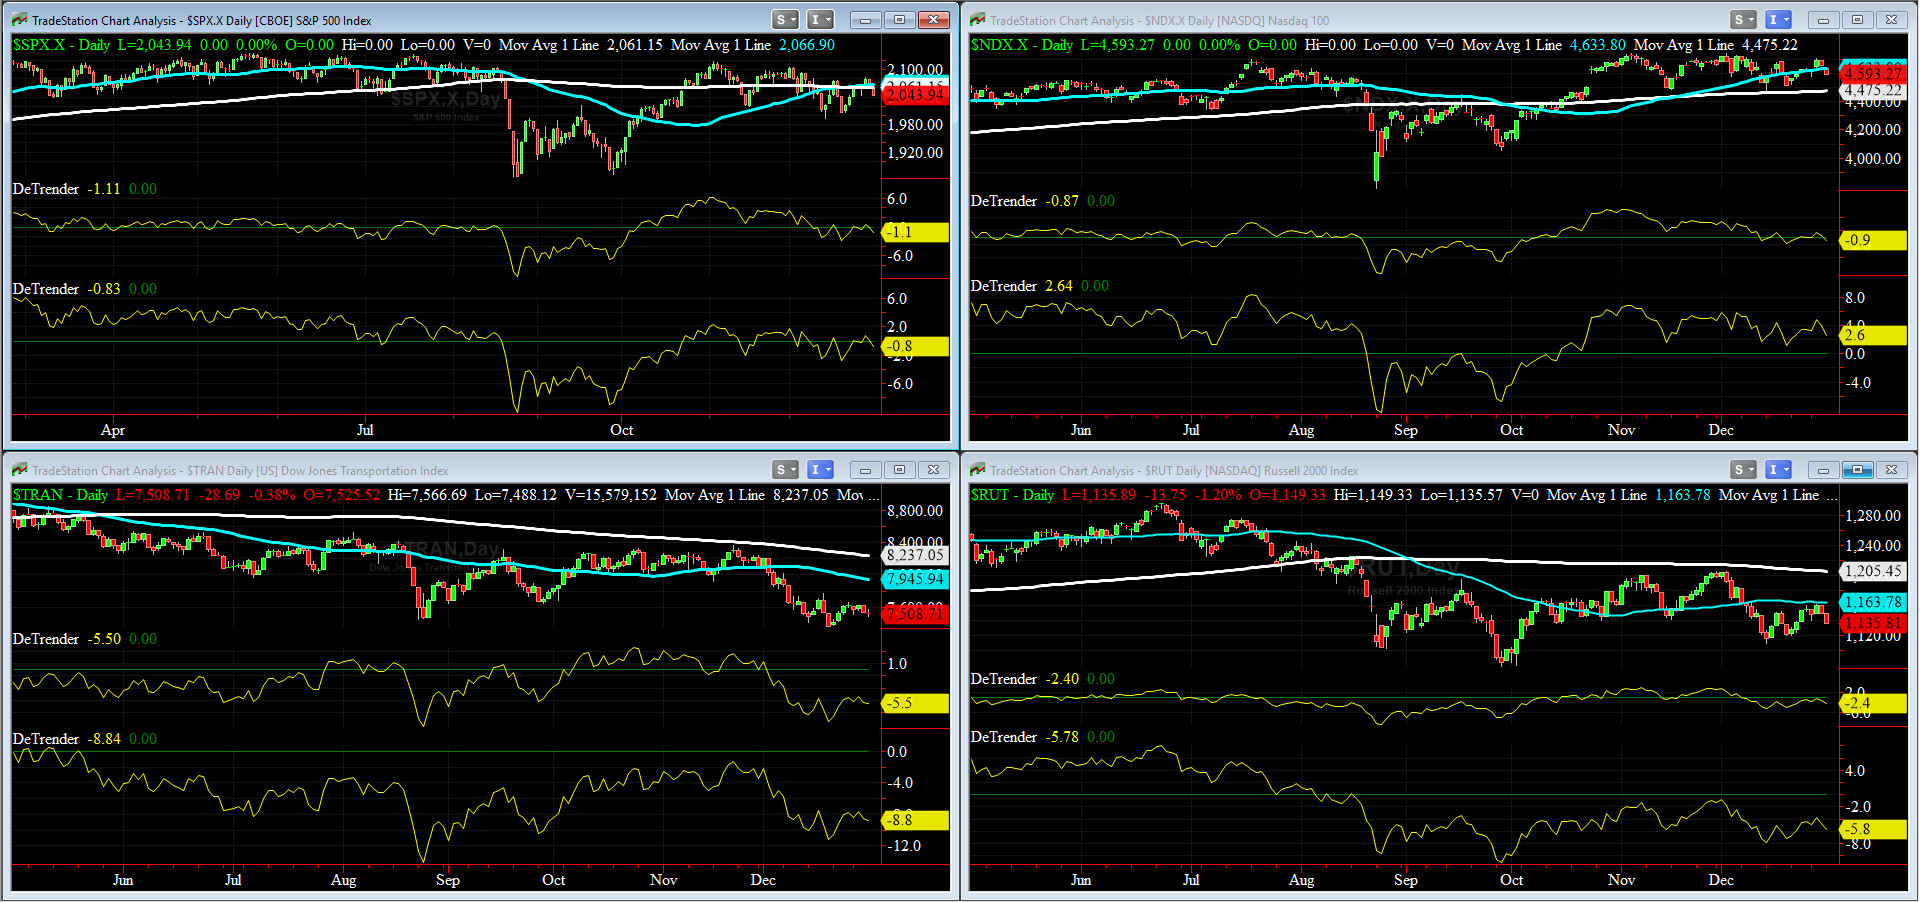
DeTrenders Charts for SPX, NDX, TRAN & RUT Indices
As of Friday Close, SEVEN out of our EIGHT 50DTs & 200DTs are negative, while only NDX 200DT is positive going to next week.
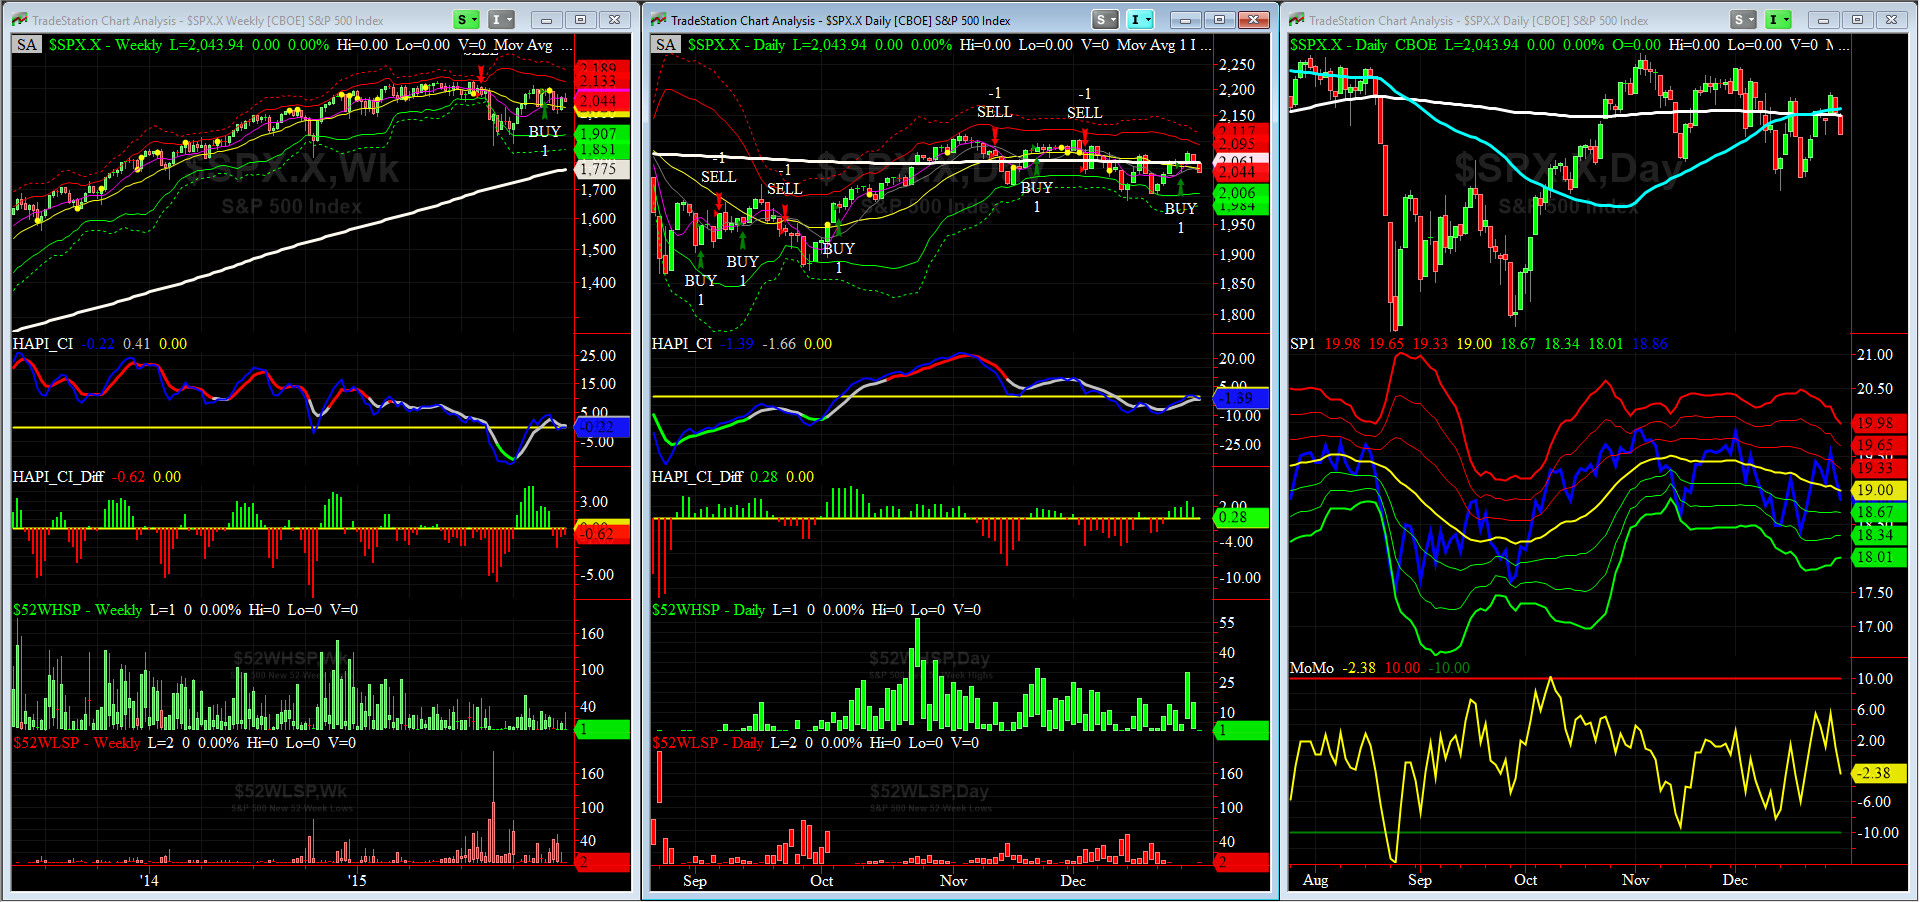
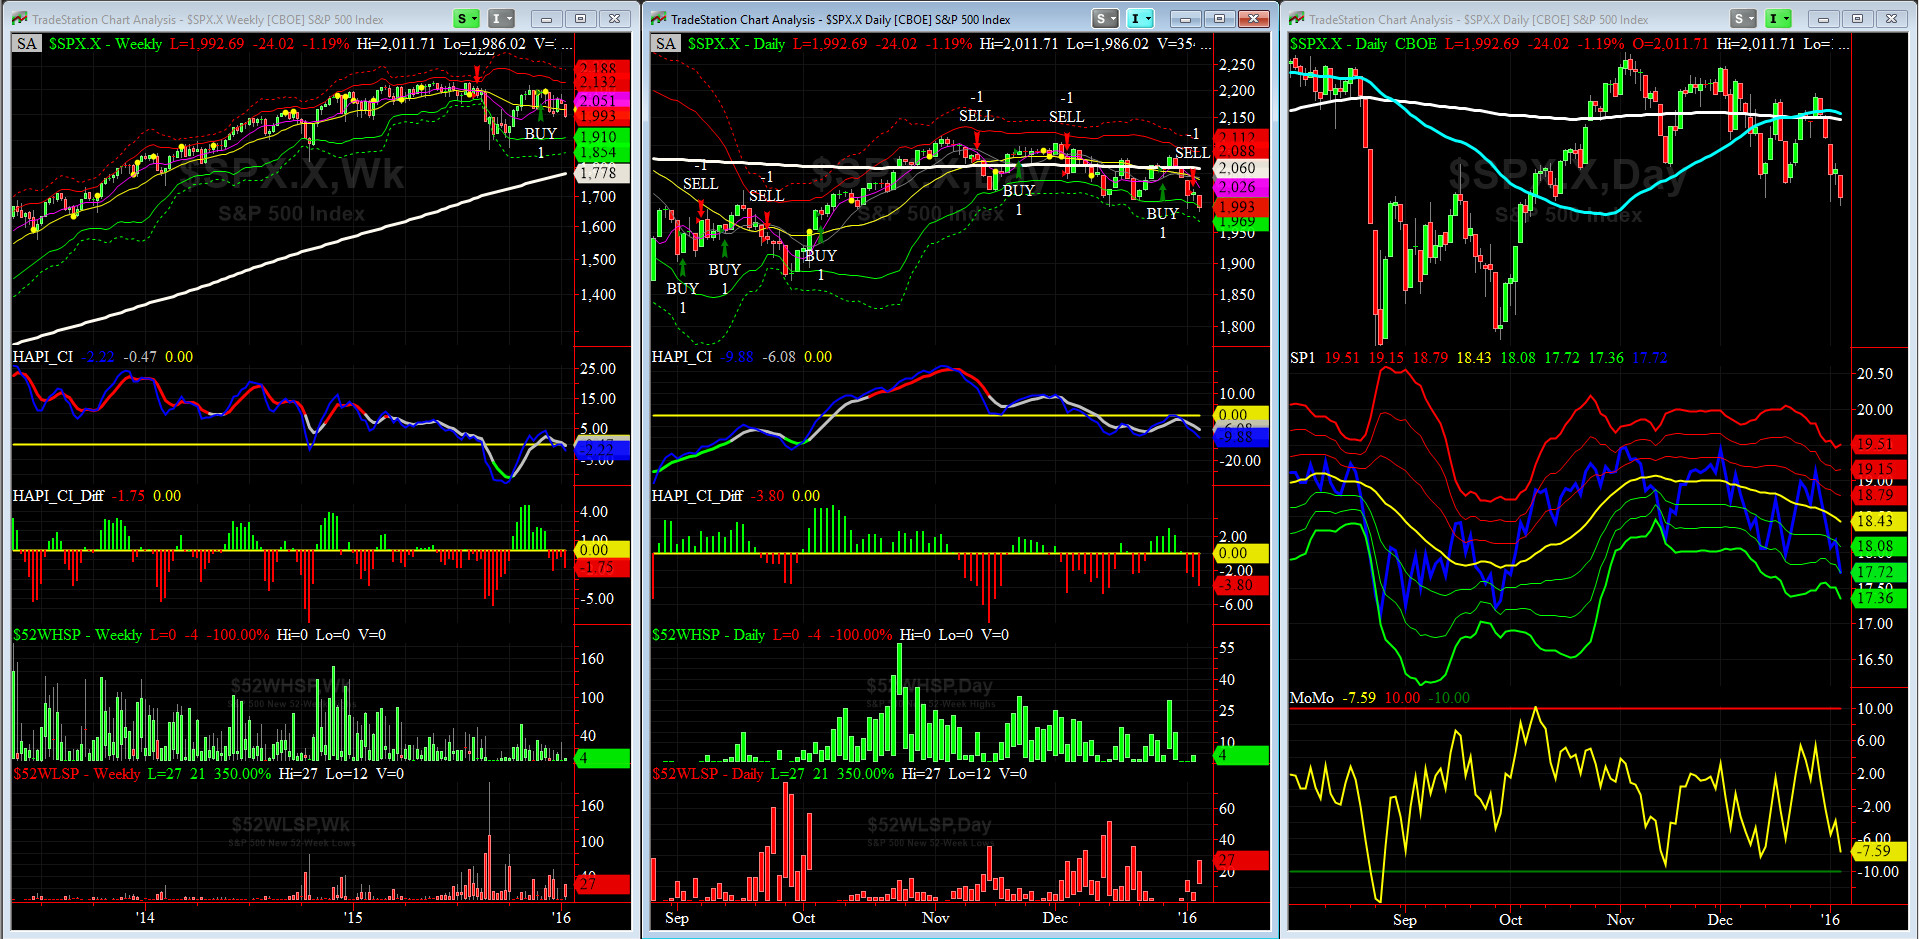
HA_SP1_momo Chart
Our WEEKLY Timing Model remains on a BUY while our DAILY Timing Model switched to BUY last Tuesday.
HA_SP1 remains around its -0.5 sigma while HA_momo is now at -2.4. The new 52wk highs for SPX rose to 30, while new 52wk lows eased off to 2 (40 is generally accepted as the threshold for reversal).
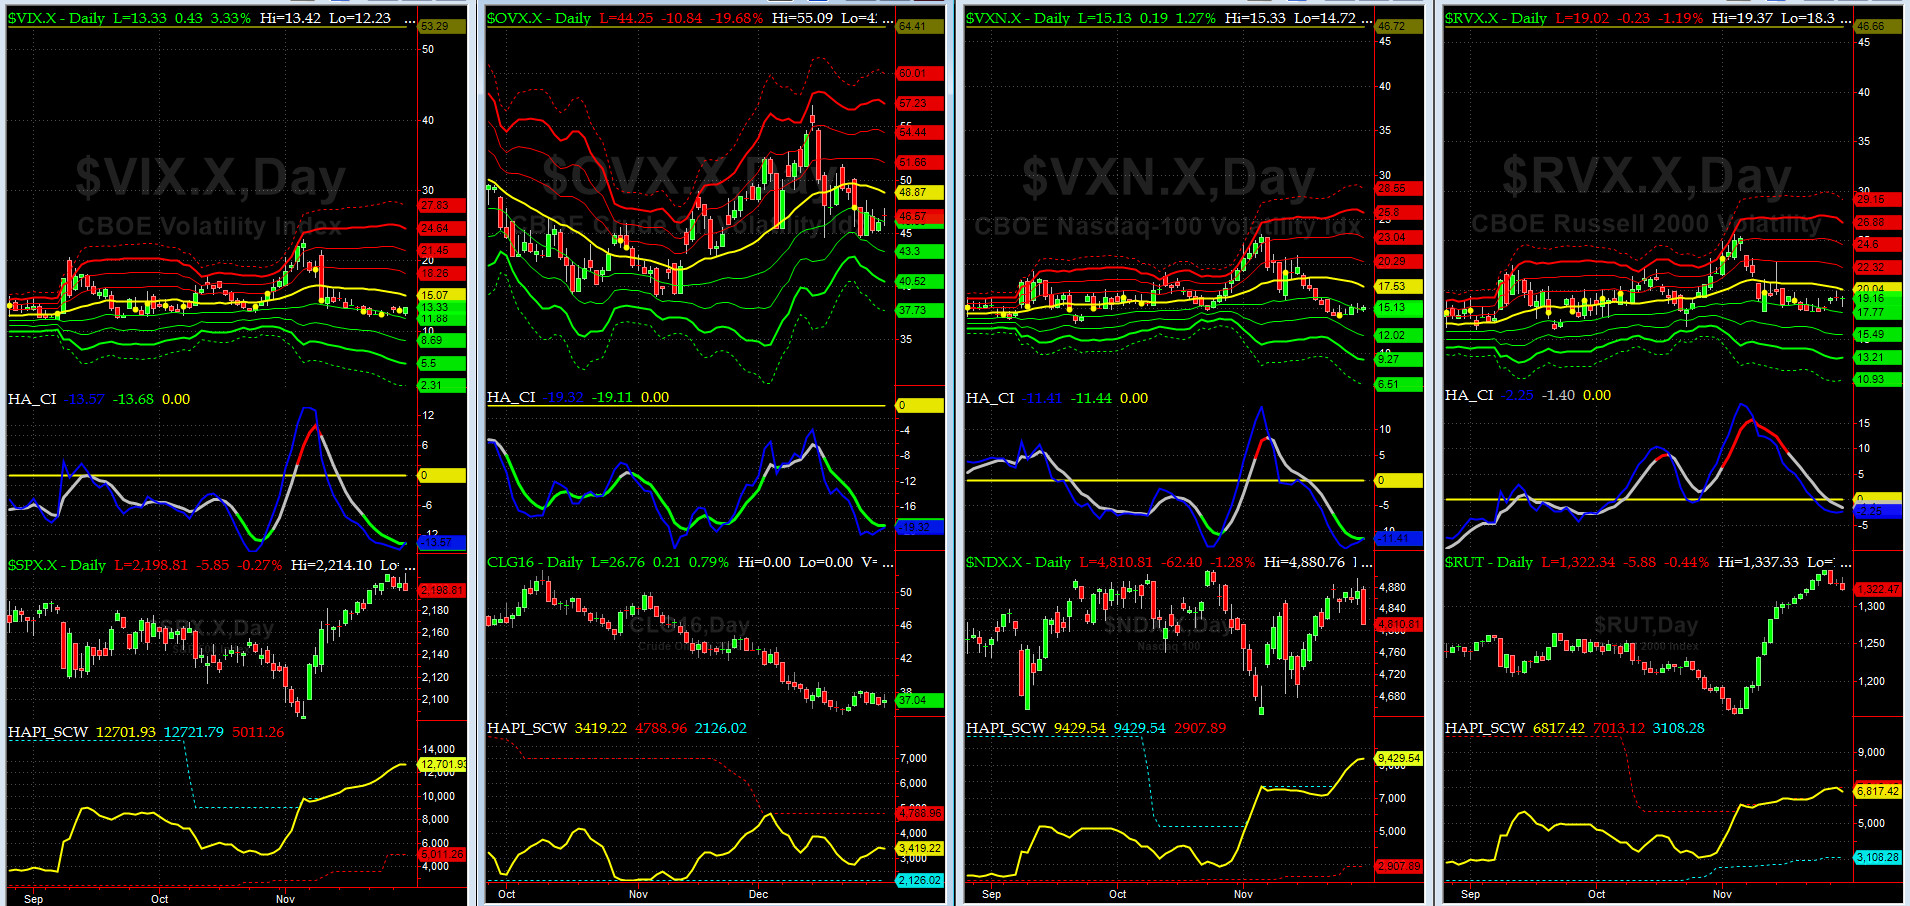
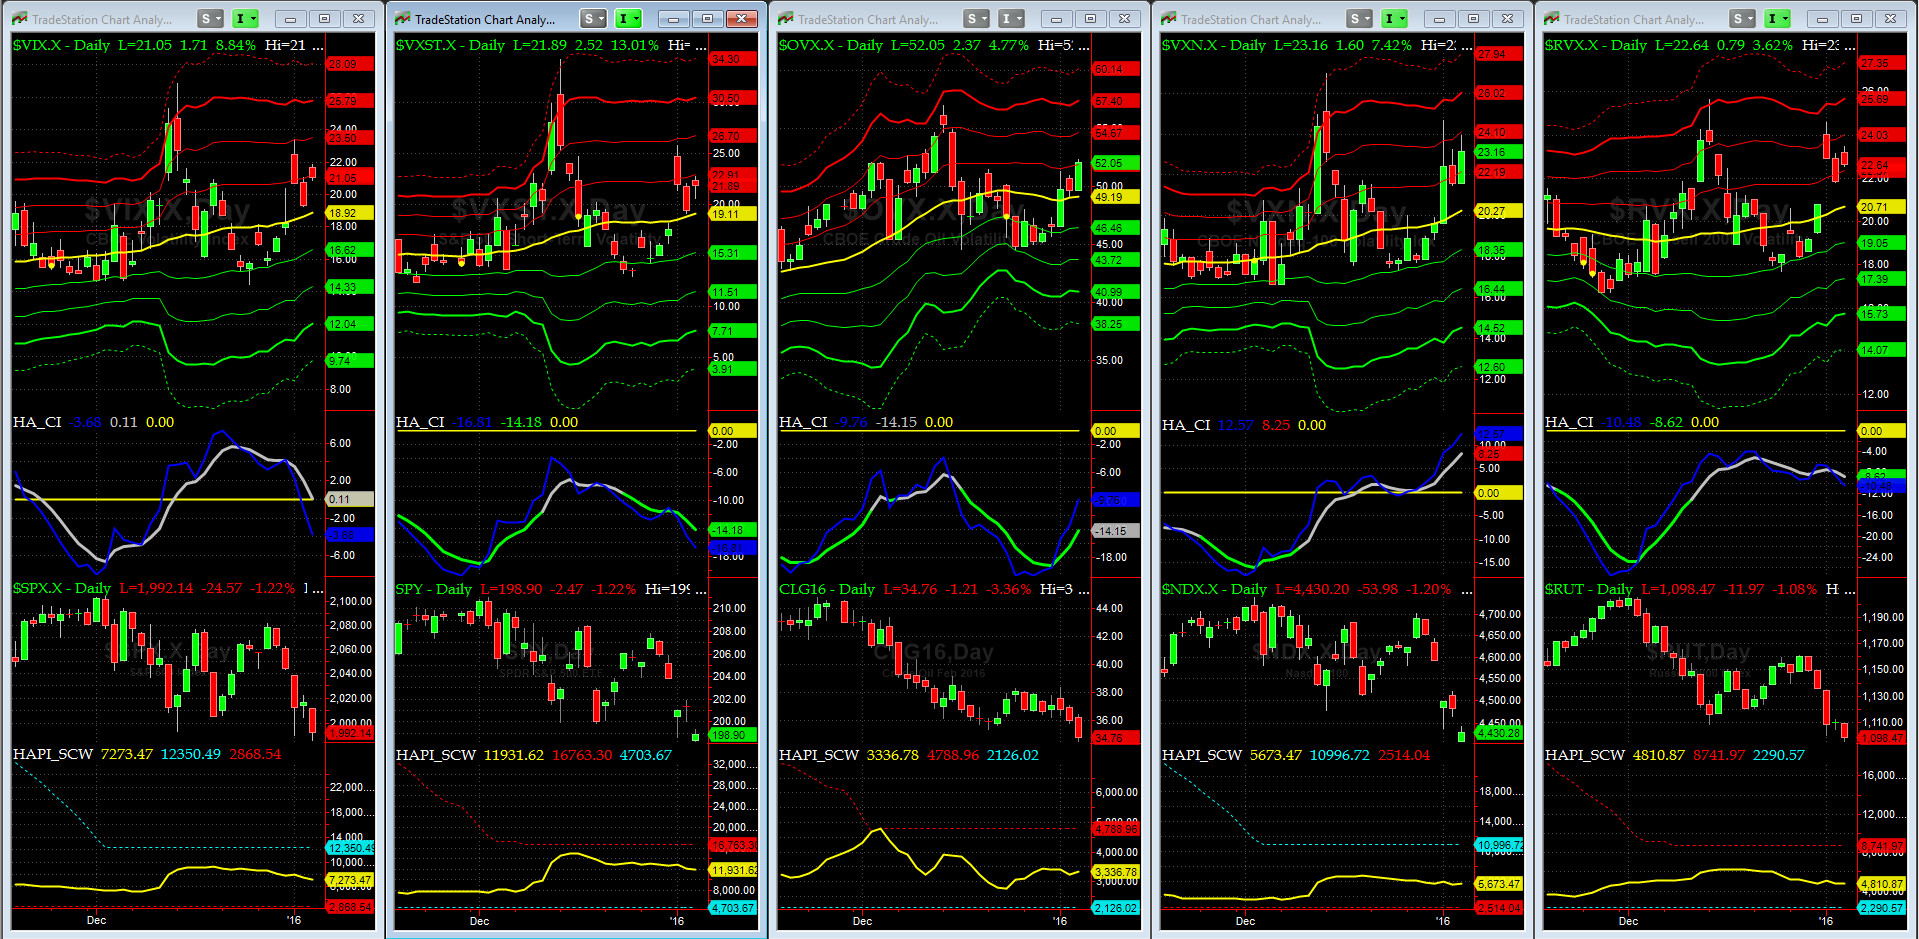
Vol of the Vols Chart
Vols came back up following the SPX reaching its overbought condition. Again, another no-brainer.
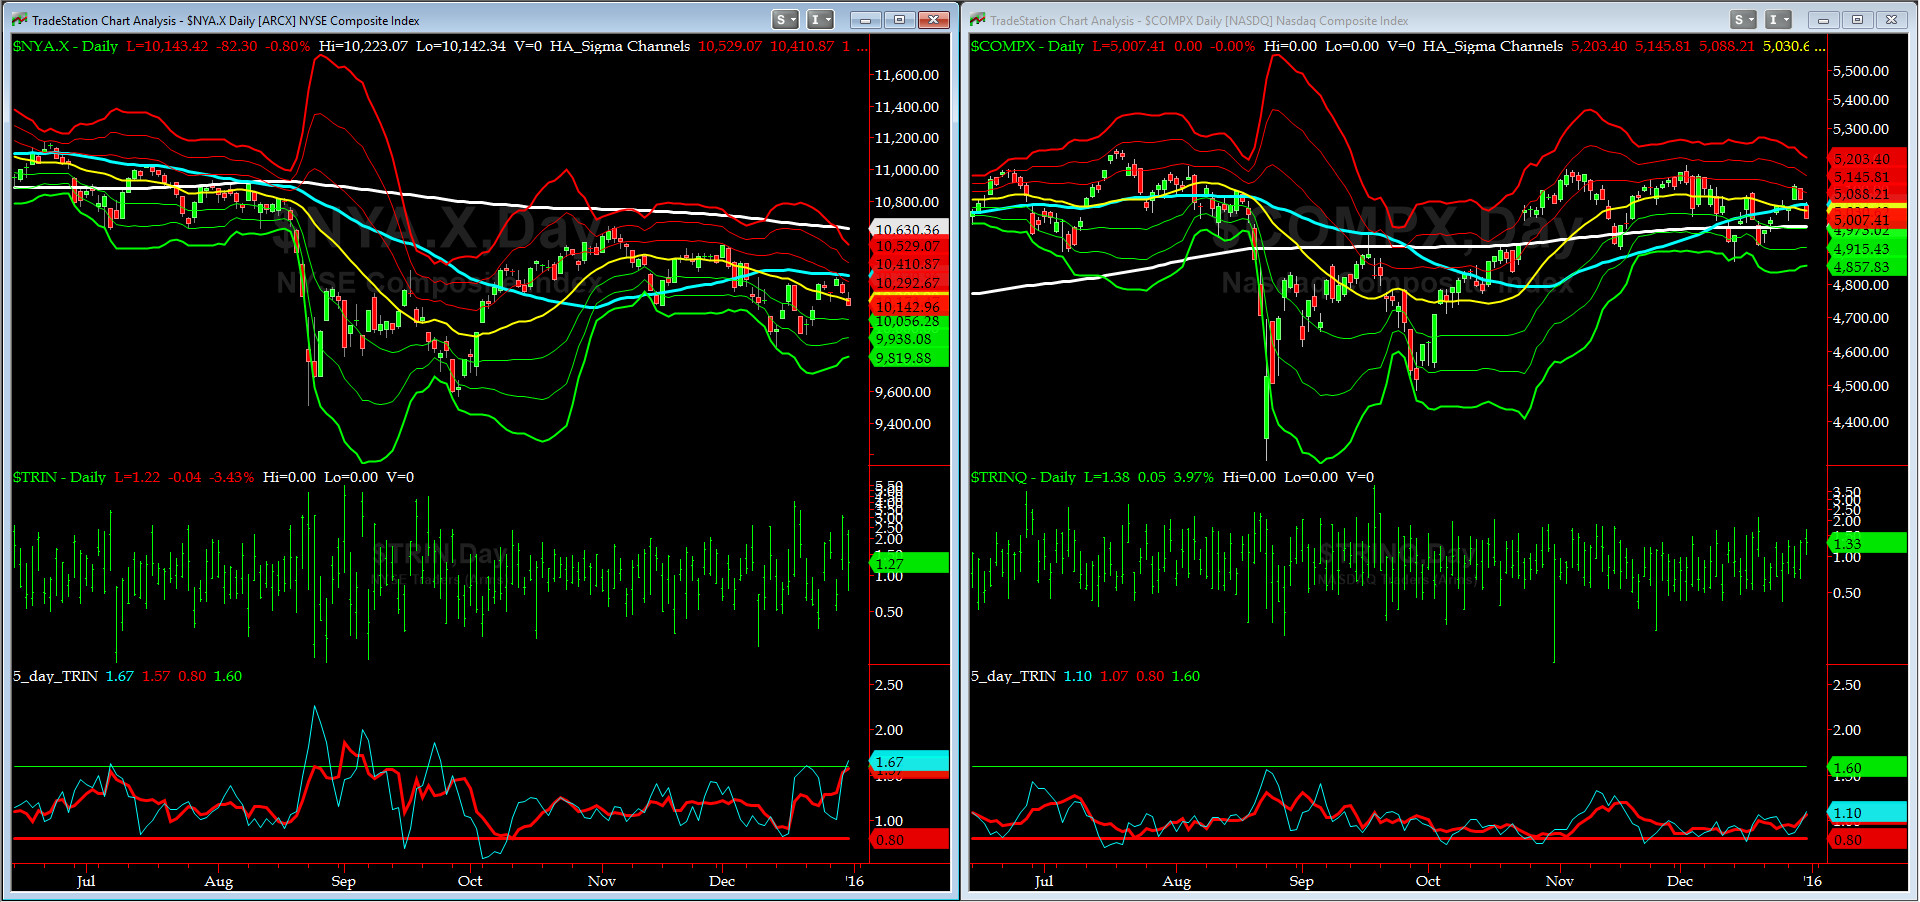
5-day TRIN & TRINQ Charts
Another BUY signal by the 5-day TRIN is in progress (for NYSE), while TRINQ (for NASDAQ) is still neutral with a 1.1 reading.
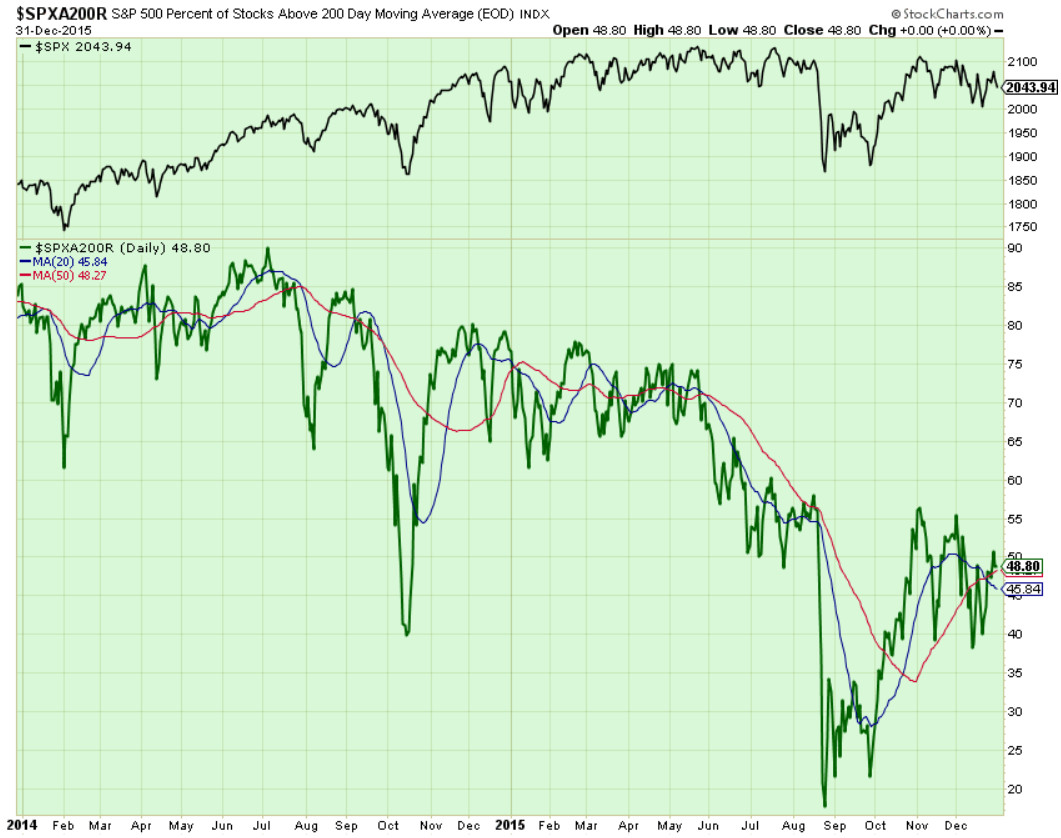
Components of SPX above their respective 200day MA Chart
Again, and as expected, this scoring indicator went nowhere fast during last week of 2015. Our co-pilot, @Capt_Tiko was right. We needed lots of Foumanat Tea.
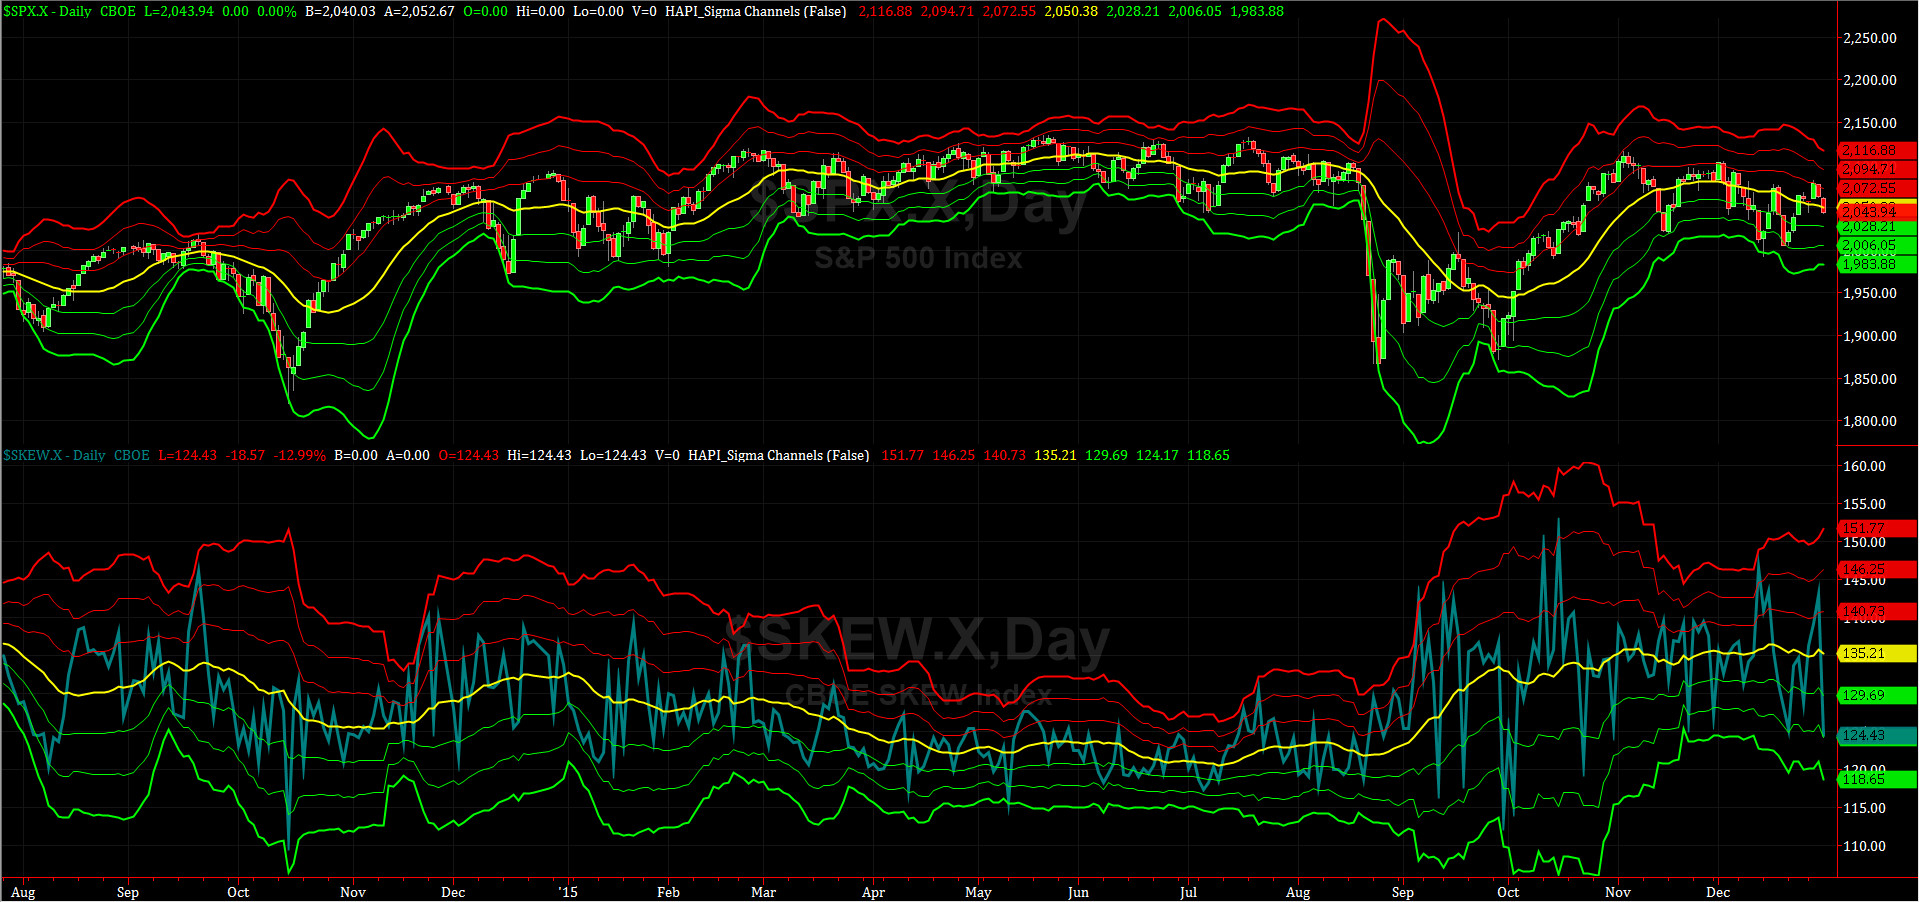
SPX SKEW (Tail Risk) Chart
On New Years Eve, SPX SKEW (Tail Risk) further plummeted to 124.4 (below its -1 sigma). Tail Risk is getting slowly sucked out of the system but ioho this should be temporary.
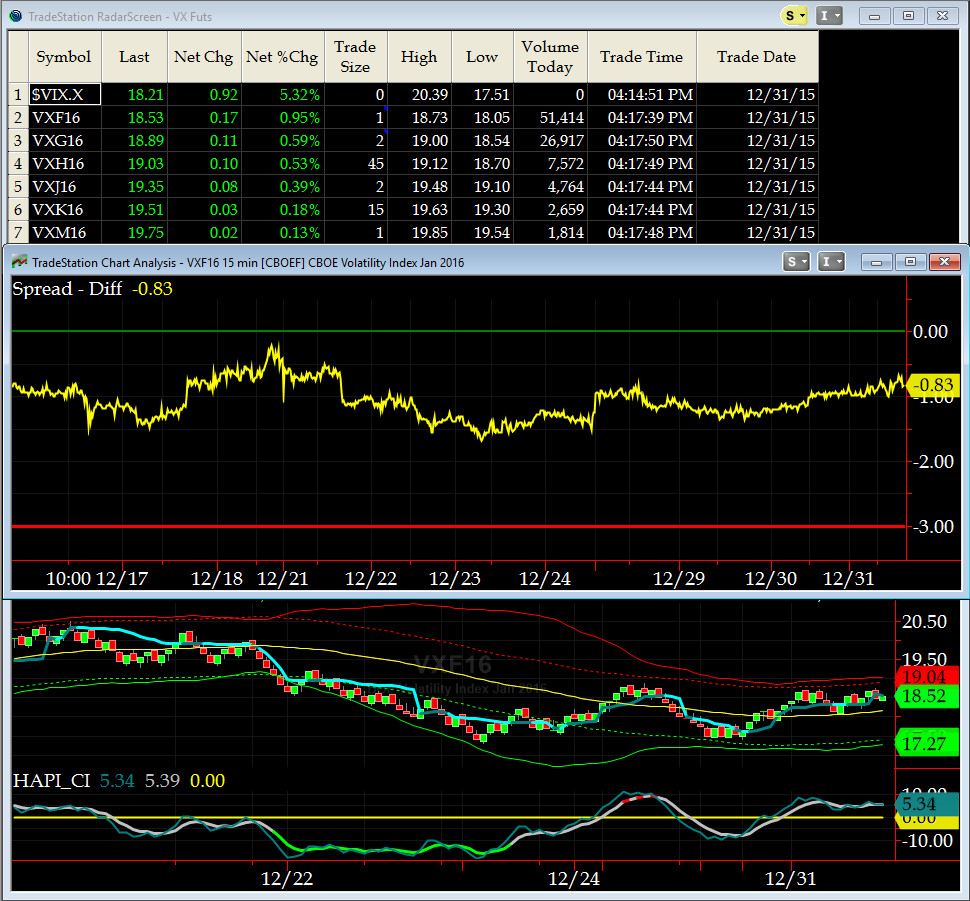
UPDATED 3-month VIX Futures Spread(VX) Chart
Our 3-month VIX Futures Spread (Long JAN16 Short APR16), closed at -0.83 on New Year's Eve as you can see, it has a bit more to go to get its zero line which should correspond to another local minima (short-term bottom in trading geek lingo).
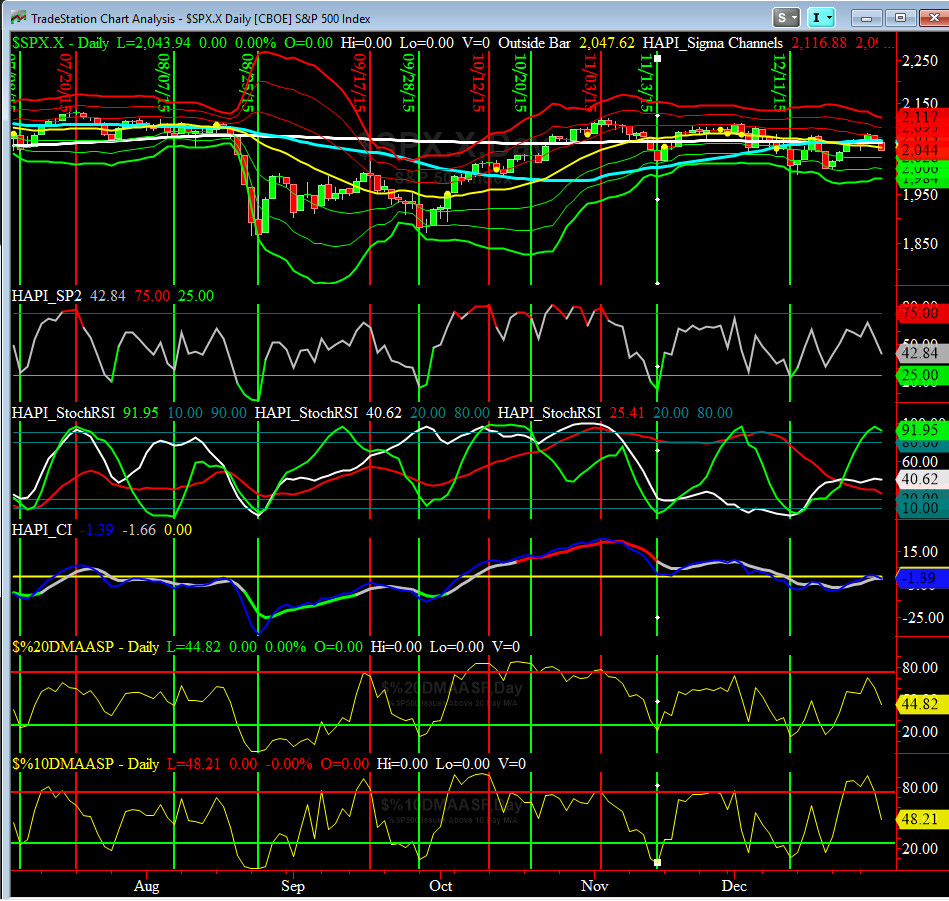
HA_SP2 Chart
At ~43, this prop indicator is still in neutral zone.
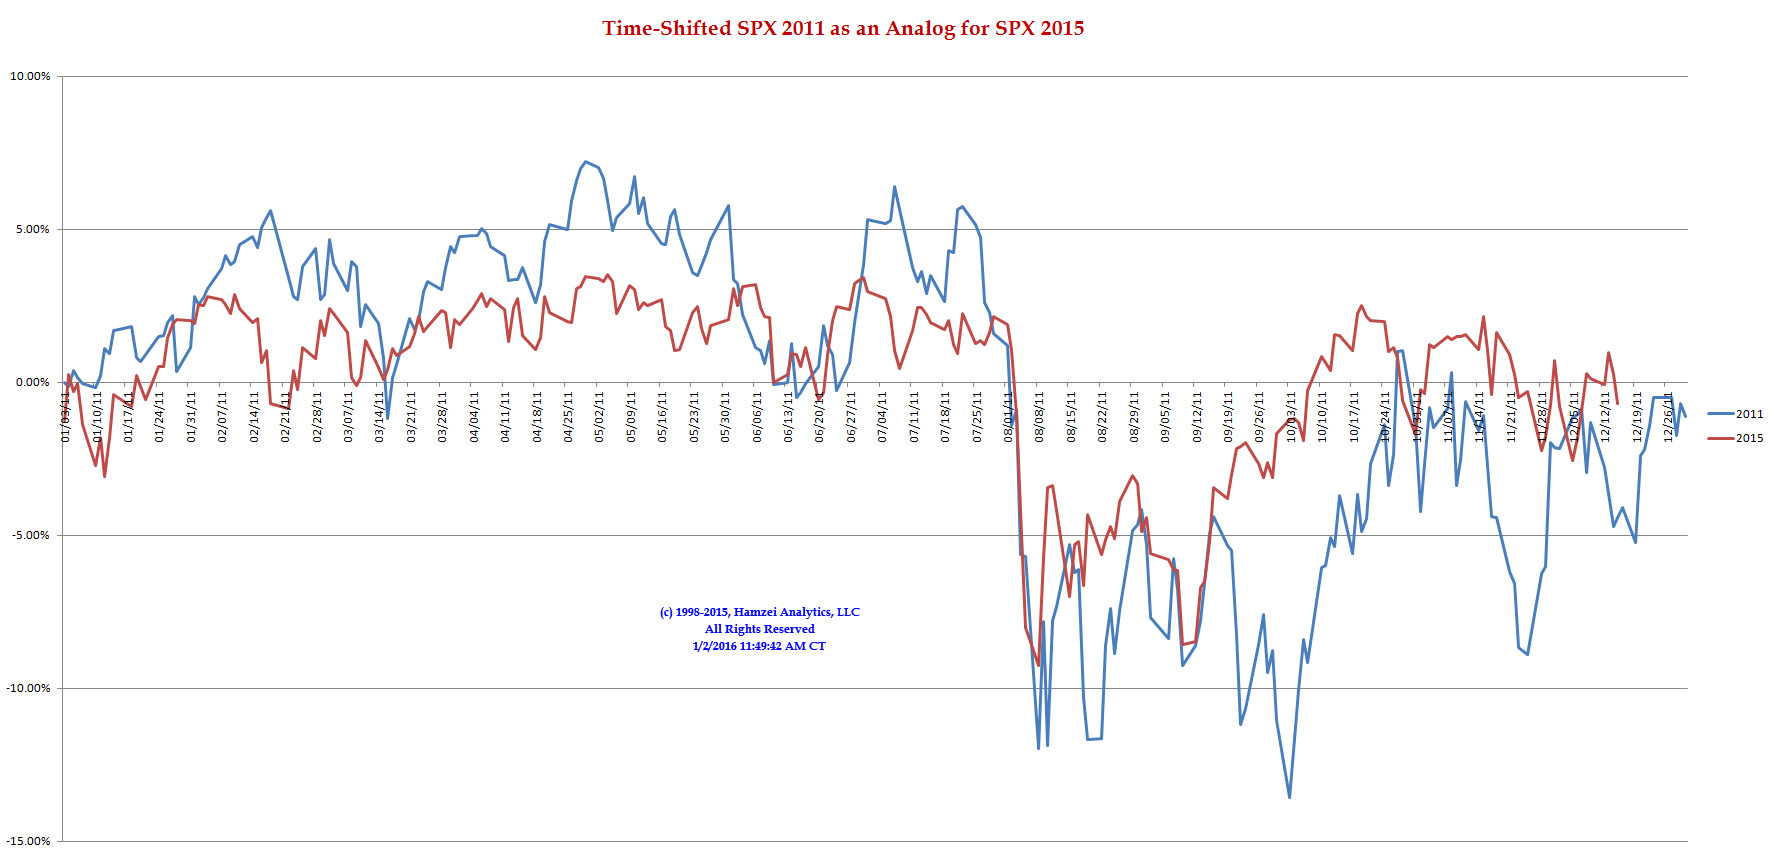
SPX 2011 Time-Shifted Analog for SPX 2015
Our coveted Time-Shifted 2011 Analog Chart served us extremely well (specially in August thru October) and we are eternally grateful. One last signal before it's archived: we should dip here first. The search for the 2016 Analog(s) begins now.
A note to all students of the markets: Having worked with Analog Charts for about 15 years now, one thing is empirically common among all analogs: They work till they stop working. Keep that in mind.
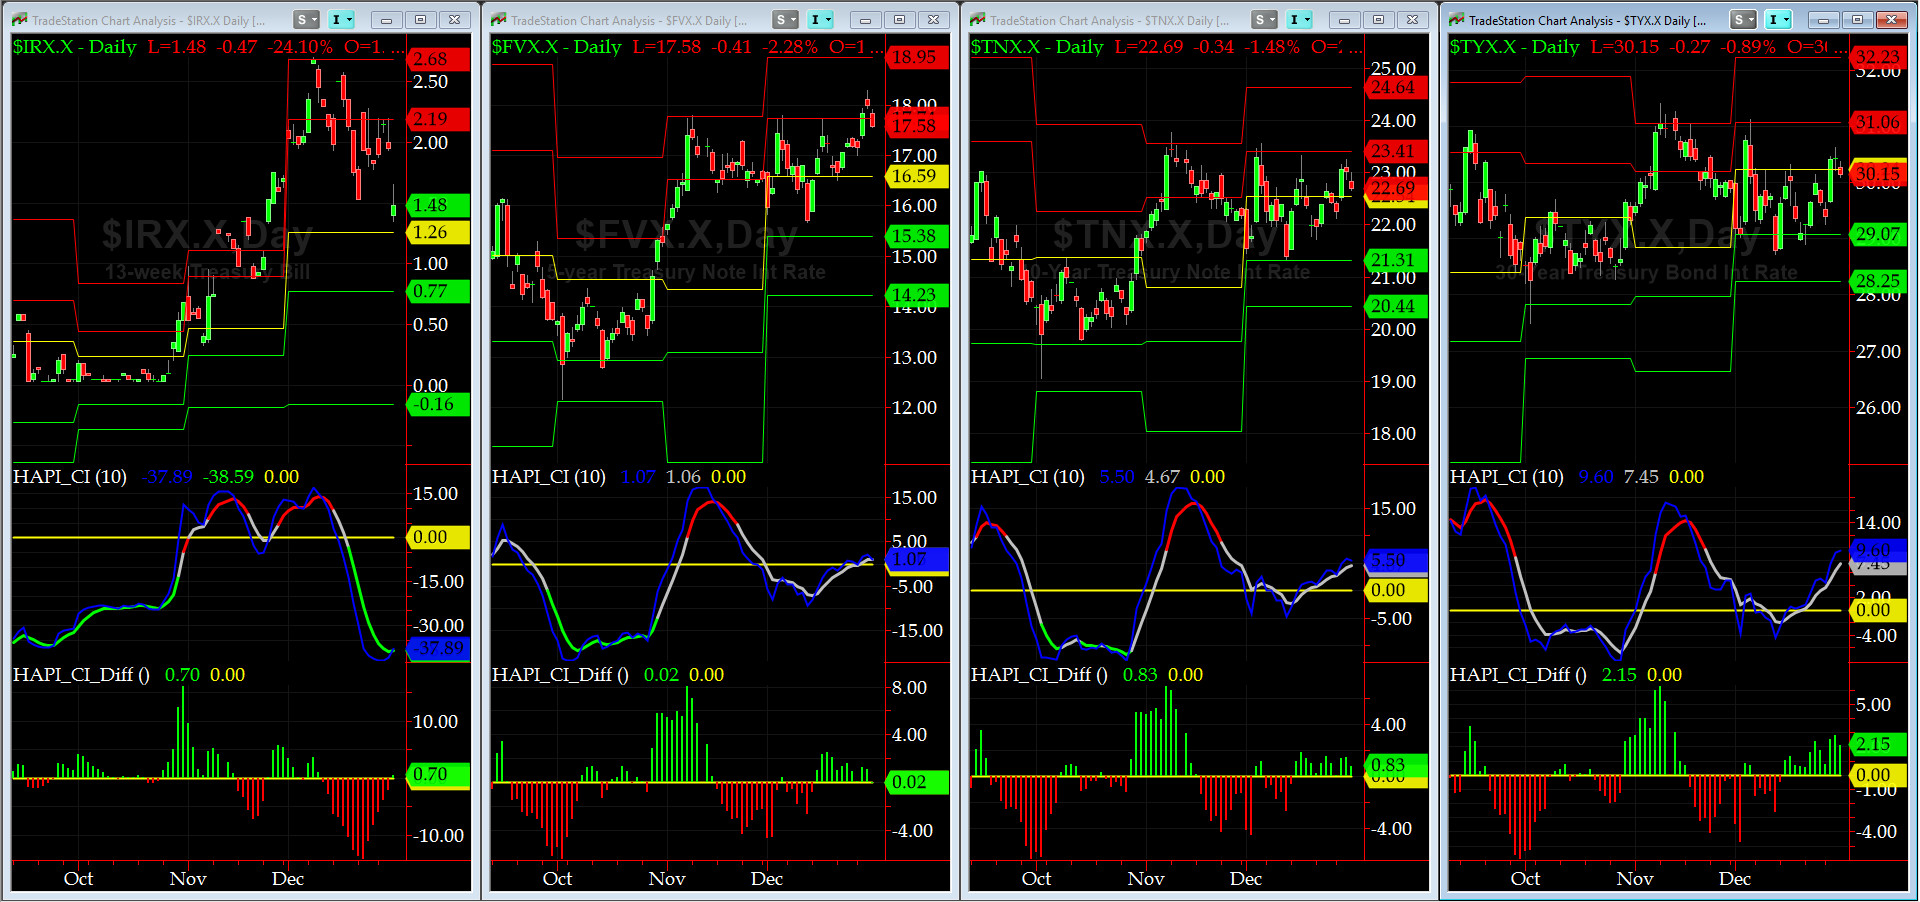
US Treasury T-Notes & T-Bonds Yields Chart
This past week, the Treasury Complex dropped in YTM across the board, specially in the front end of the Treasury Yield Curve.
Good luck this week,
Fari Hamzei
|
|
|
|
|
|
Customer Care:
|
|
|
|
|
|
|
|
|
|


