
|
 |
 |
 |
 |
 |
 |
 |
 |
 Proactive Market Timing Proactive Market Timing
|
|
|
Most Recent PMT vs SPX Performance Chart

|
|
|
|
Wednesday, January 20, 2016, 2258ET
Notice of Change of Market Bias with Timer Digest
Dear Jim,
After an intense market timing webinar tonight, followed by Episode 53 of Seinfeld (�The Bubble Boy� taped back in 1992), I went back & reviewed the 30-min chart of S&P Futures with a few select internals (volume diffs, new 52wklows, HA momo etc).
Given that we hit 1804s (11.3% down for the year) and then bounced hard to 1869s in 2.5 hrs, I am all but certain the low for this leg is in. Therefore, we are getting LONG SPX.
Fari Hamzei
|
|
|
|
|
|
Wednesday, January 20, 2016, 2030ET
Link for Tonight's Market Timing Webinar
Click here to Play
Thanks for attending,
Fari Hamzei
|
|
|
|
|
|
Tuesday, January 19, 2016, 2325ET
Notice of Change of Market Bias with Timer Digest
Dear Jim,
As Brad Sullivan, our HFT Premium Strategist, stated early this afternoon: For the 4th time this year? We have failed to hold a gap and retraced the entire move lower.
Something is wrong, big time, with this market.
We are going SHORT SPX after taking a 3% move against our position.
Fari Hamzei
Additional Market Commentary sent ten minutes later to TimerDigest for their Wednesday Hotline:
For days I have said on Twitter and in our four Chatrooms that lack of normal recovery after a massive sell-off is very unnerving to us. And yet, we have not seen any real capitulation (volume & volatility measures are fairly tamed, unlike late August & early Sept). The black hand is selling the crude oil futures 24/6 hand over fist and the oil patch is having a tsunami as more high earners are laid off. AND IRANIAN CRUDE IS NOT ONLINE YET....
And we are still looking for a big name (in distressed energy debt) to be taken to the woodshed.
As we say in the Navy, put on your harnesses and strap in. The ride will be getting wilder before getting calmer.....
-Patton
|
|
|
|
|
|
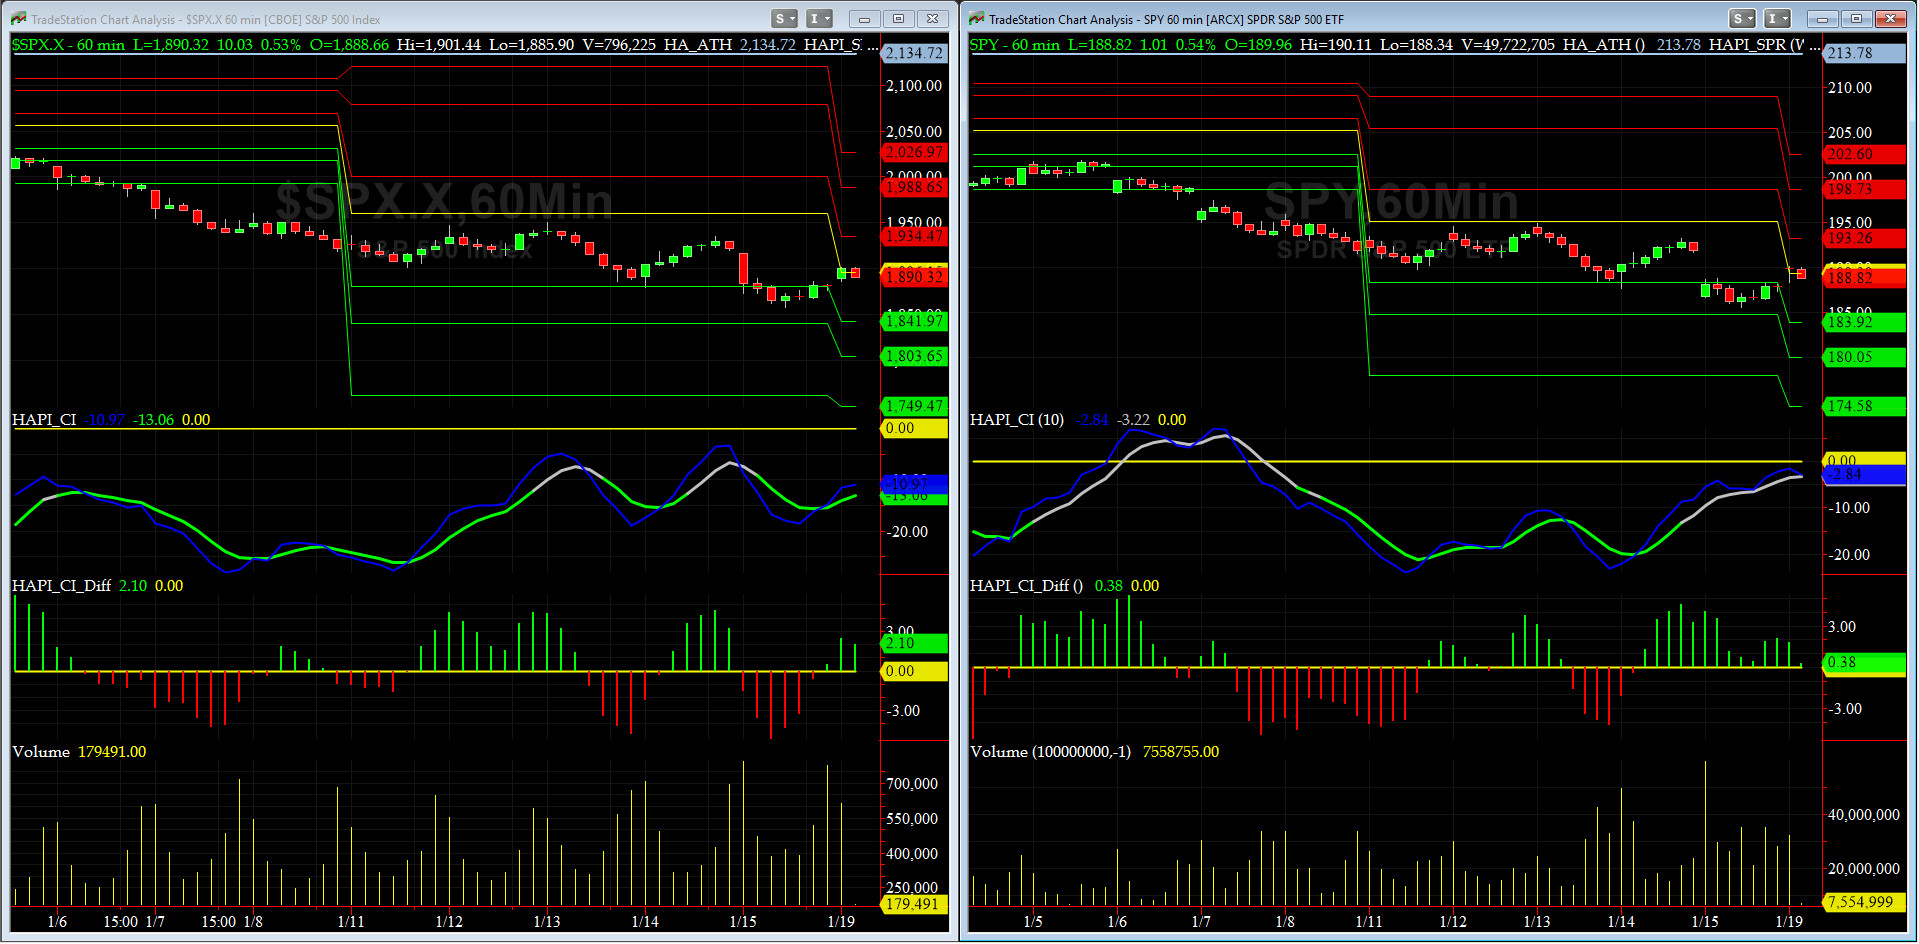
Tuesday, January 19, 2016, 1111ET
Companion Chart for Market Bias Review, Issue #127
|
|
|
|
|
|
Monday Night, January 18, 2016, 2200ET
Market Bias, Issue #127
Our current SPX Bias with Timer Digest: LONG SPX as of Thursday, January 7, 2016 Close at 1943.09
Our previous Bias: SHORT SPX (as of Thursday, December 24th, 2015 Close at 2060.99)
This WEEK�s Bias = Cautiously LONG SPX or SPY via Calls Spreads
Profit Target = 1940
Money Management Stop = 1870
BOTTOM LINE: The stock market is EXTREMELY oversold based on our short-term momentum and breadth indicators� Lack of normal bounce back should be a concern to all.
NOTE: All LEVELS mentioned here have been, are, and will be, based on the S&P-500 SPX Cash Index, and not the ES Futures. Tomorrow after the first hour is complete, we will post here a companion chart showing critical short-term WEEKLY levels to watch for possible �retest failures.�
Fari Hamzei
|
|
|
|
|
|
Monday, January 18, 2016 2145ET
Market Timing Charts, Analysis & Commentary #127
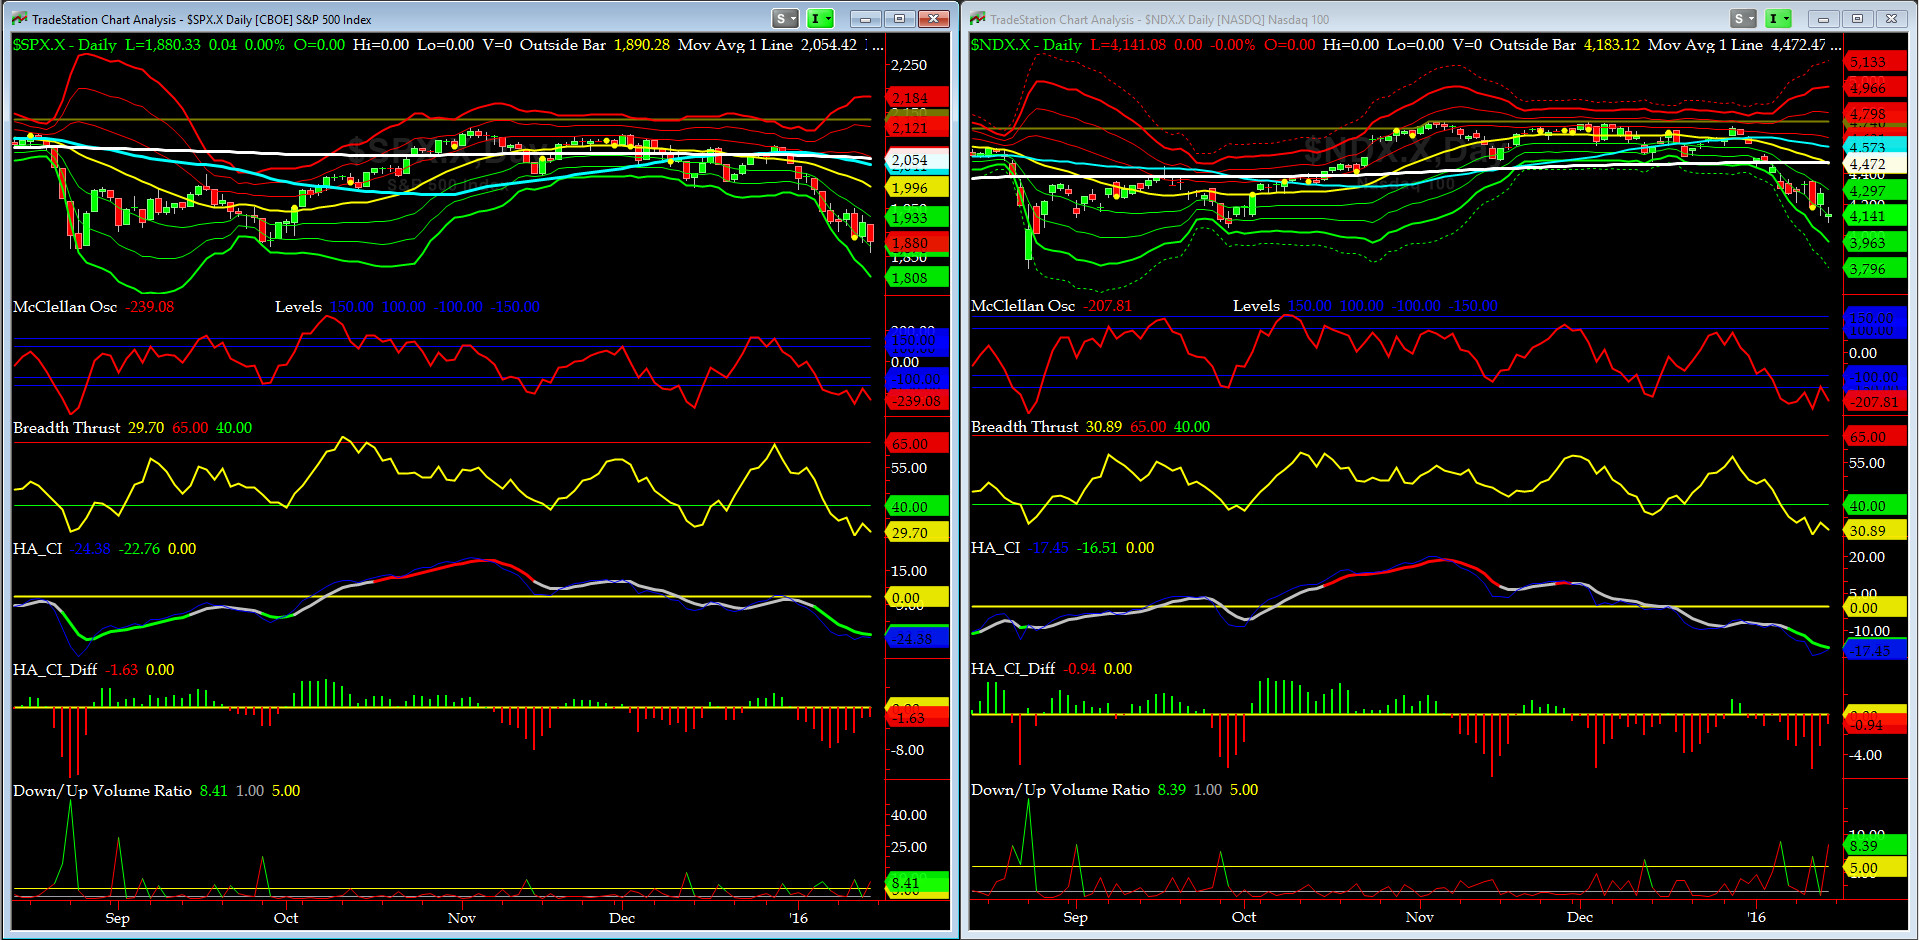
Timer Charts of S&P-500 Cash Index (SPX) + NASDAQ-100 Cash Index (NDX)
Most recent S&P-500 Cash Index (SPX): 1880.33 down -41.70 (down -2.17%) for the week ending on Friday, January 15th, 2016, which closed at its -2 sigma.
SPX ALL TIME INTRADAY HIGH = 2134.72 (reached on Wednesday, May 20th, 2015)
SPX ALL TIME CLOSING HIGH = 2130.82 (reached on Thursday, May 21st, 2015)
Current DAILY +2 Sigma SPX = 2121 with WEEKLY +2 Sigma = 2145
Current DAILY 0 Sigma (20 day MA) SPX = 1996 with WEEKLY 0 Sigma = 2012
Current DAILY -2 Sigma SPX = 1870 with WEEKLY -2 Sigma = 1880
NYSE McClellan Oscillator = -239 (-150 is start of the O/S area; around -275 to -300 area or lower, we go into the �launch-pad� mode, over +150, we are in O/B area)
NYSE Breadth Thrust = 29.7 (40 is considered as oversold and 65 as overbought)
SPX has had its worst 2-weeks of any new year, ever, now being down over 8% with NDX being down 10% in 2016. McClellan Oscillator & Breadth Thrust are now more short-term oversold than they were last weekend.
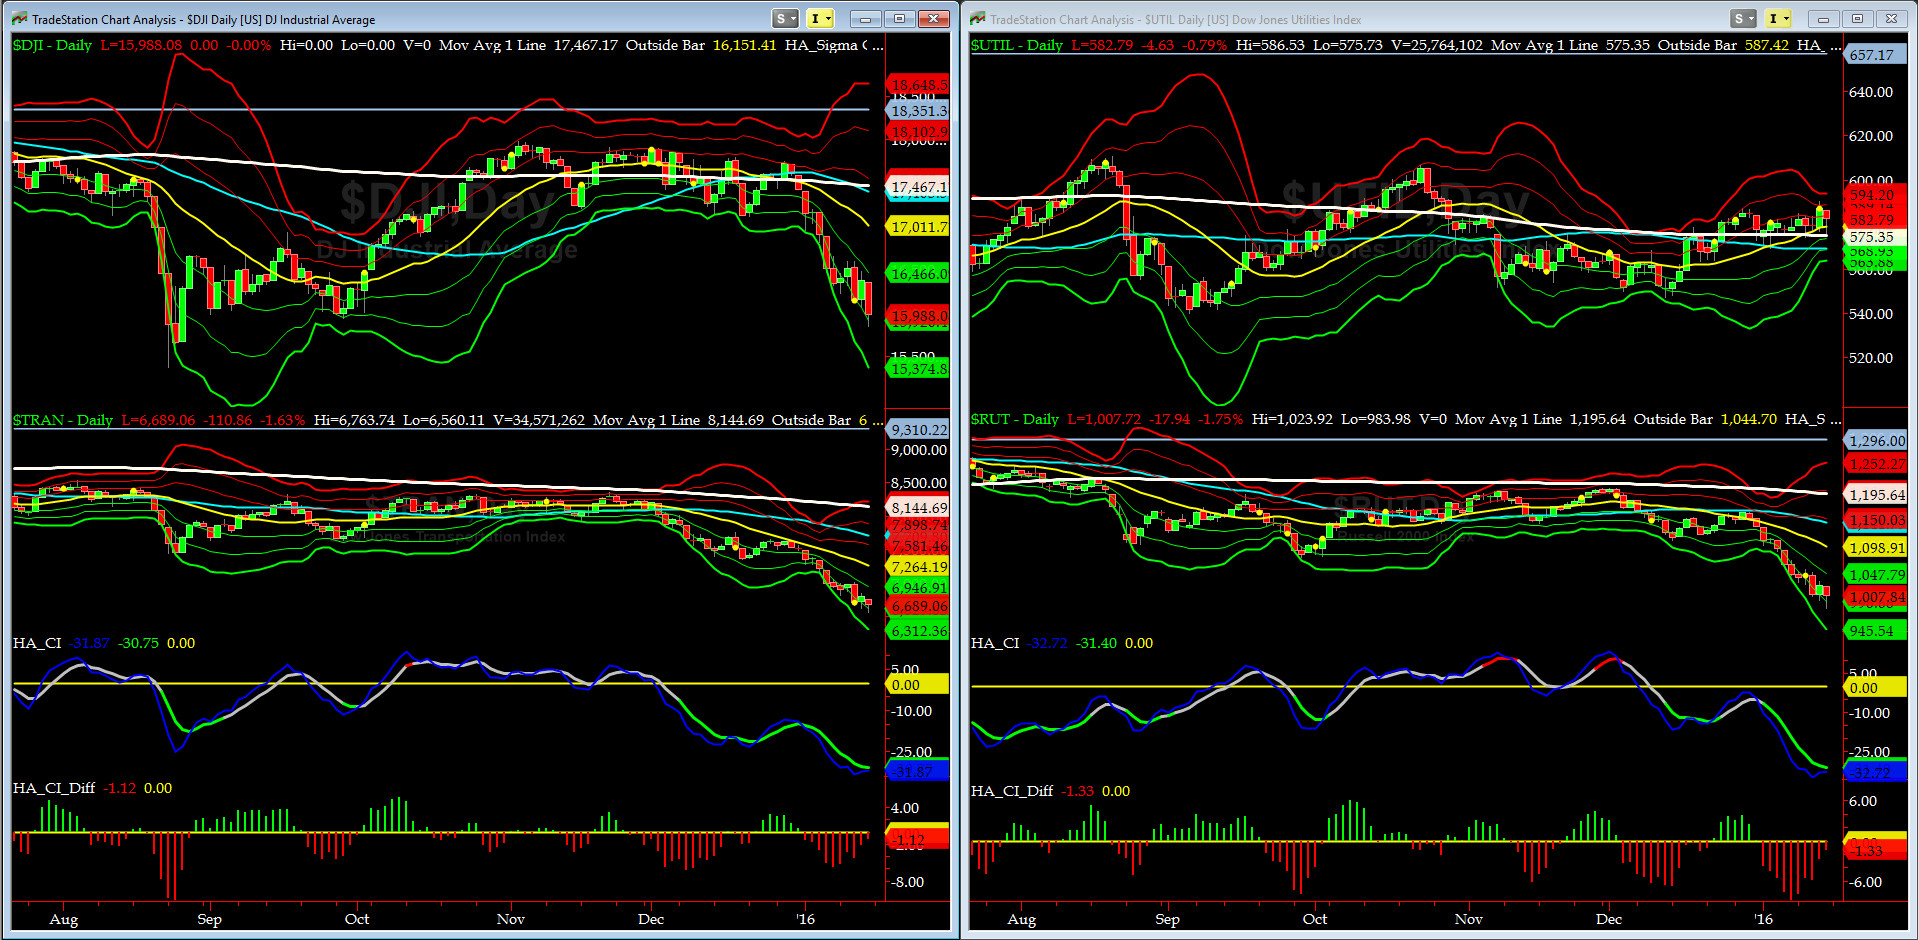
Canaries [in the Coal Mine] Chart for DJ TRAN & RUT Indices
200-Day MA DJ TRAN = 8144 or -17.9% above DJ TRAN (max observed in last 5 yrs = 20.2%, min = -20.3%)
200-Day MA RUT = 1197 or -14.3% above RUT (max observed in last 5 yrs = 21.3%, min = -22.6%)
We were wrong and carnage continued this past week.
Both DJ Transports (proxy for economic conditions 6 to 9 months hence) & Russell 2000 Small Caps (proxy for RISK ON/OFF) are at their respective -2 sigmas.
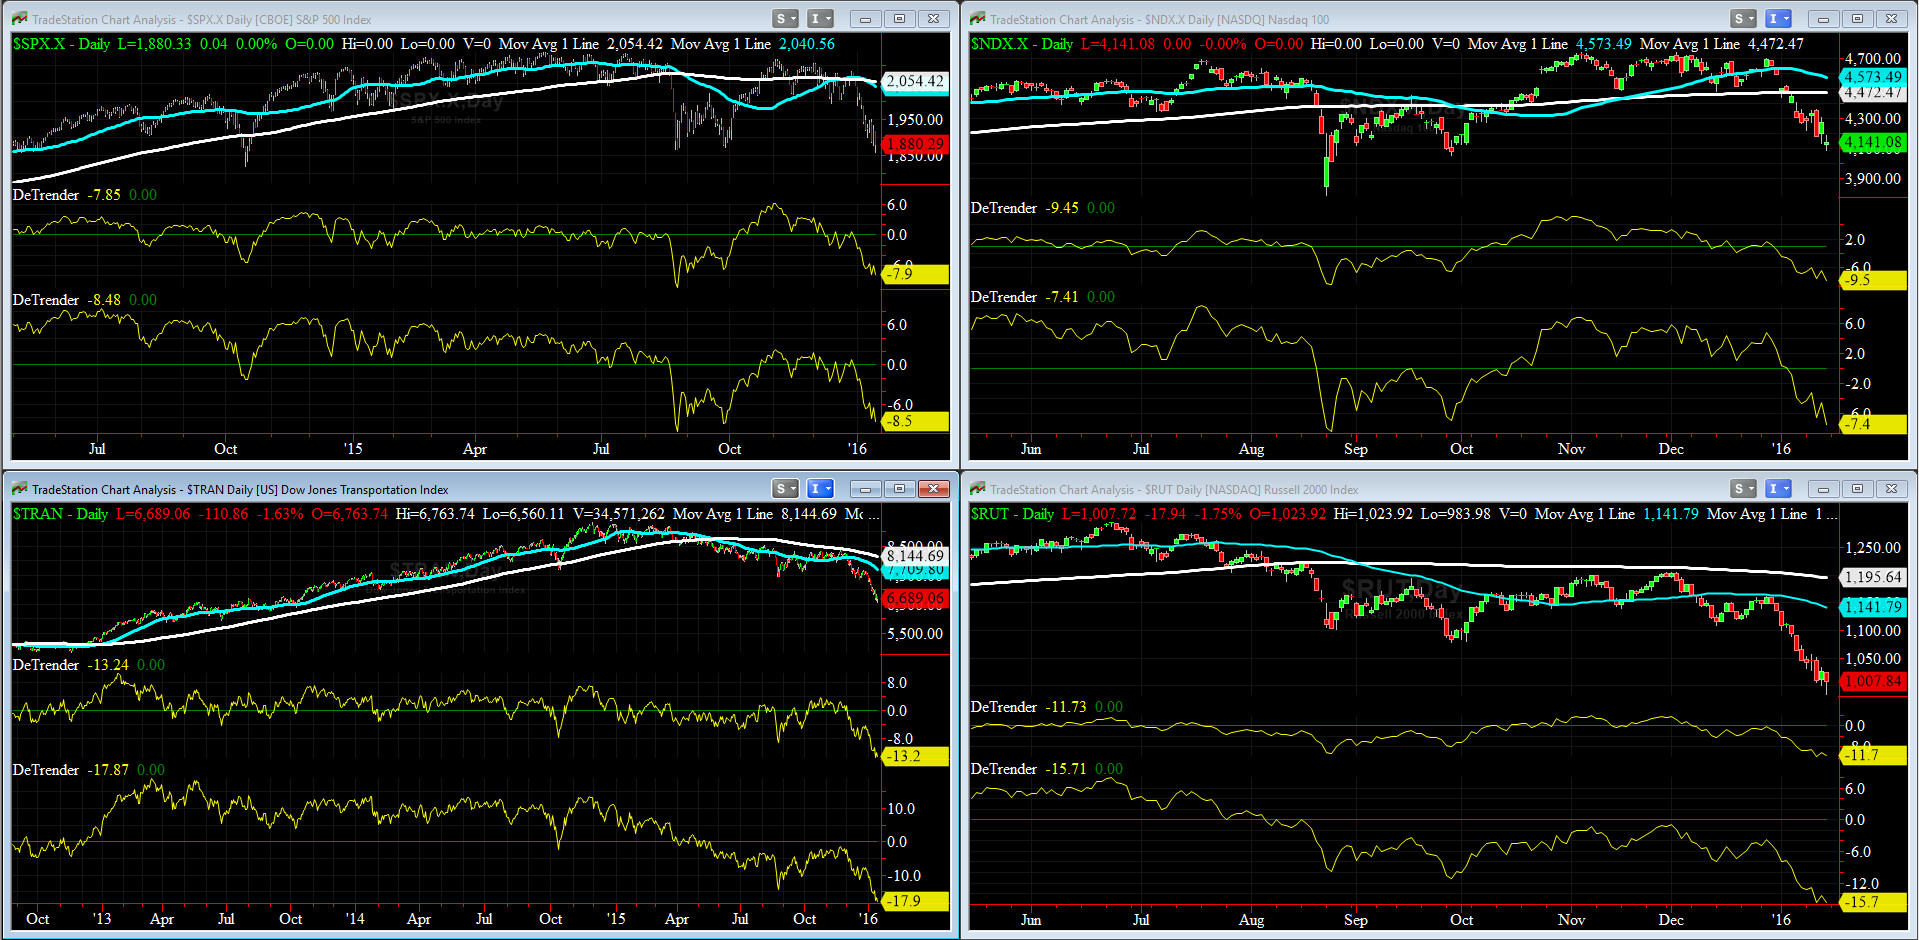
DeTrenders Charts for SPX, NDX, TRAN & RUT Indices
50-Day MA SPX =2041 or -7.9% above SPX (max observed in last 5 yrs = +8.6%, min = -9.3% )
200-Day MA SPX = 2054 or -8.5% above SPX (max observed in last 5 yrs = 15.2%, min = -14%)
All of our Eight DeTrenders are negative now.
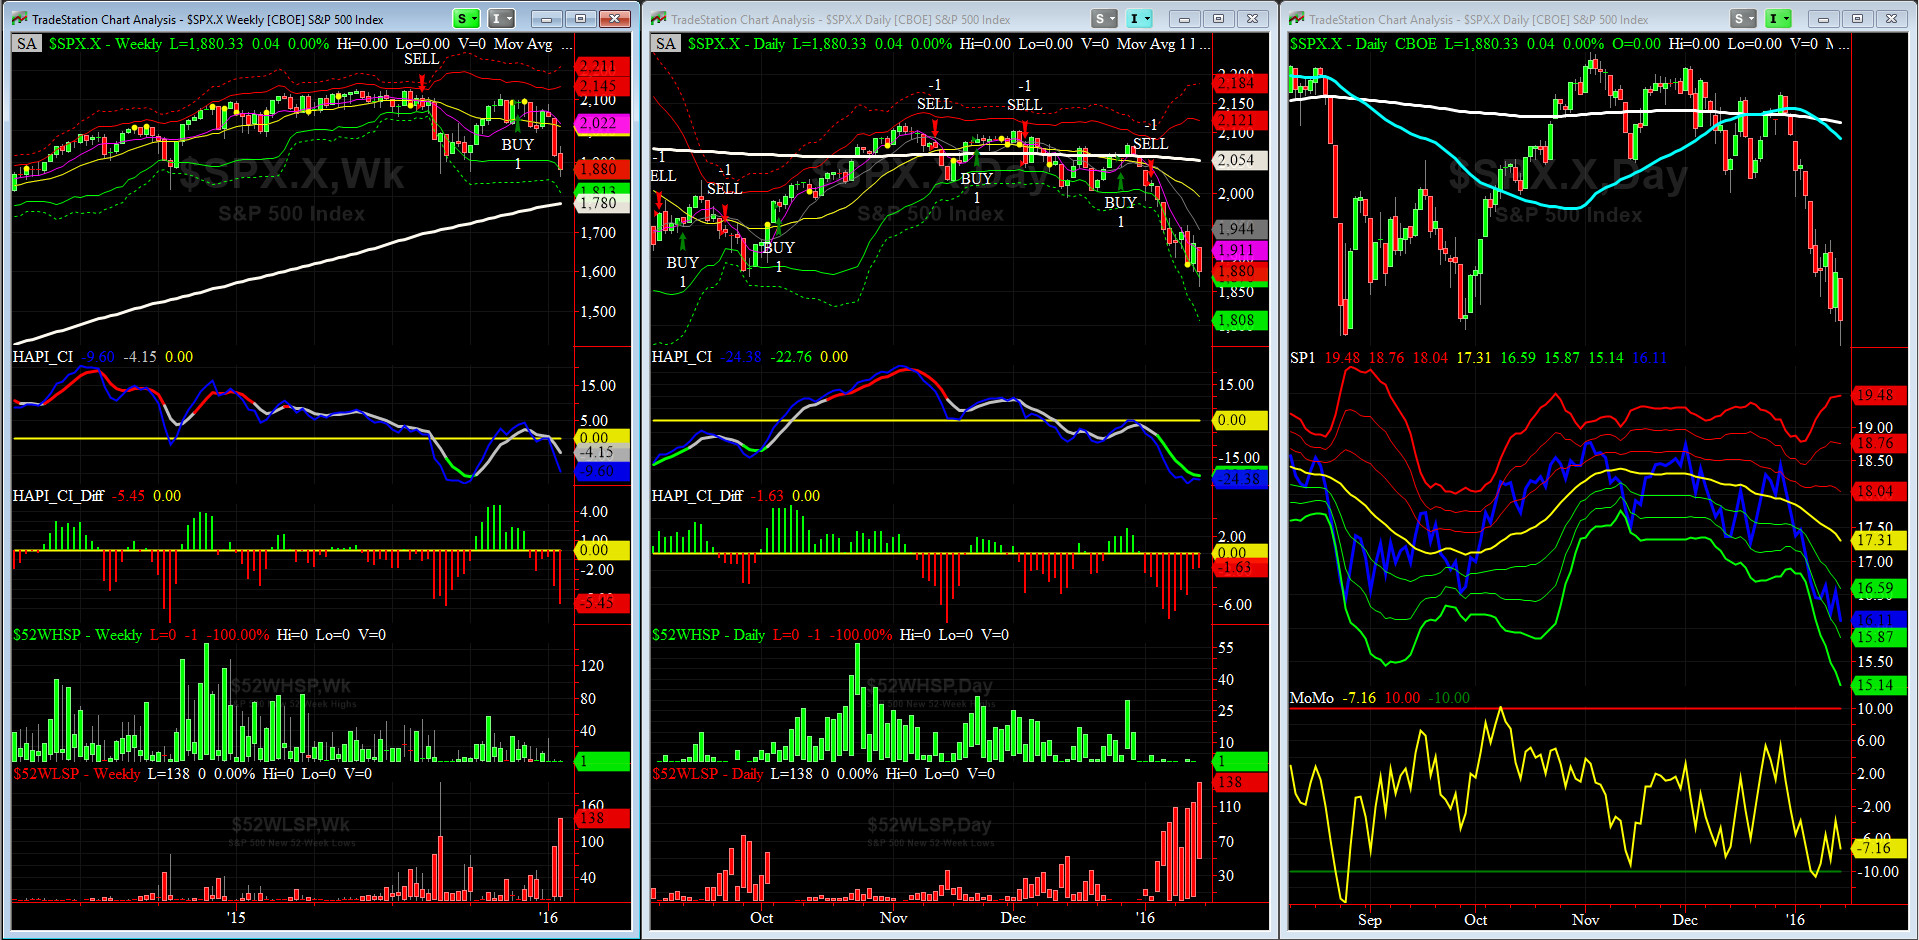
HA_SP1_momo Chart
WEEKLY Timing Model = on a BUY Signal since Friday 11/27/15 CLOSE
DAILY Timing Model = on a SELL Signal since Tuesday 1/05/16 CLOSE
Max SPX 52wk-highs reading last week = 2 (over 120-140, the local maxima is in)
Max SPX 52wk-Lows reading last week = 138 (over 40-60, the local minima is in)
HA_SP1 = near its -2 Sigma
HA_Momo = -7.2 (reversals most likely occur above +10 or below -10)
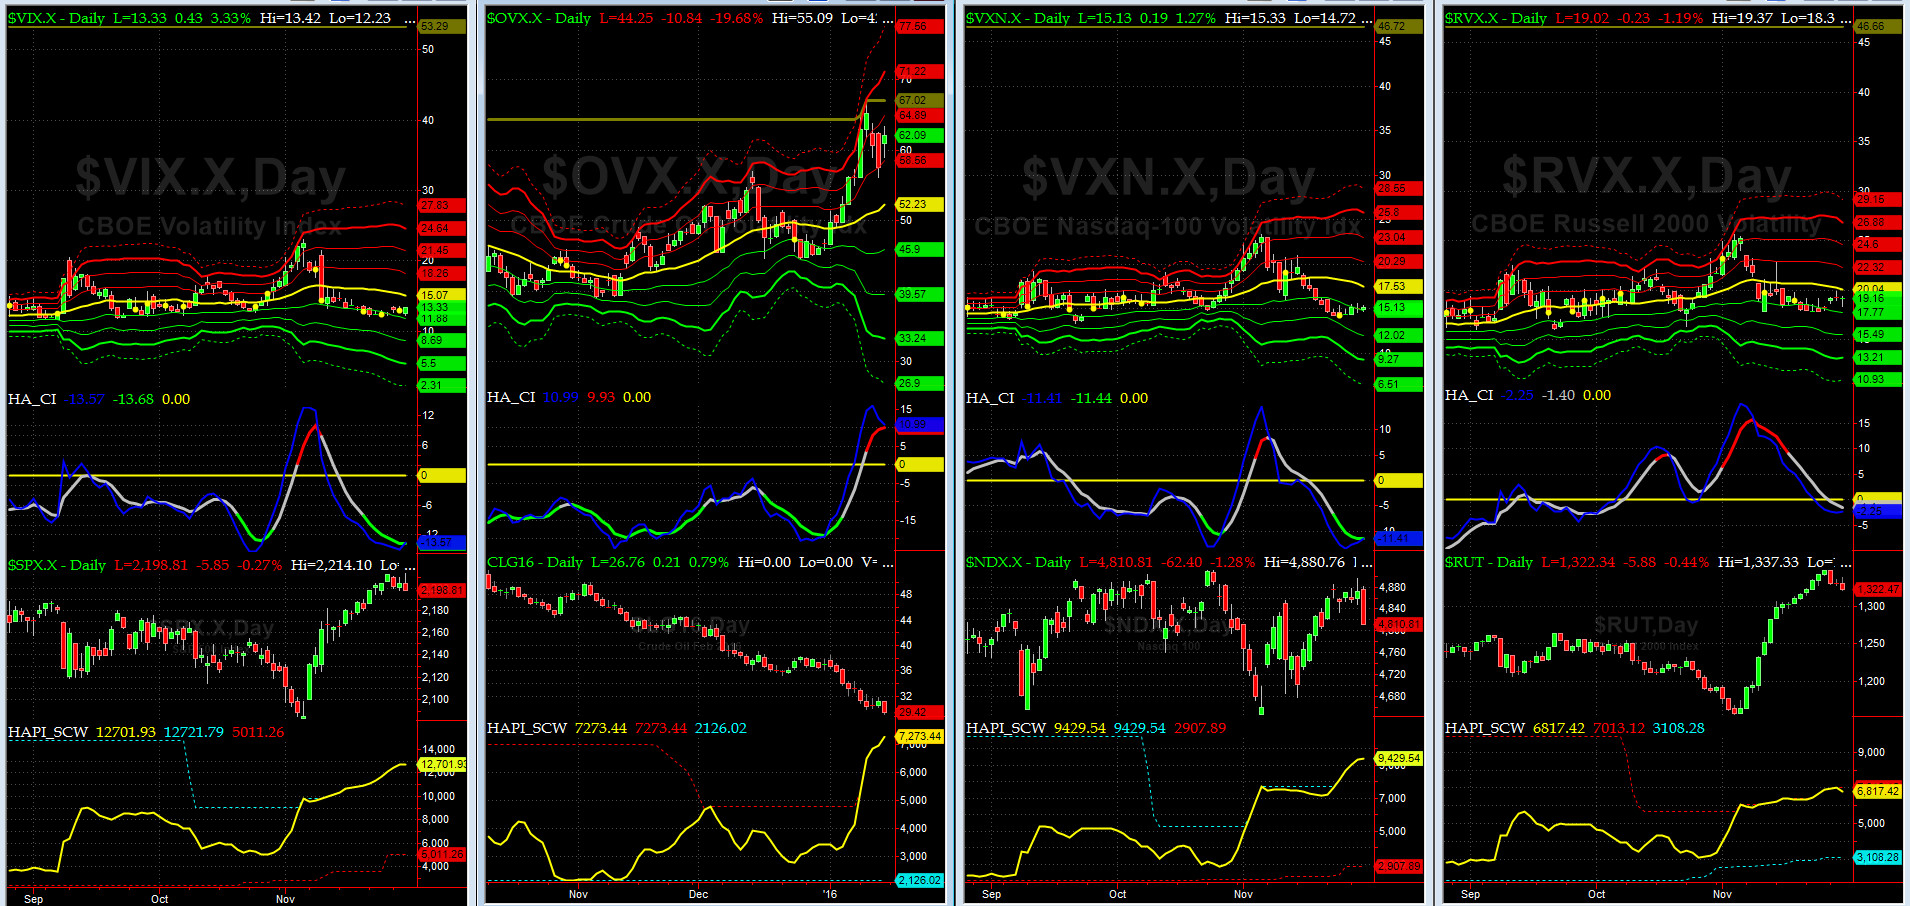
Vol of the Vols Chart
VIX = 27 which is just below its +2 sigma (remember it�s the VIX�s vol pattern (its sigma channels) that matters, and not the level of VIX itself (this is per Dr. Robert Whaley, a great mentor and the inventor of original VIX, now called VXO. VIX usually peaks around a test of its +4 sigma))
Vols, again we note, keep being somewhat tamed given the outsized delta move we have seen. Our best guess is [from what we observe in fin eng media] that too many vol funds are actively trading vols here. This is somewhat of a new phenomena.
Normally at this juncture, we should expect to see +3 and +4 sigmas but so far we have not. Stay tuned.....
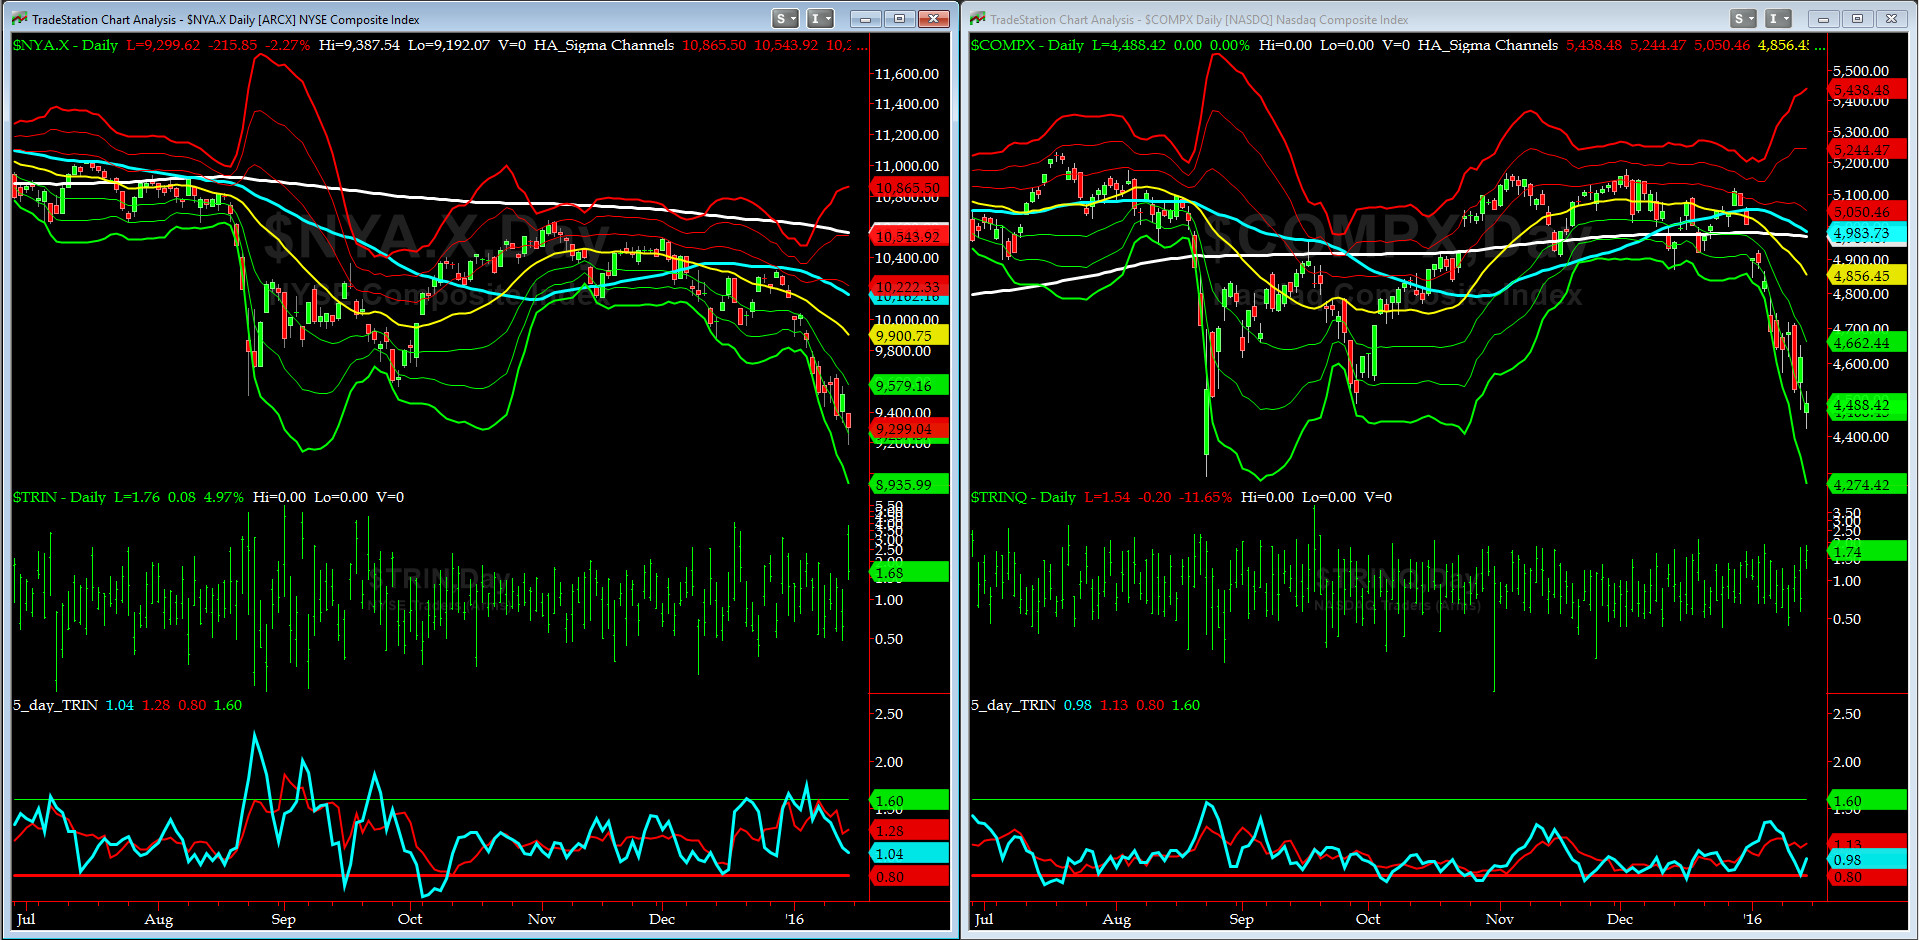
5-day TRIN & TRINQ Charts
The 5-day TRIN (for NYSE) is in neutral, while 5-day TRINQ (for NASDAQ) gave a SELL (yes sell) signal last Thursday.
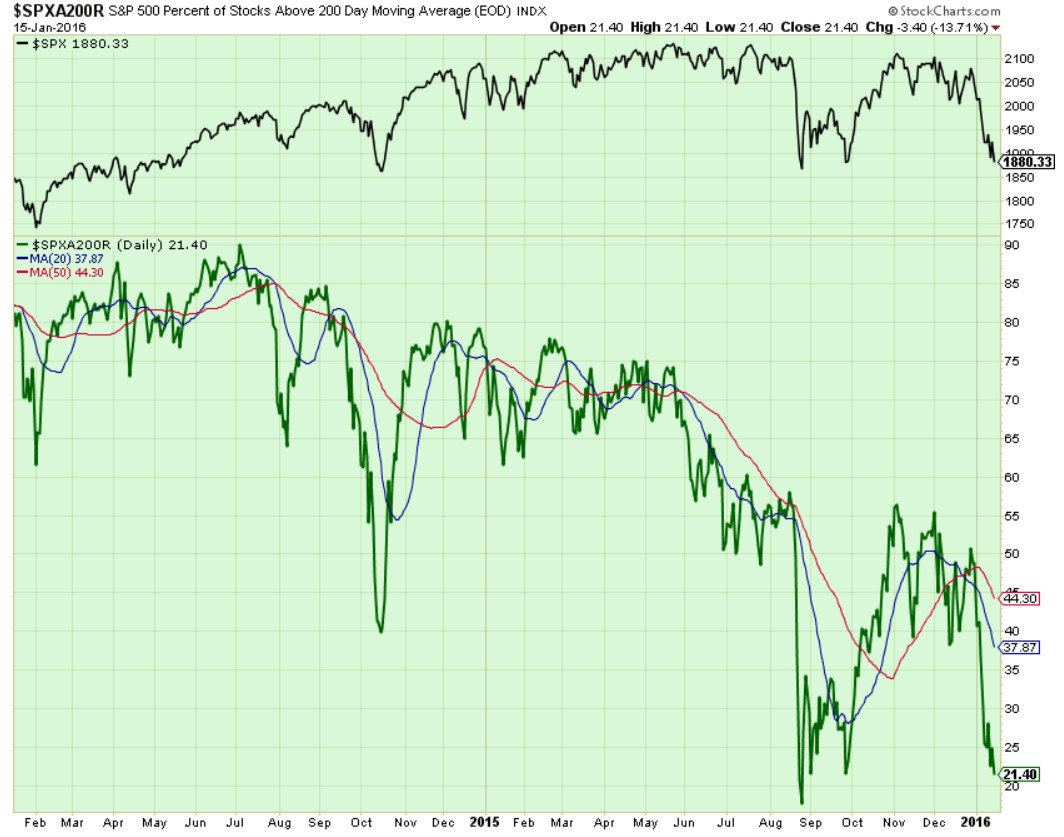
Components of SPX above their respective 200day MA Chart
As discussed here before, now, after a second week of hard sell-off, a test of 20% is all but certain.
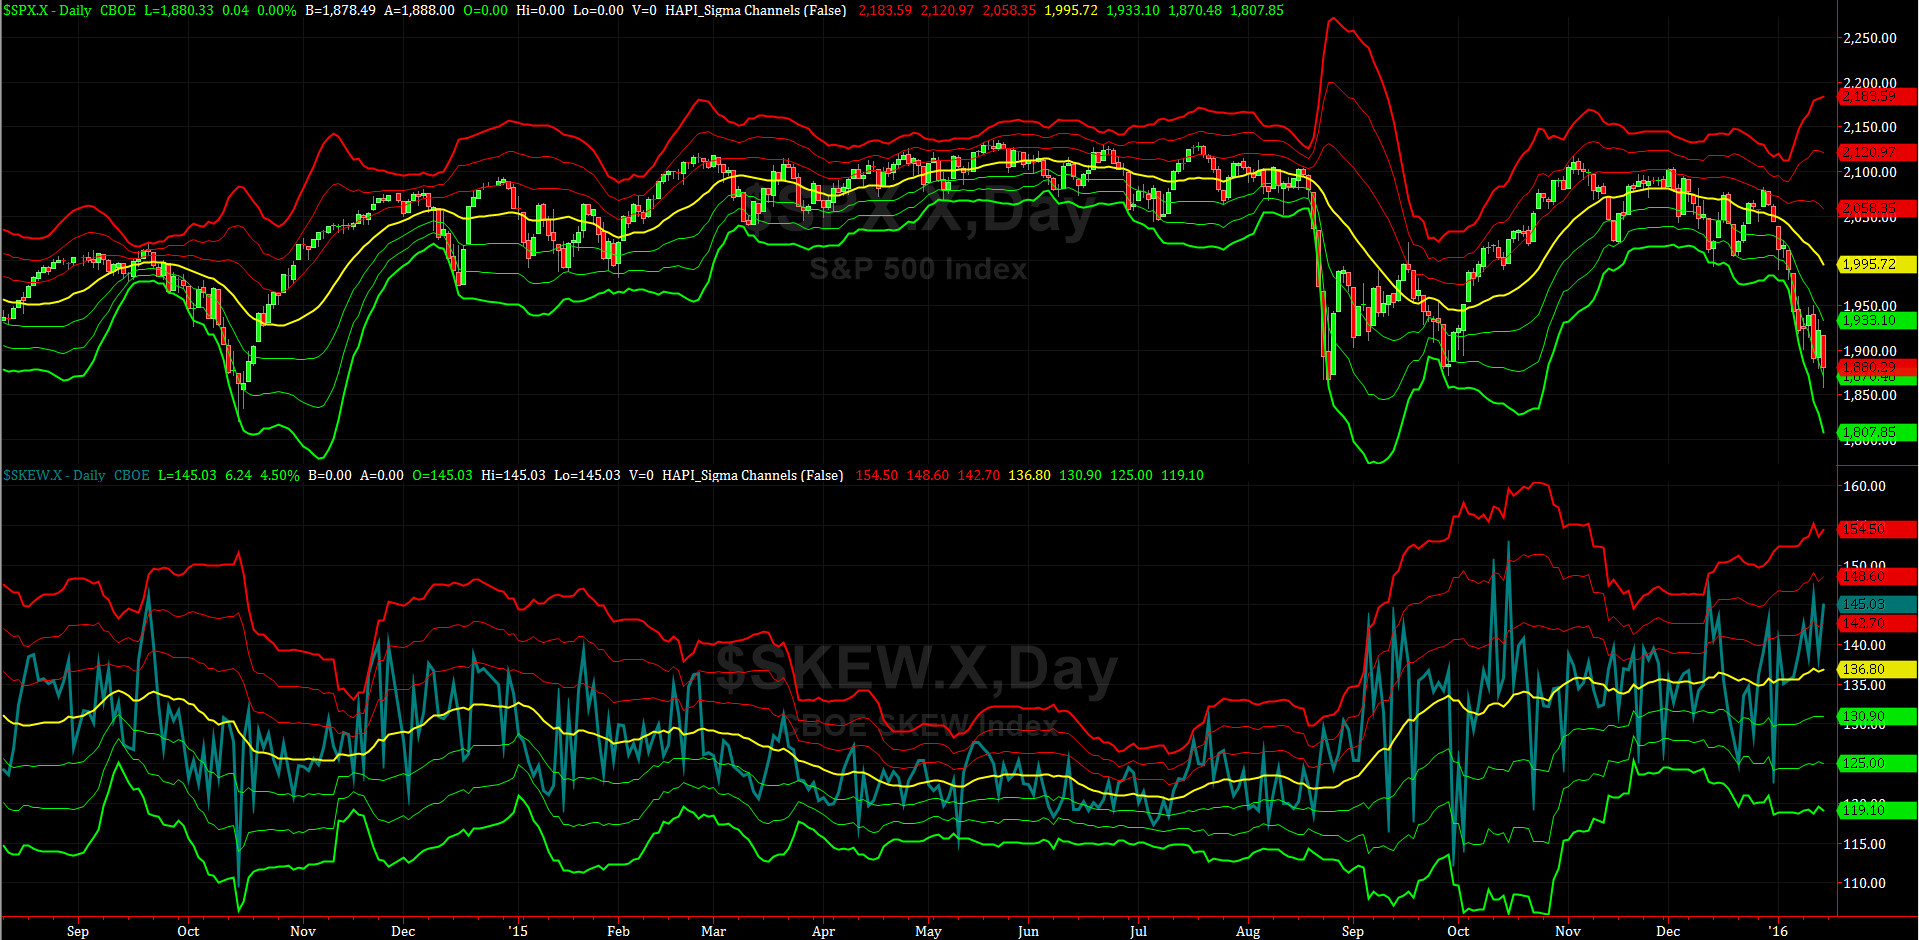
SPX SKEW (Tail Risk) Chart
SPX SKEW (Tail Risk) = 145 which is near its +1.5 sigma (normal = 120-125, range 100-150)
This high reading, given the price structure we are in, is no longer a surprise.
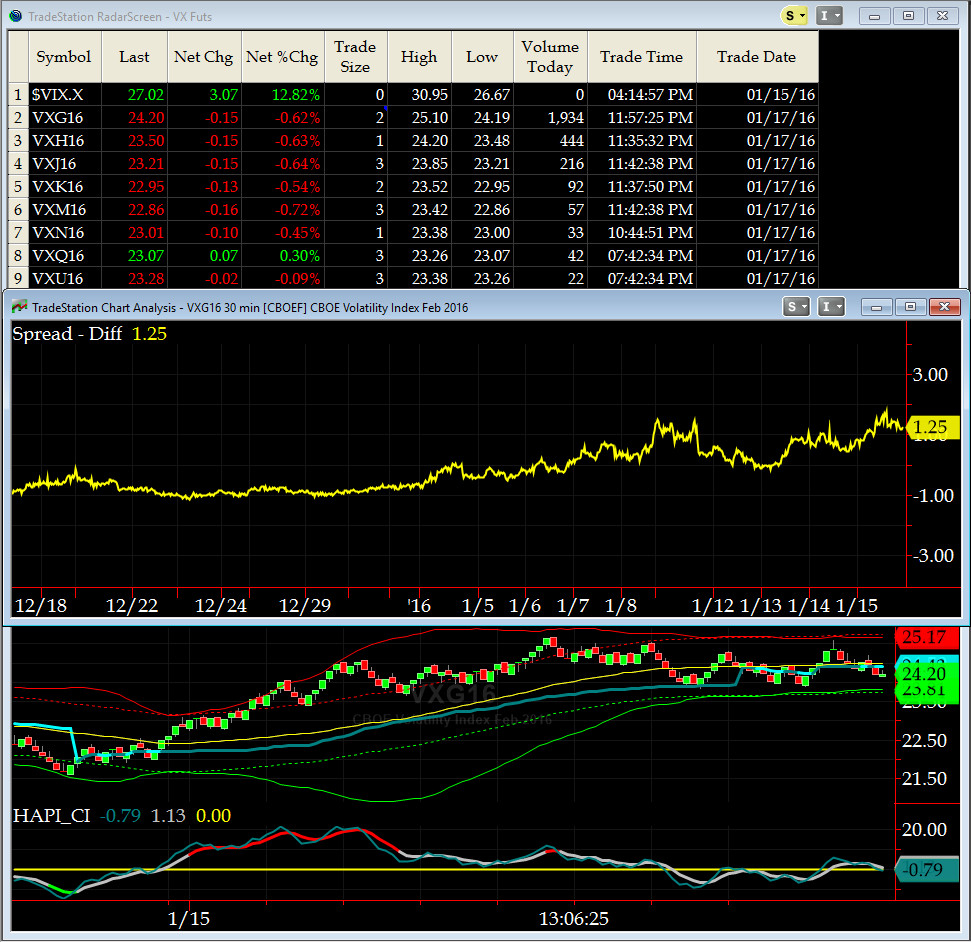
UPDATED 3-month VIX Futures Spread(VX) Chart
This Wednesday is JAN VIX Expiration so on Friday close, we rolled from Long Jan16 Short Apr16 to LONG FEB16 SHORT MAY16 spread.
Thus our 3-month VIX Futures Spread, closed at 1.27 on Friday. Again, this indicator says we are at or near a tradable bottom.
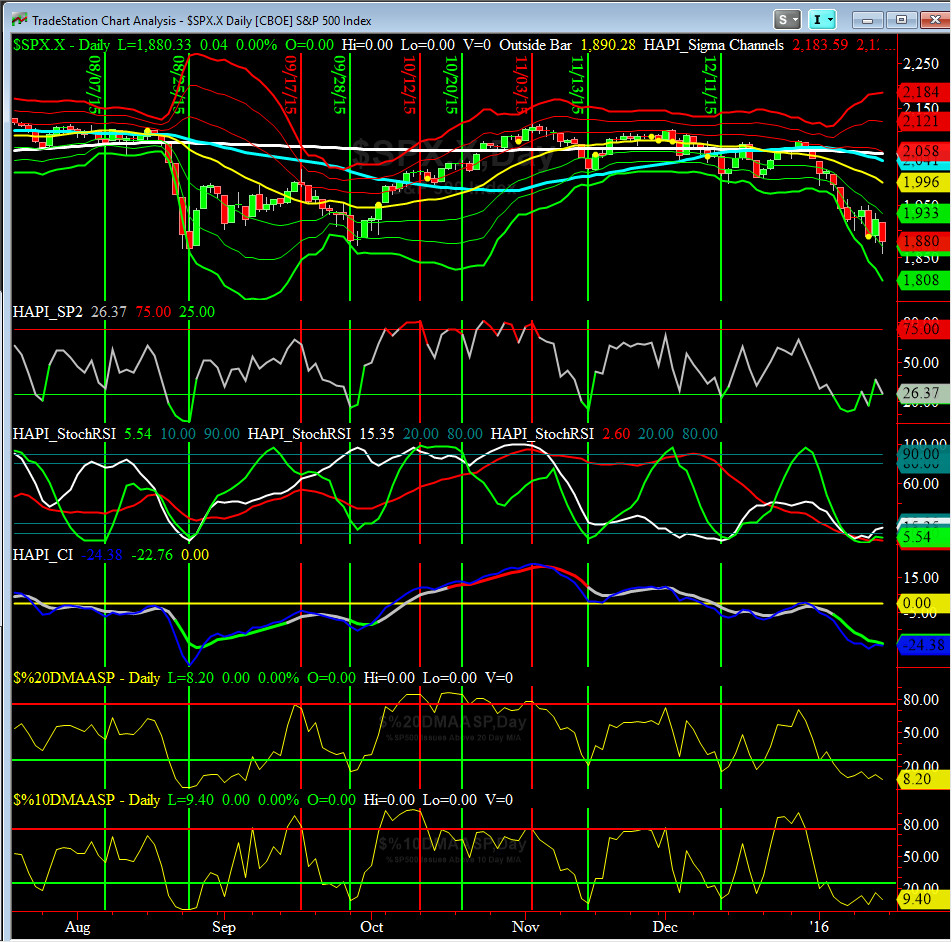
HA_SP2 Chart
HA_SP2 = 26.4 (Buy signal <= 20, Sell Signal >= 80)
At ~26, this prop indicator says the low is most probably in. Worth noting on this chart is that all 2 of the 3 HAPI StockRSIs are below 10 since prior week. That should indicate that the short-term bottomw is most likely in.

SPX 2008 Analog for SPX 2016
After using Analog for about 15 years, we must admit that at this early stage of a year, picking an analog is fairly tough. The fast move down resembles early January 2008, so, for now, my co-pilot, @Capt_Tiko (now with over 230 Twitter Followers) has started a track using 2008. I am stocking up on more tea.
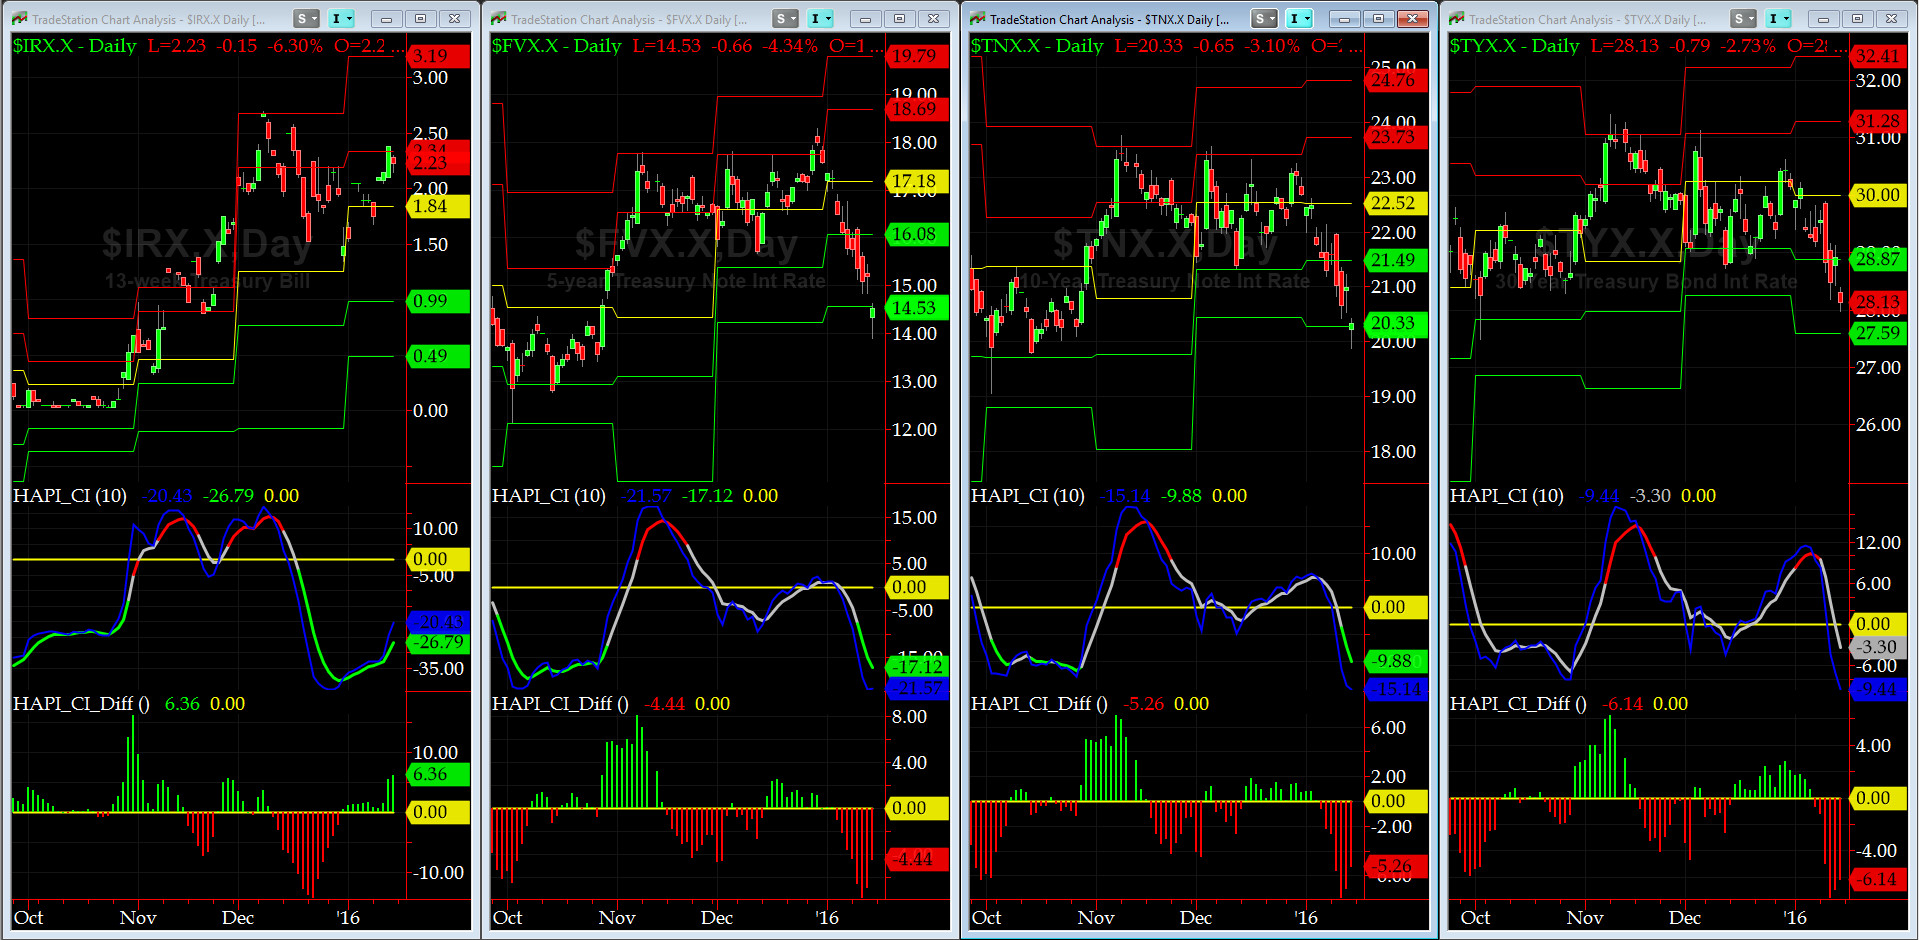
US Treasury T-Notes & T-Bonds Yields Chart
During this past two weeks, the rush of flight-to-quality saw our Treasury Complex Yields pull back across the board.
Good luck this week,
Fari Hamzei
|
|
|
|
|
|
Customer Care:
|
|
|
|
|
|
|
 |
 |
|
 |
|
 |
 |
 |
HA YouTube Channel ::: HA Blog ::: Testimonials ::: Tutorials & FAQs ::: Privacy Policy
|
Trading Derivatives (Options & Futures) contains substantial risk and is not for every investor. An investor could potentially lose all or more than his/her initial investment.
Only risk capital should be used for trading and only those with sufficient risk capital should consider trading derivatives. Past performance is not
necessarily indicative of future results. Testimonials appearing on this website may not be representative of other clients or customers
and are not a guarantee of future performance or success.
|
| (c) 1998-2025, Hamzei Analytics, LLC.® All Rights Reserved. |
|
|