|
Sunday, January 24, 2016 2215ET
Market Timing Charts, Analysis & Commentary for Issue #128
Timer Charts of S&P-500 Cash Index (SPX) + NASDAQ-100 Cash Index (NDX)
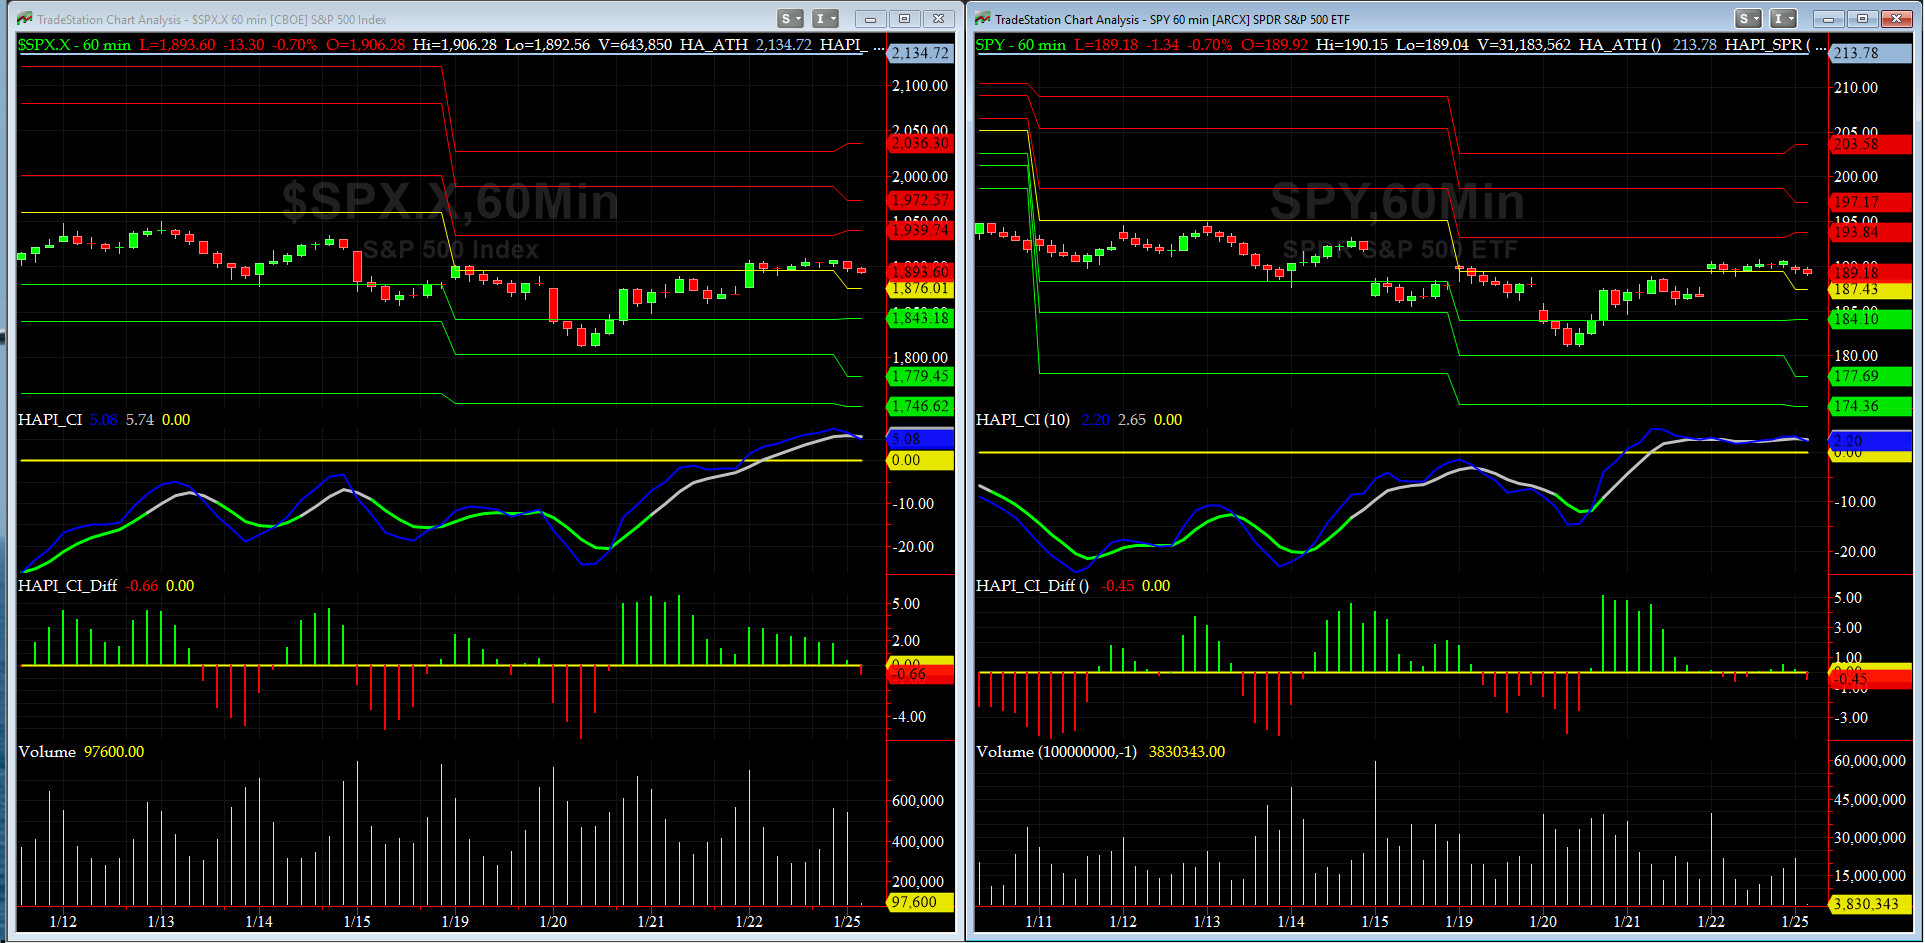
Most recent S&P-500 Cash Index (SPX): 1906.90 up +26.57 (up +1.4%) for the week ending on Friday, January 22nd, 2016, which closed above its -1 sigma.
SPX ALL TIME INTRADAY HIGH = 2134.72 (reached on Wednesday, May 20th, 2015)
SPX ALL TIME CLOSING HIGH = 2130.82 (reached on Thursday, May 21st, 2015)
Current DAILY +2 Sigma SPX = 2116 with WEEKLY +2 Sigma = 2146
Current DAILY 0 Sigma (20 day MA) SPX = 1966 with WEEKLY 0 Sigma = 2012
Current DAILY -2 Sigma SPX = 1817 with WEEKLY -2 Sigma = 1877
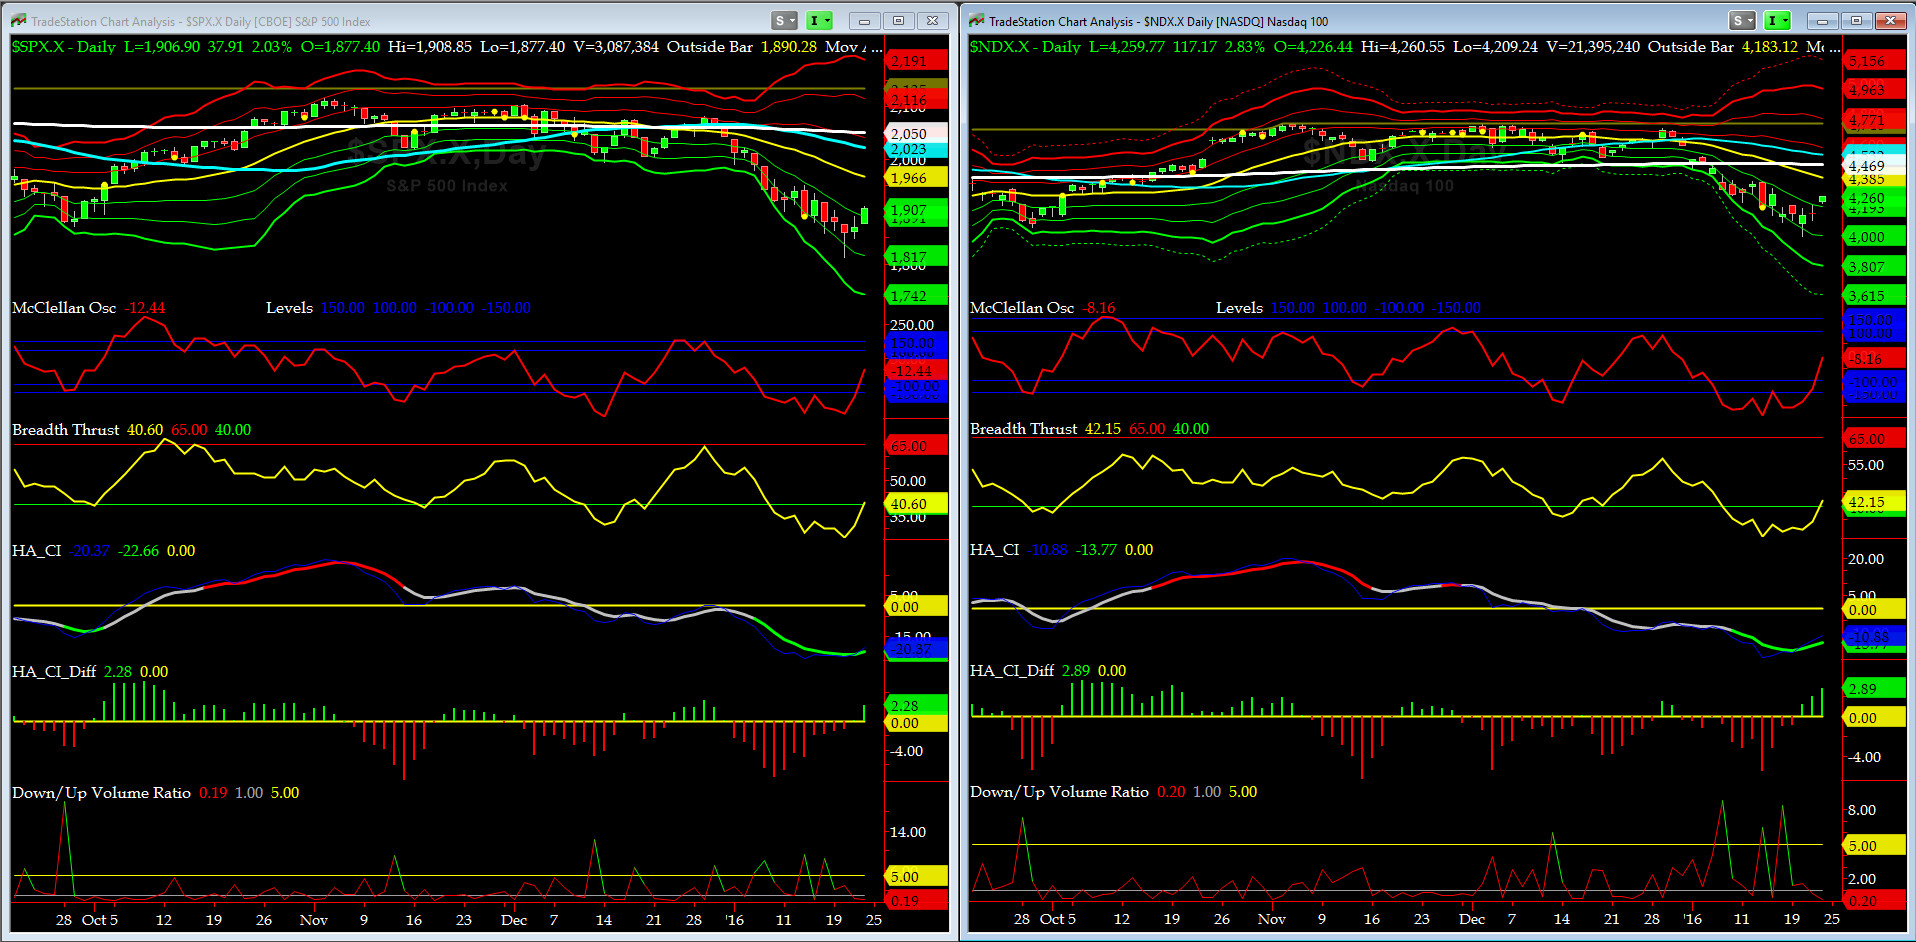
NYSE McClellan Oscillator = -12 (-150 is start of the O/S area; around -275 to -300 area or lower, we go into the �launch-pad� mode, over +150, we are in O/B area)
NYSE Breadth Thrust = 40.6 (40 is considered as oversold and 65 as overbought)
By midday last Wednesday, SPX has had its worst 3-weeks of any new year, ever, being down over 11.4% with NDX being down 13% in 2016. McClellan Oscillator & Breadth Thrust were showing extreme short-term oversold readings. The massive rally since that intraday low ripped the faces of the shorts and left us longs absolutely breathless.
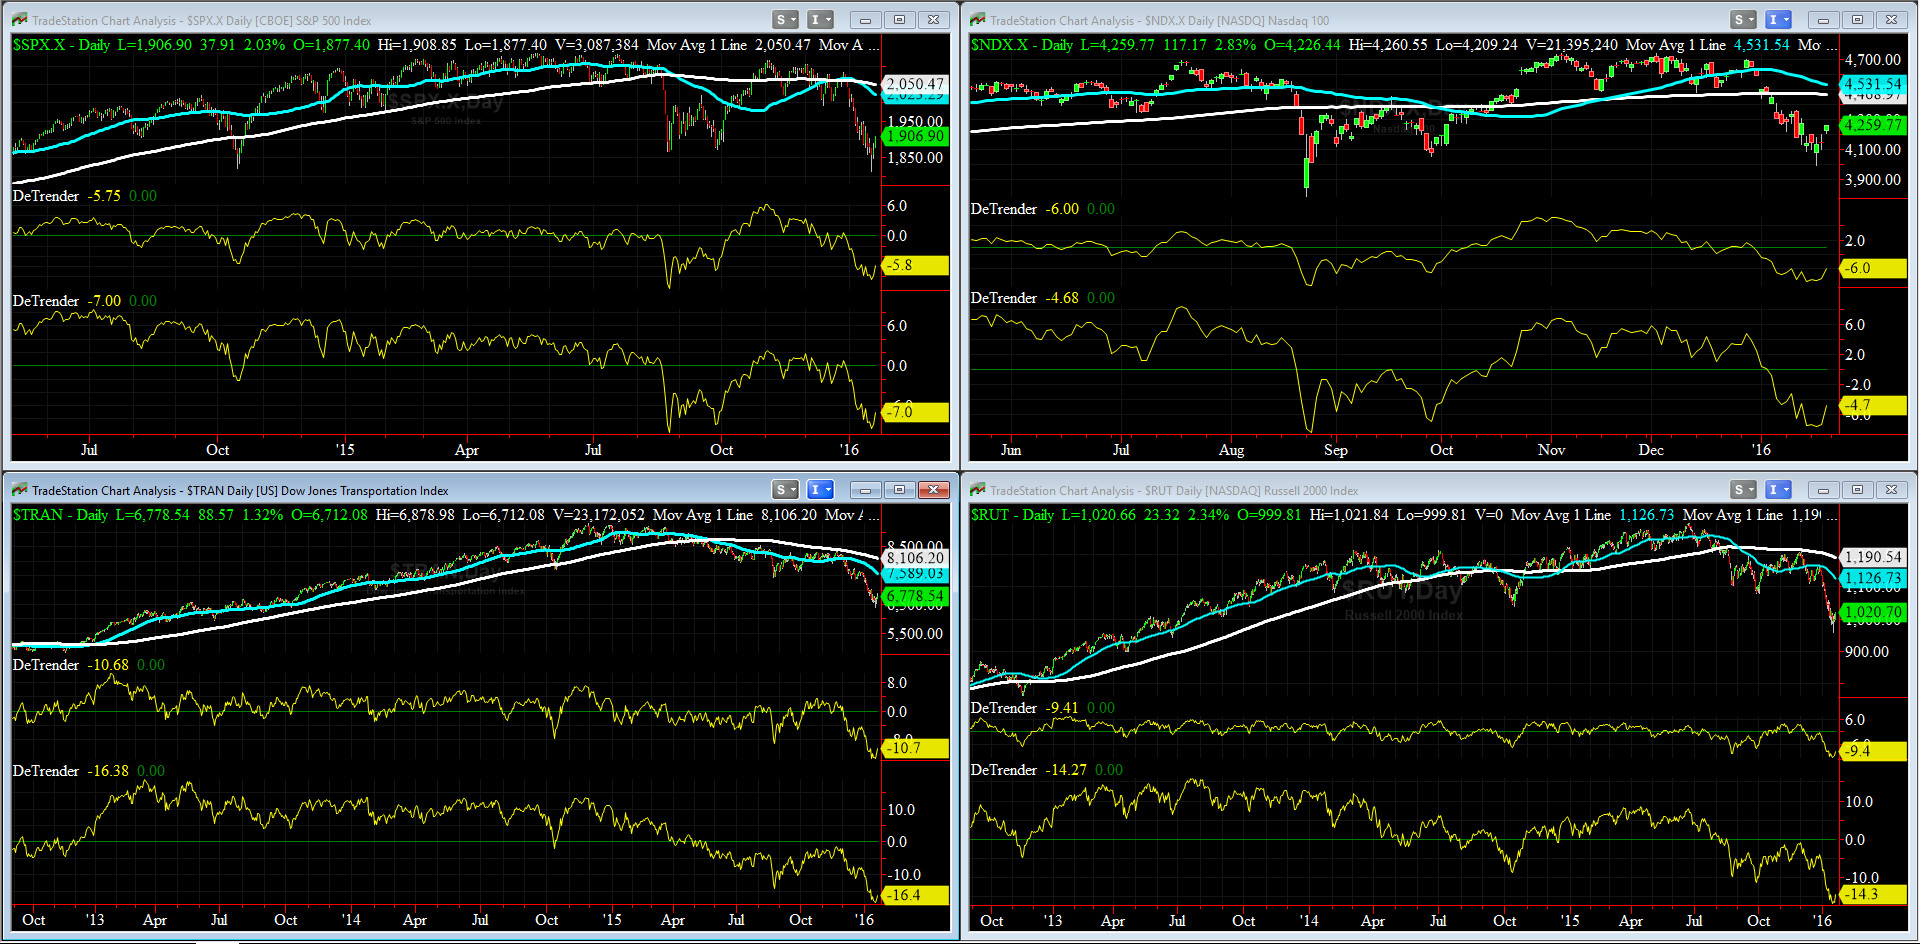
Canaries [in the Coal Mine] Chart for DJ TRAN & RUT Indices
200-Day MA DJ TRAN = 8106 or -16.4% above DJ TRAN (max observed in last 5 yrs = 20.2%, min = -20.3%)
200-Day MA RUT = 1190 or -14.3% above RUT (max observed in last 5 yrs = 21.3%, min = -22.6%)
By midday Wednesday both DJ Transports (proxy for economic conditions 6 to 9 months hence) & Russell 2000 Small Caps (proxy for RISK ON/OFF) were at their respective WEEKLY -3 sigmas for three weeks in a row !!
If history is any guide, we think 1-month to 3-month forward, SPX should trade much higher. Having said that, we still think a key retest failure is ahead and we need to keep our guards up.
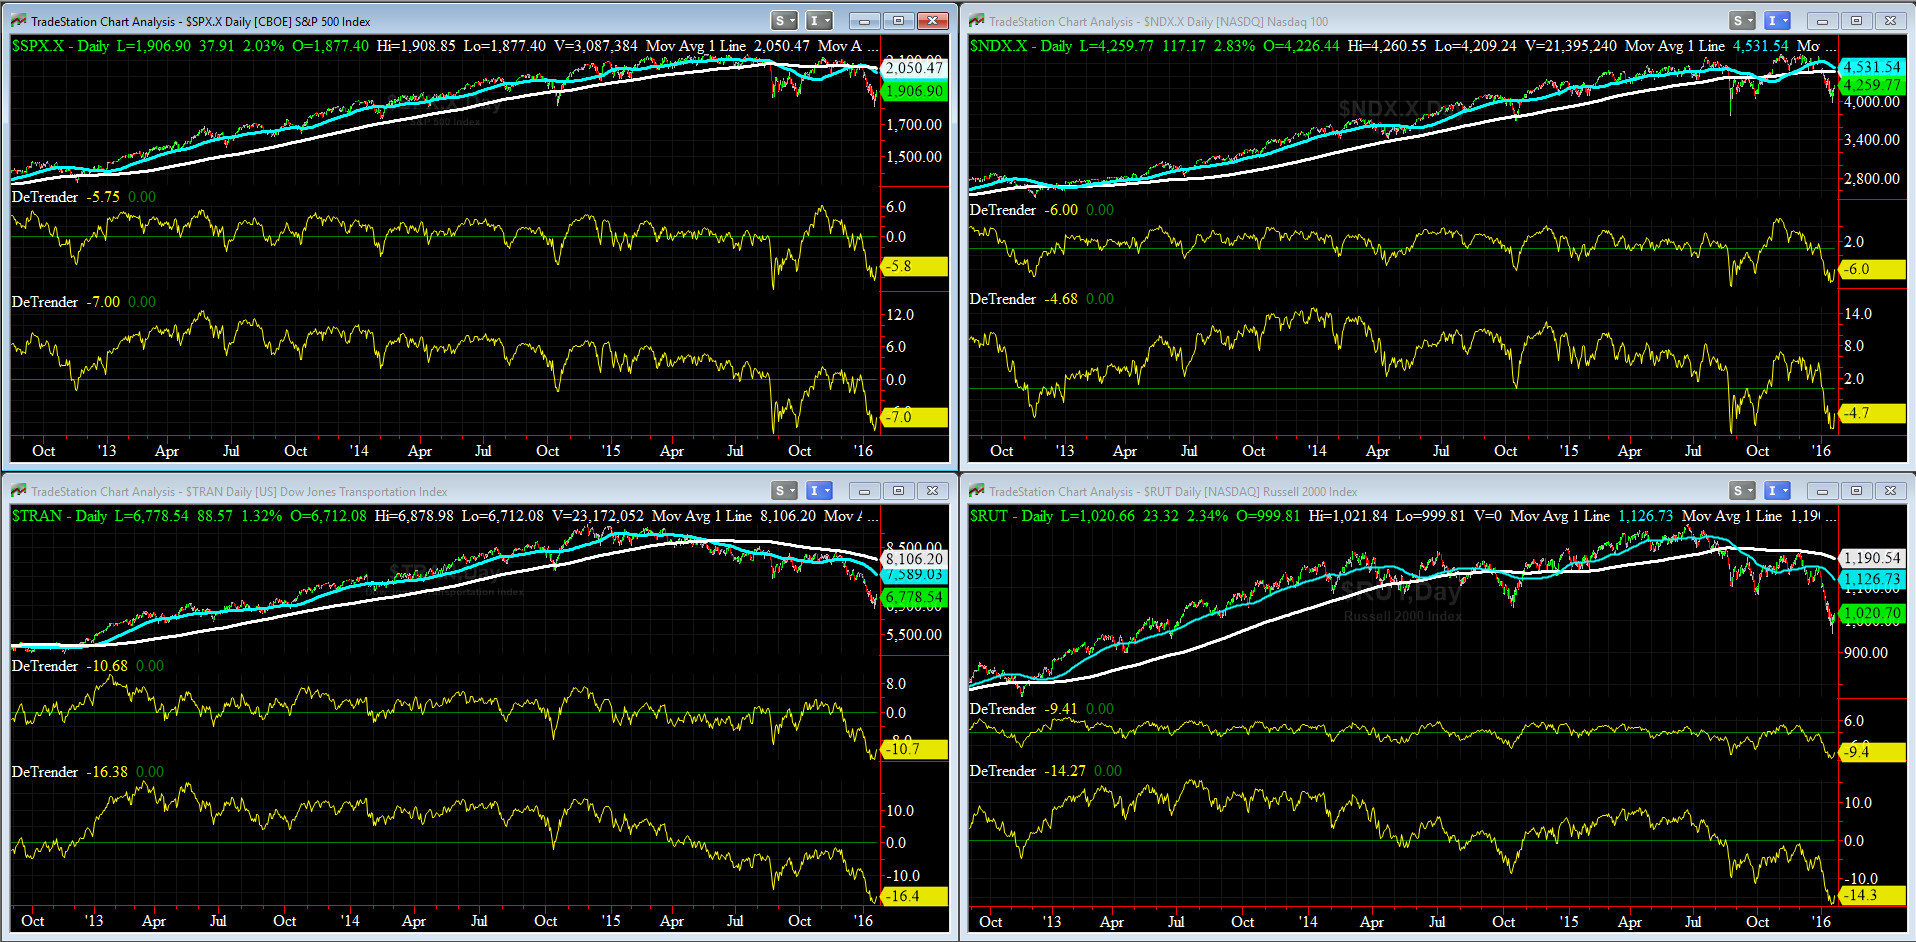
DeTrenders Charts for SPX, NDX, TRAN & RUT Indices
50-Day MA SPX =2023 or -5.8% above SPX (max observed in last 5 yrs = +8.6%, min = -9.3% )
200-Day MA SPX = 2050 or -7.0% above SPX (max observed in last 5 yrs = 15.2%, min = -14%)
All of our Eight DeTrenders are still negative but now they are all reversed up.
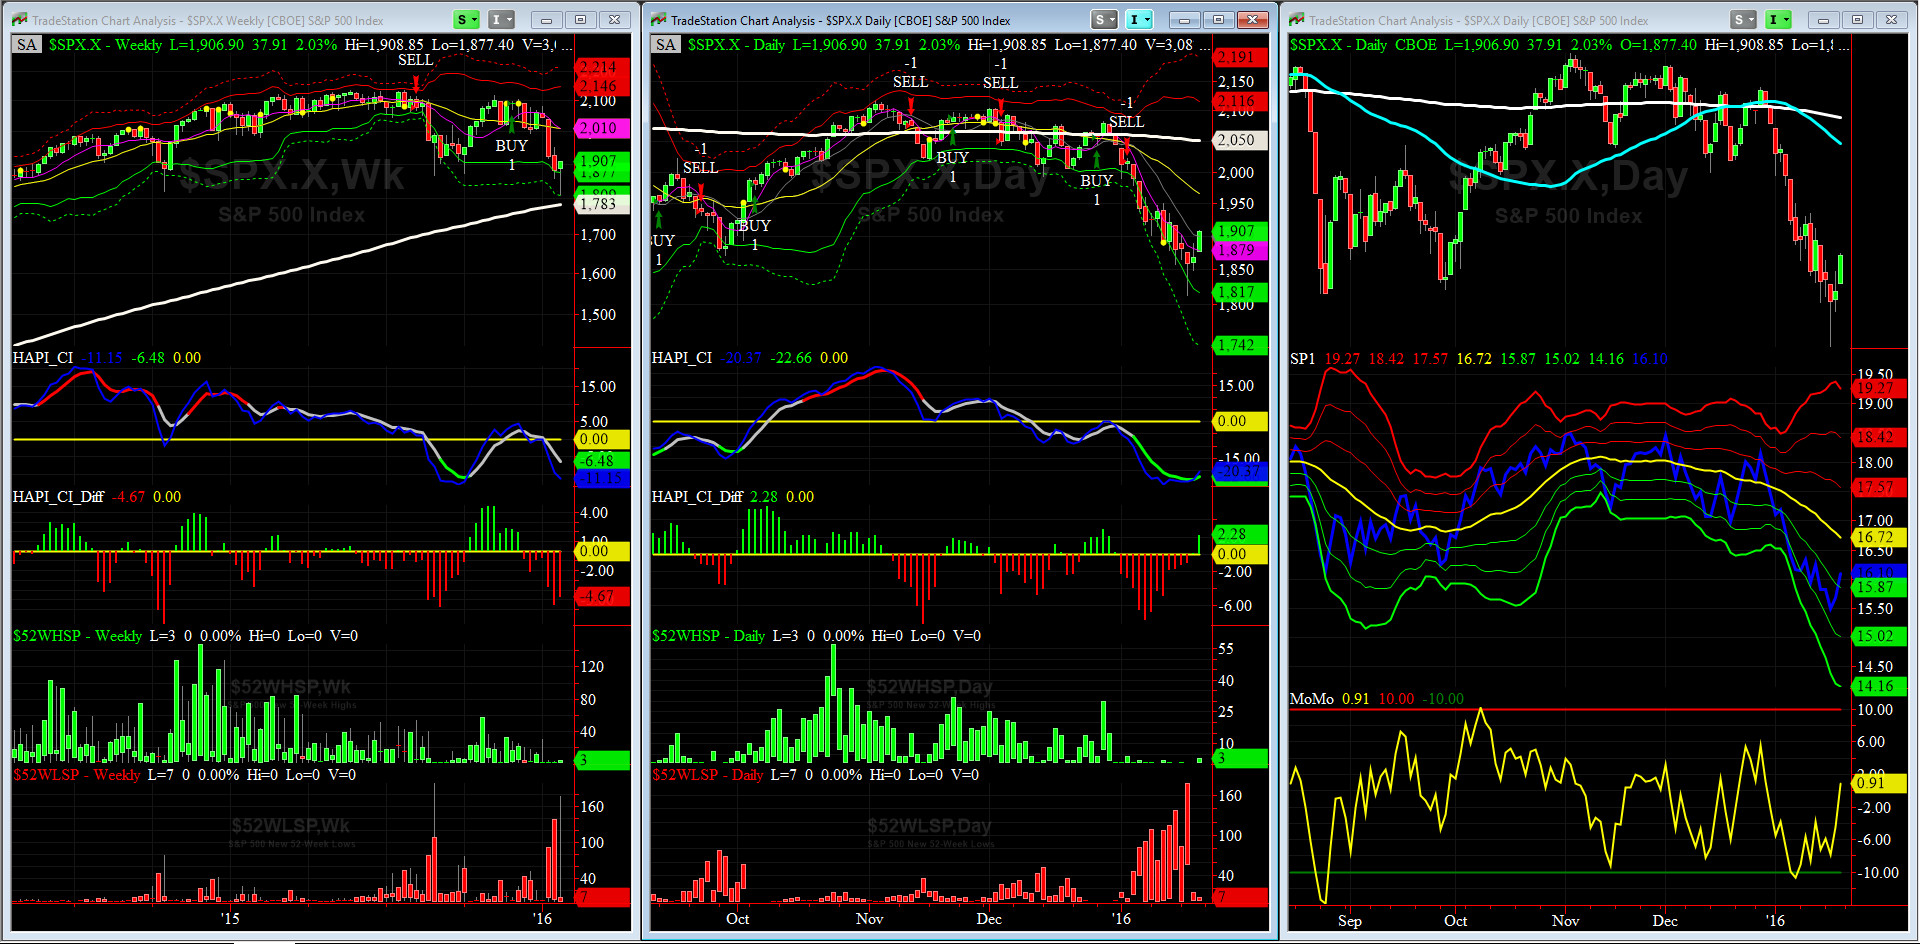
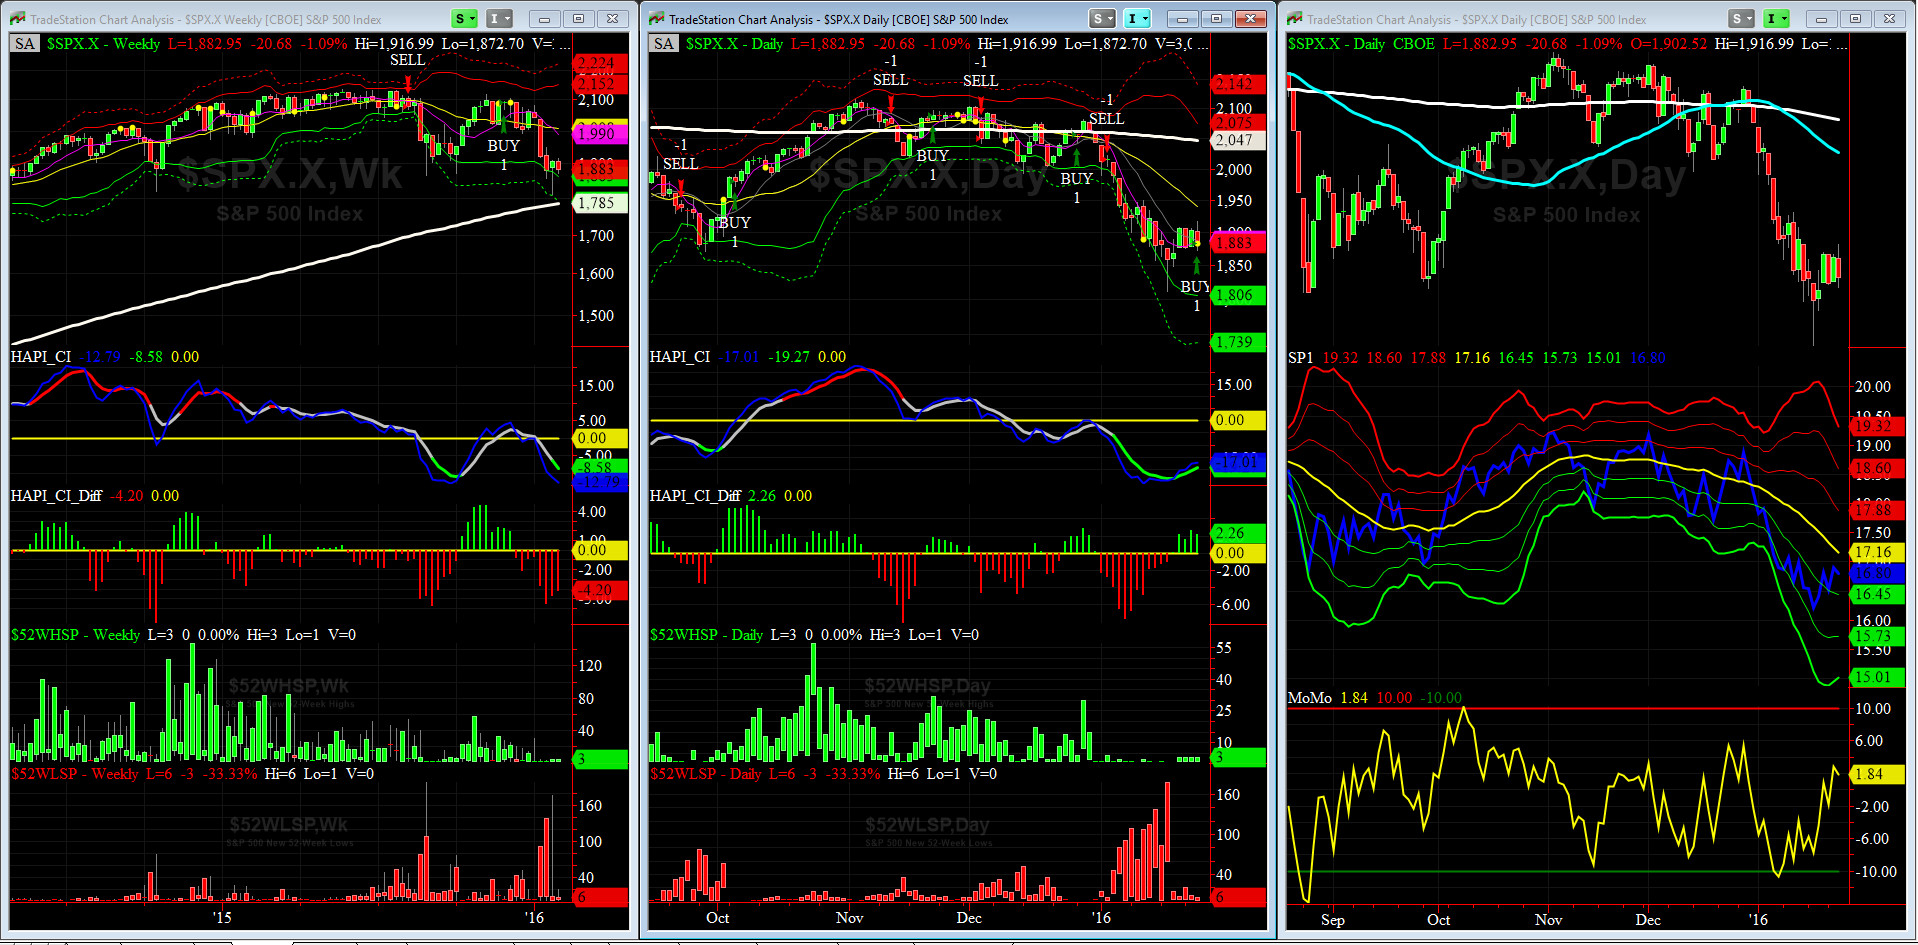
HA_SP1_momo Chart
WEEKLY Timing Model = on a BUY Signal since Friday 11/27/15 CLOSE
DAILY Timing Model = on a SELL Signal since Tuesday 1/05/16 CLOSE
Max SPX 52wk-highs reading last week = 3 (over 120-140, the local maxima is in)
Max SPX 52wk-Lows reading last week = 178 (over 40-60, the local minima is in)
HA_SP1 = above its -1 Sigma
HA_Momo = +0.91 (reversals most likely occur above +10 or below -10)

Vol of the Vols Chart
VIX = 22.3 which is just above its 0 sigma (remember it�s the VIX�s vol pattern (its sigma channels) that matters, and not the level of VIX itself (this is per Dr. Robert Whaley, a great mentor and the inventor of original VIX, now called VXO. VIX usually peaks around a test of its +4 sigma).
This shockwave is over, at least for now, ioho.
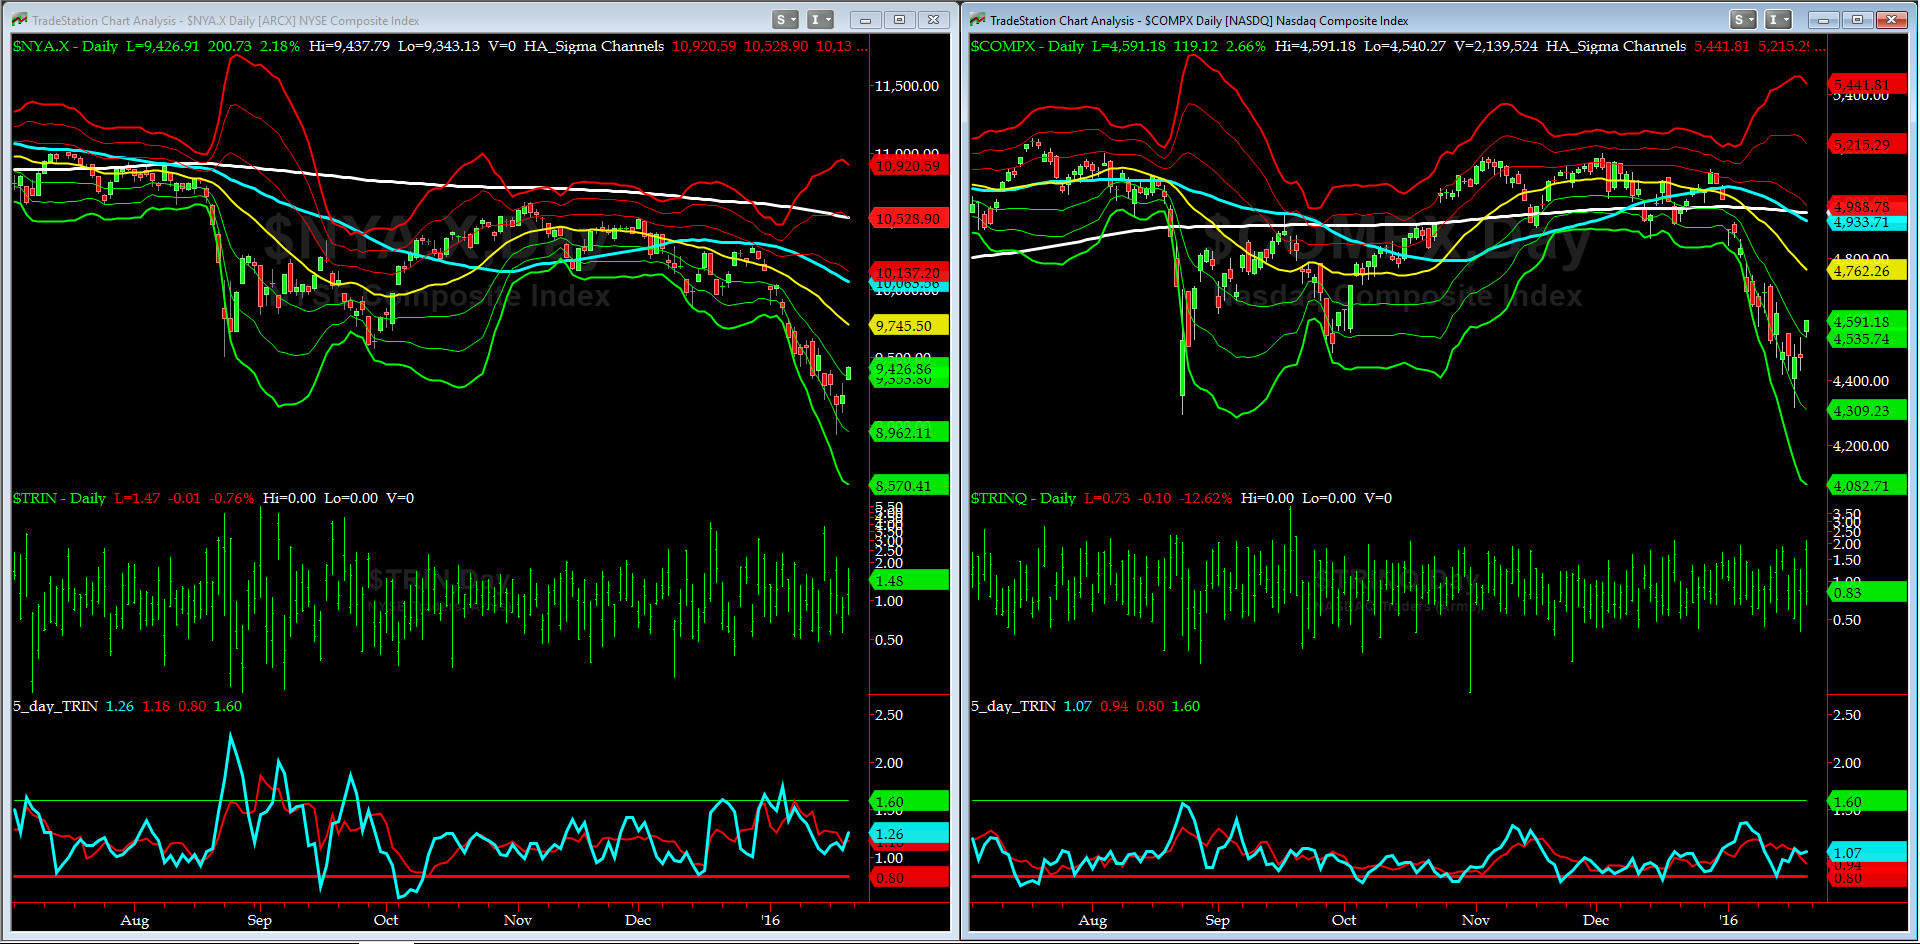
5-day TRIN & TRINQ Charts
Both 5-day TRIN (for NYSE) and 5-day TRINQ (for NASDAQ) are very neutral here.
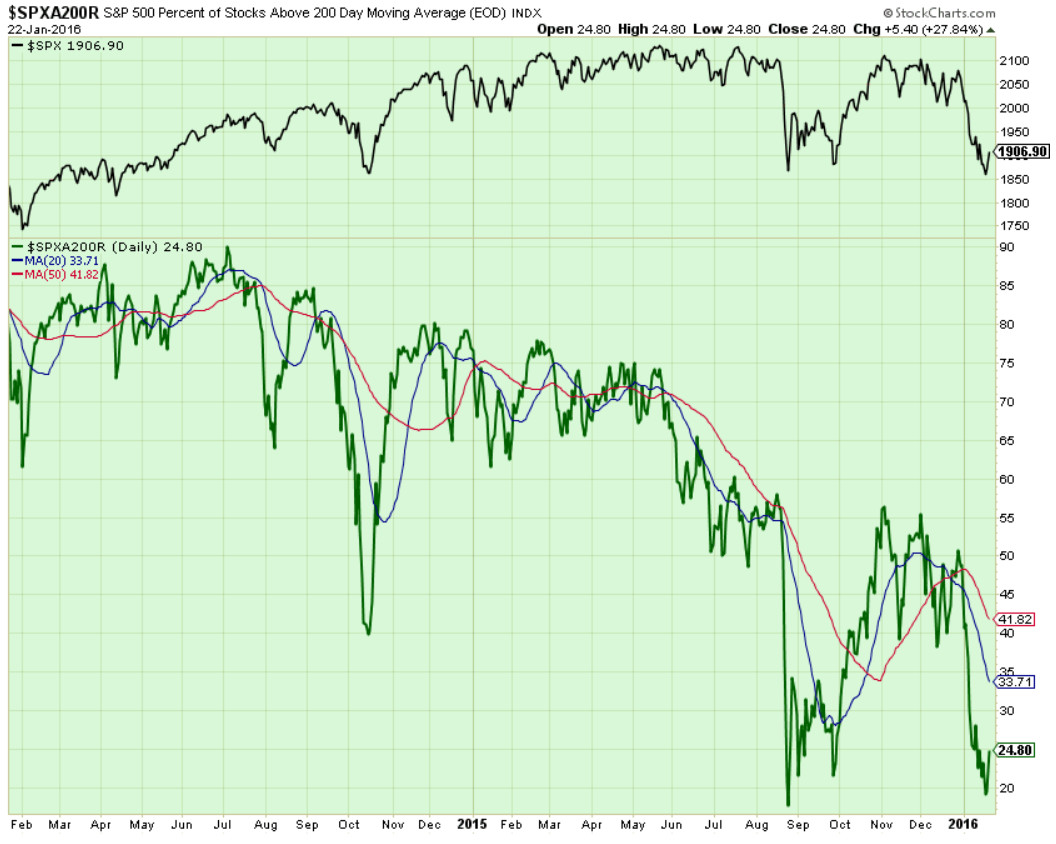
Components of SPX above their respective 200day MA Chart
As anticipated here before, the 20% level was tested on Wednesday and then this scoring indicator rebounded. Next target is the 34-35% zone.
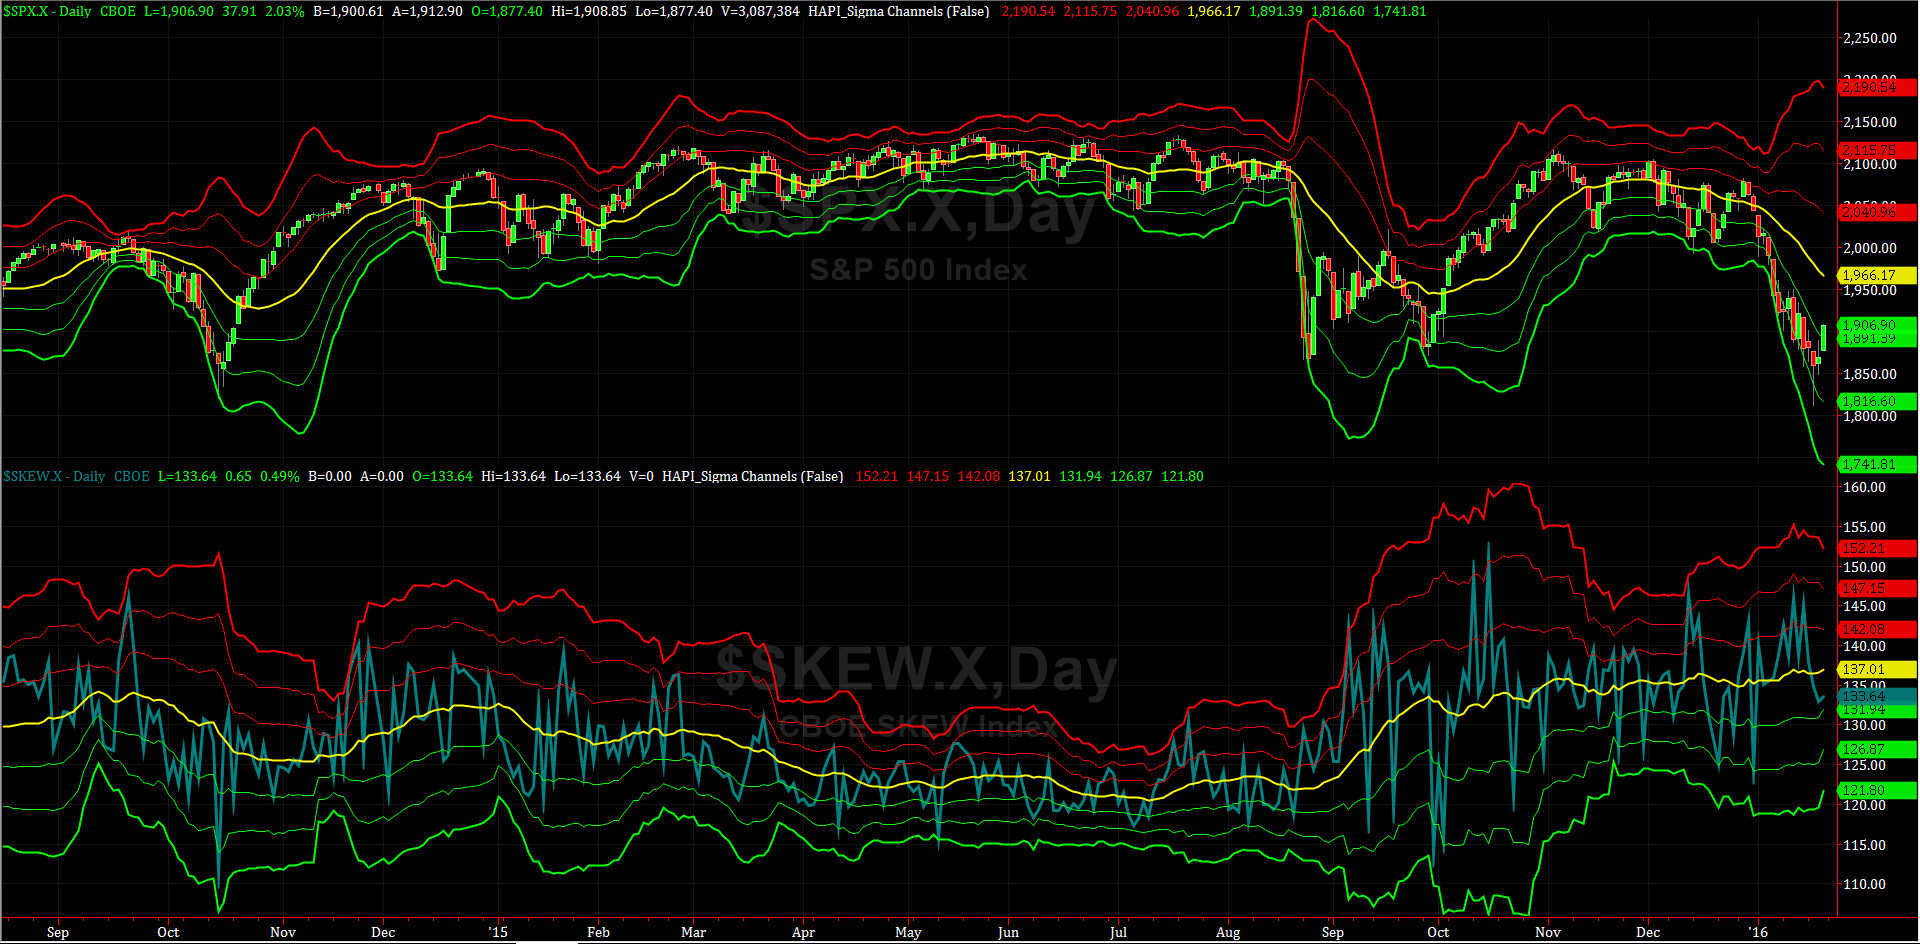
SPX SKEW (Tail Risk) Chart
SPX SKEW (Tail Risk) = 134 is near its -1 sigma (normal = 120-125, range 100-150)
All Quiet on the MidWestern Front?
Yes, until the next shoe drops, ioho.
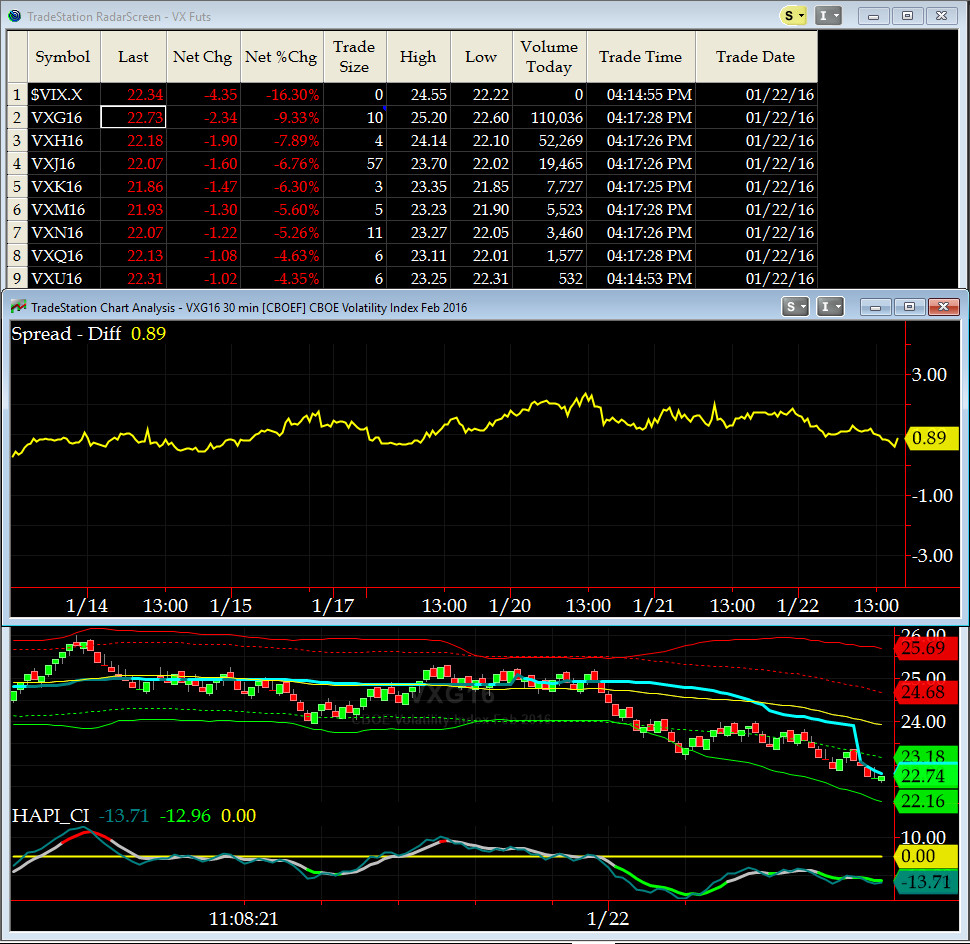
3-month VIX Futures Spread(VX) Chart
Our 3-month VIX Futures Spread (LONG FEB16 SHORT MAY16), was at +2.37 when Wednesday low was put in.
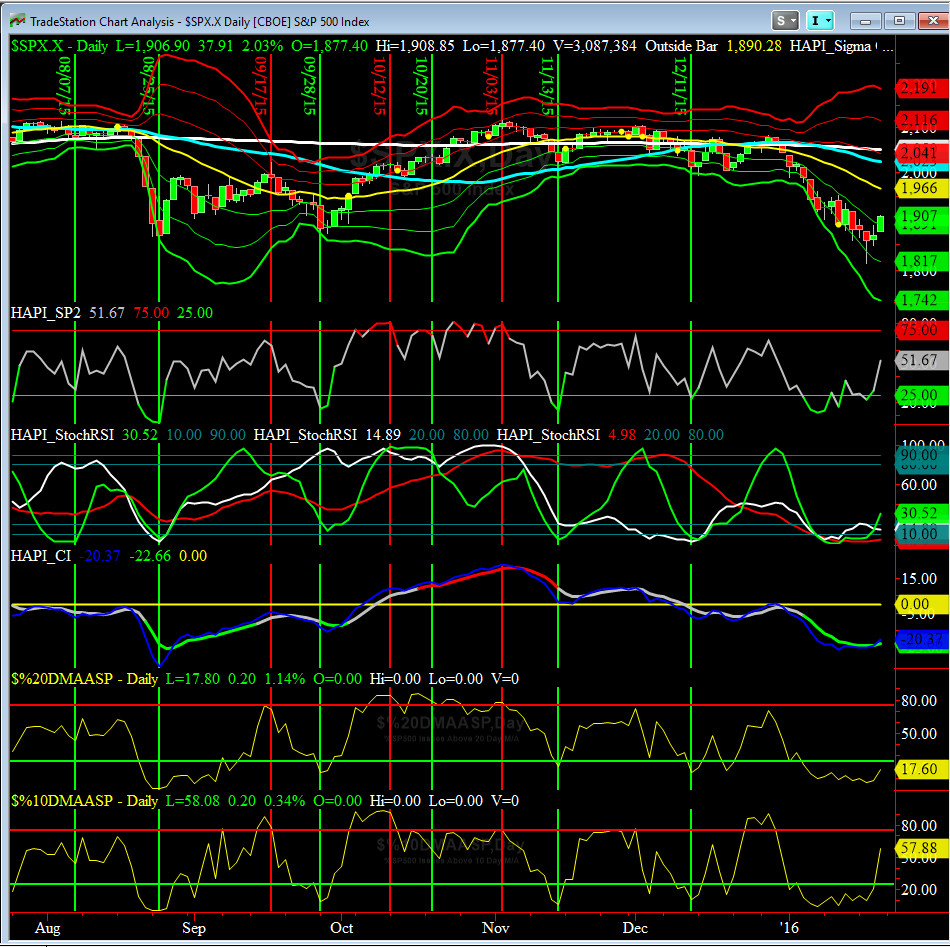
HA_SP2 Chart
HA_SP2 = 51.67 (Buy signal <= 20, Sell Signal >= 80)
At ~52, this prop indicator showed a classic bullish divergence last Wednesday. Worth noting on this chart is that the very short-term HAPI StockRSI has started an upward move.
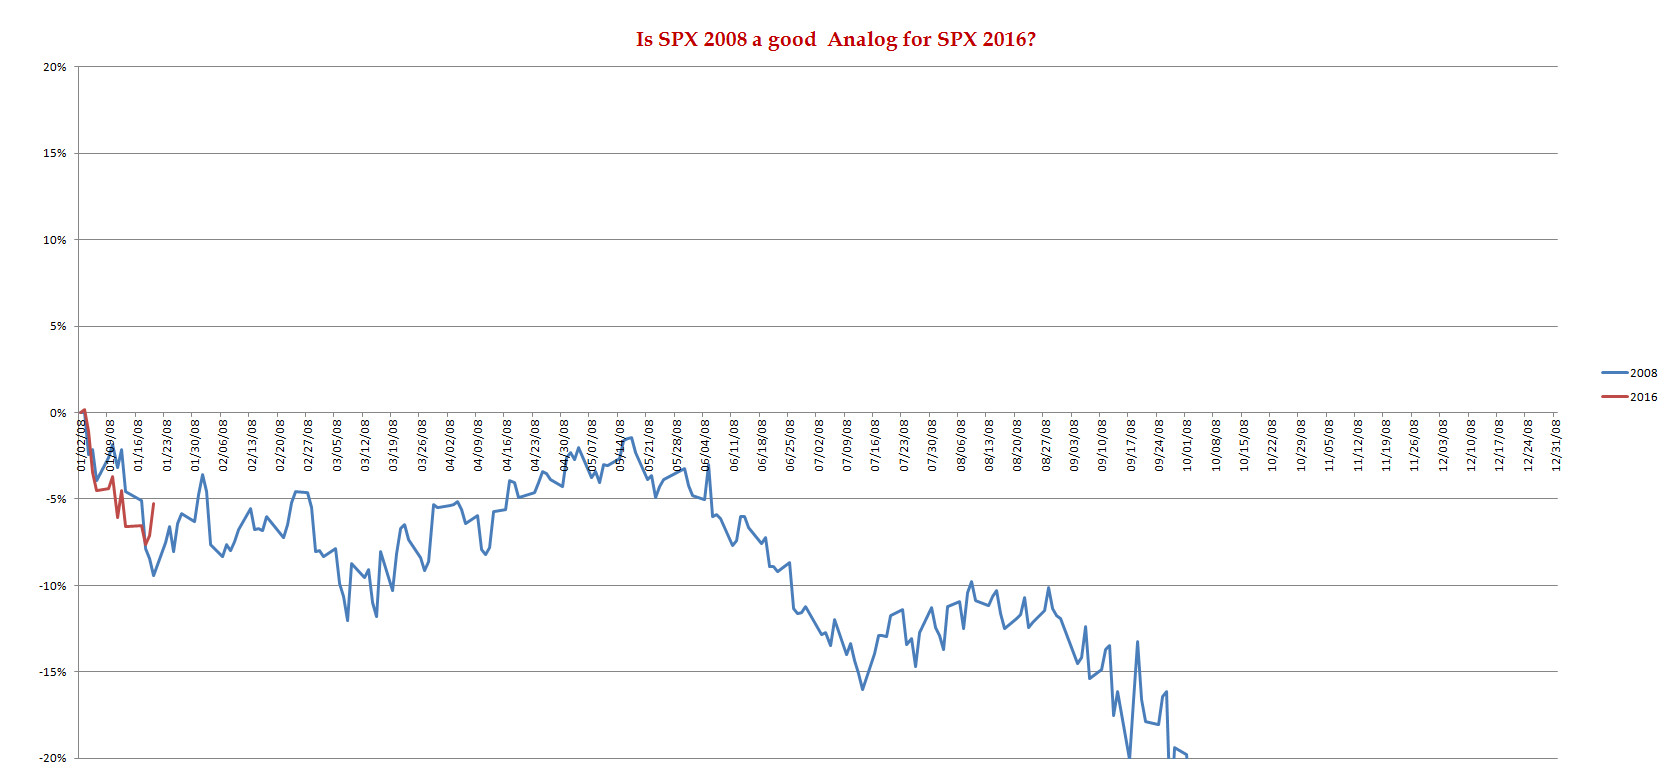
SPX 2008 Analog for SPX 2016
FWIW, my co-pilot, @Capt_Tiko (now with over 240 Twitter Followers) is anxiously following a track using 2008. I may have to step in and provide some guidance and counsel.
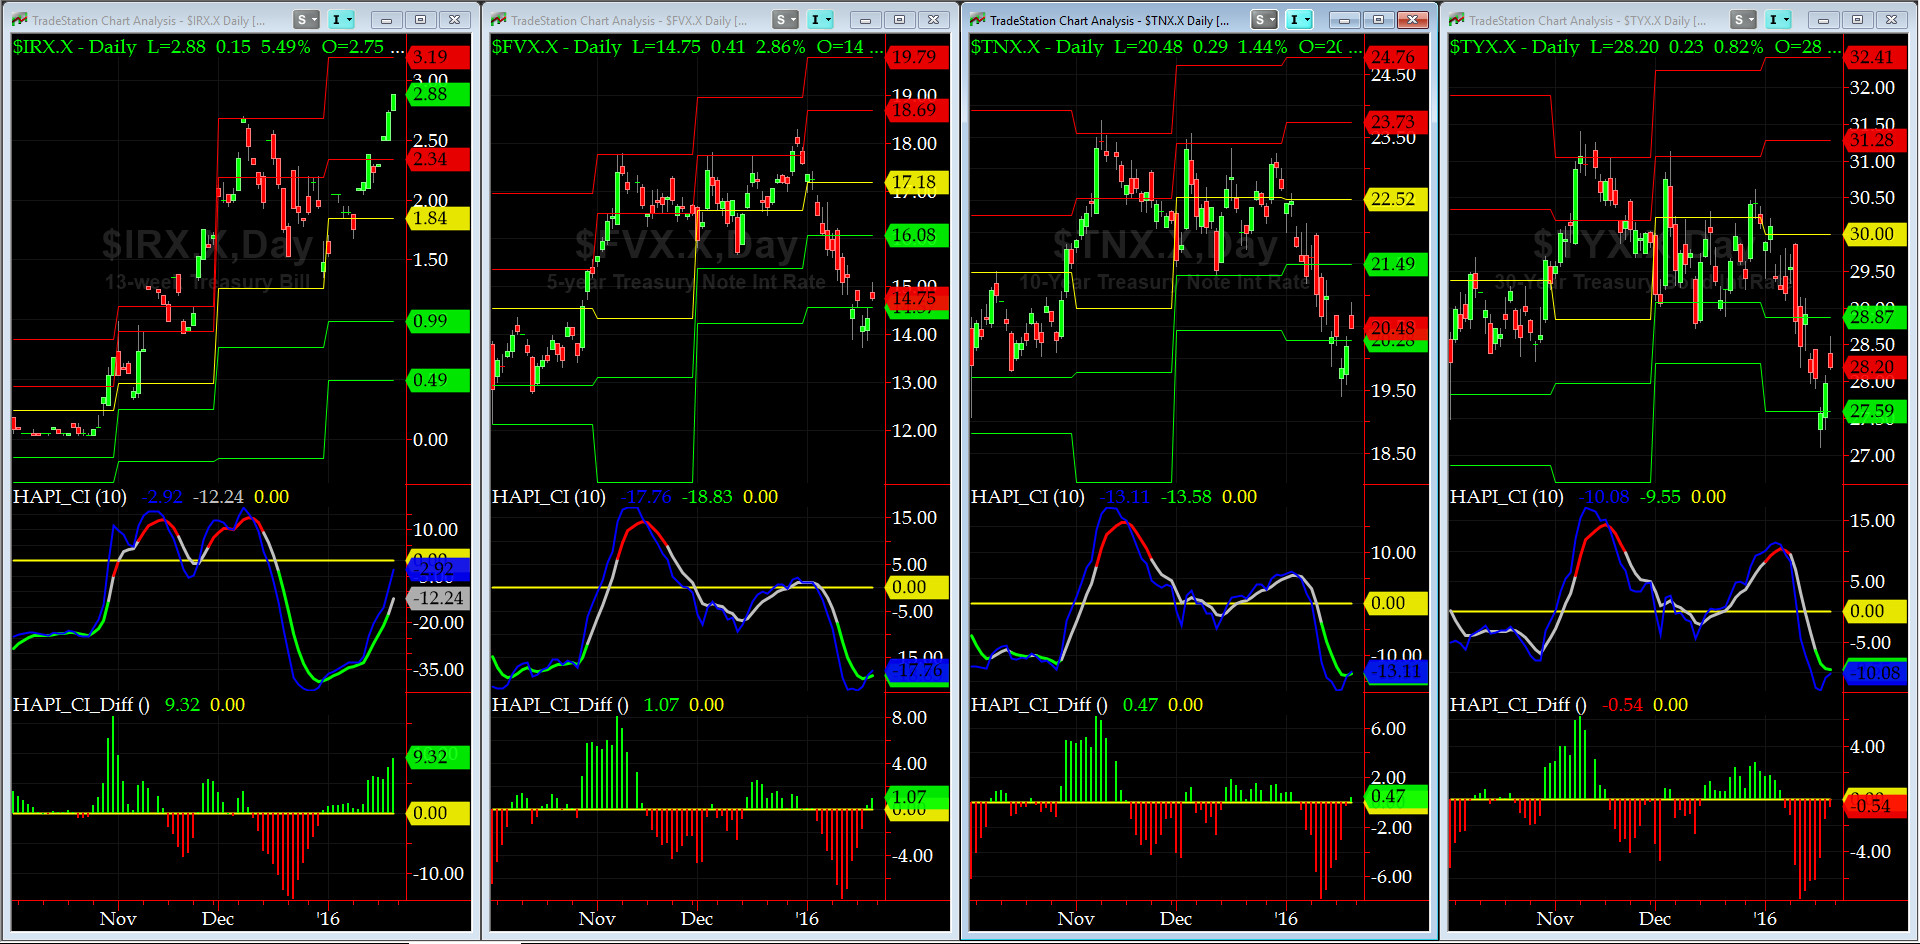
US Treasury T-Notes & T-Bonds Yields Chart
Treasury Complex Yields snapped up starting mid-Wednesday, again confirming the funds flowing back into equities.
Good luck this week,
Fari Hamzei
|


 Proactive Market Timing