
|
 |
 |
 |
 |
 |
 |
 |
 |
 Proactive Market Timing Proactive Market Timing
|
|
|
Most Recent PMT vs SPX Performance Chart

|
|
|
|
Wednesday, February 3, 2016, 2330ET
Updated Market Bias for Issue #129
This WEEK�s Bias = LONG SPX or SPY via Call Spreads
Profit Target = 1950 to 1970
Money Management Stop = 1900
BOTTOM LINE: SPX 1870 was Line-in-the-Sand. Plain and Simple. It was defended with an overwhelming force (as if it was scripted by Gen. Colin Powell) and no prisoners were taken by the Victor.
Note: Once one the targets is hit (Profit or Money Management), the trade for that week is over. Go to Cash and wait for the next PMT Issue.
Fari Hamzei
|
|
|
|
|
|
Wednesday, February 3, 2016, 2311ET
Notice of Change of Market Bias with Timer Digest
Dear Jim,
As a scuba diver, I learned long ago, that the Ocean will always win over me. In like fashion, today as SPX approached 1870, the Invisible Hand came in & voraciously bought the Market hand over fist.
Market is very much like an Ocean. We can not win, in a match with the Market either.
Therefore, we, hereby reverse up our SHORT SPX position and get LONG. Better keep our ammo dry and save it to fight another battle [to the downside] later.
This puts us back about 9 S&P handles��oh, well.
Fari Hamzei
|
|
|
|
|
|
Tuesday, February 2, 2016, 2345ET
Updated Market Bias for Issue #129
This WEEK�s Bias = SHORT SPX or SPY via Put Spreads
Profit Target = 1875 to 1835
Money Management Stop = 1915
BOTTOM LINE: As suspected here last Sunday, the jubilation following the Bank of Japan�s unexpected move into negative interest rates last Friday, was squashed today, with lower crude oil prices, credit rating downgrades by S&P of 10 largest energy names and sell-off in banks & biotech.
Our most worry is the continued drop in the price of WTI Crude Oil and expanding CDSs of a few large European Banks.
Note: Once one the targets is hit (Profit or Money Management), the trade for that week is over. Go to Cash and wait for the next PMT Issue.
Fari Hamzei
|
|
|
|
|
|
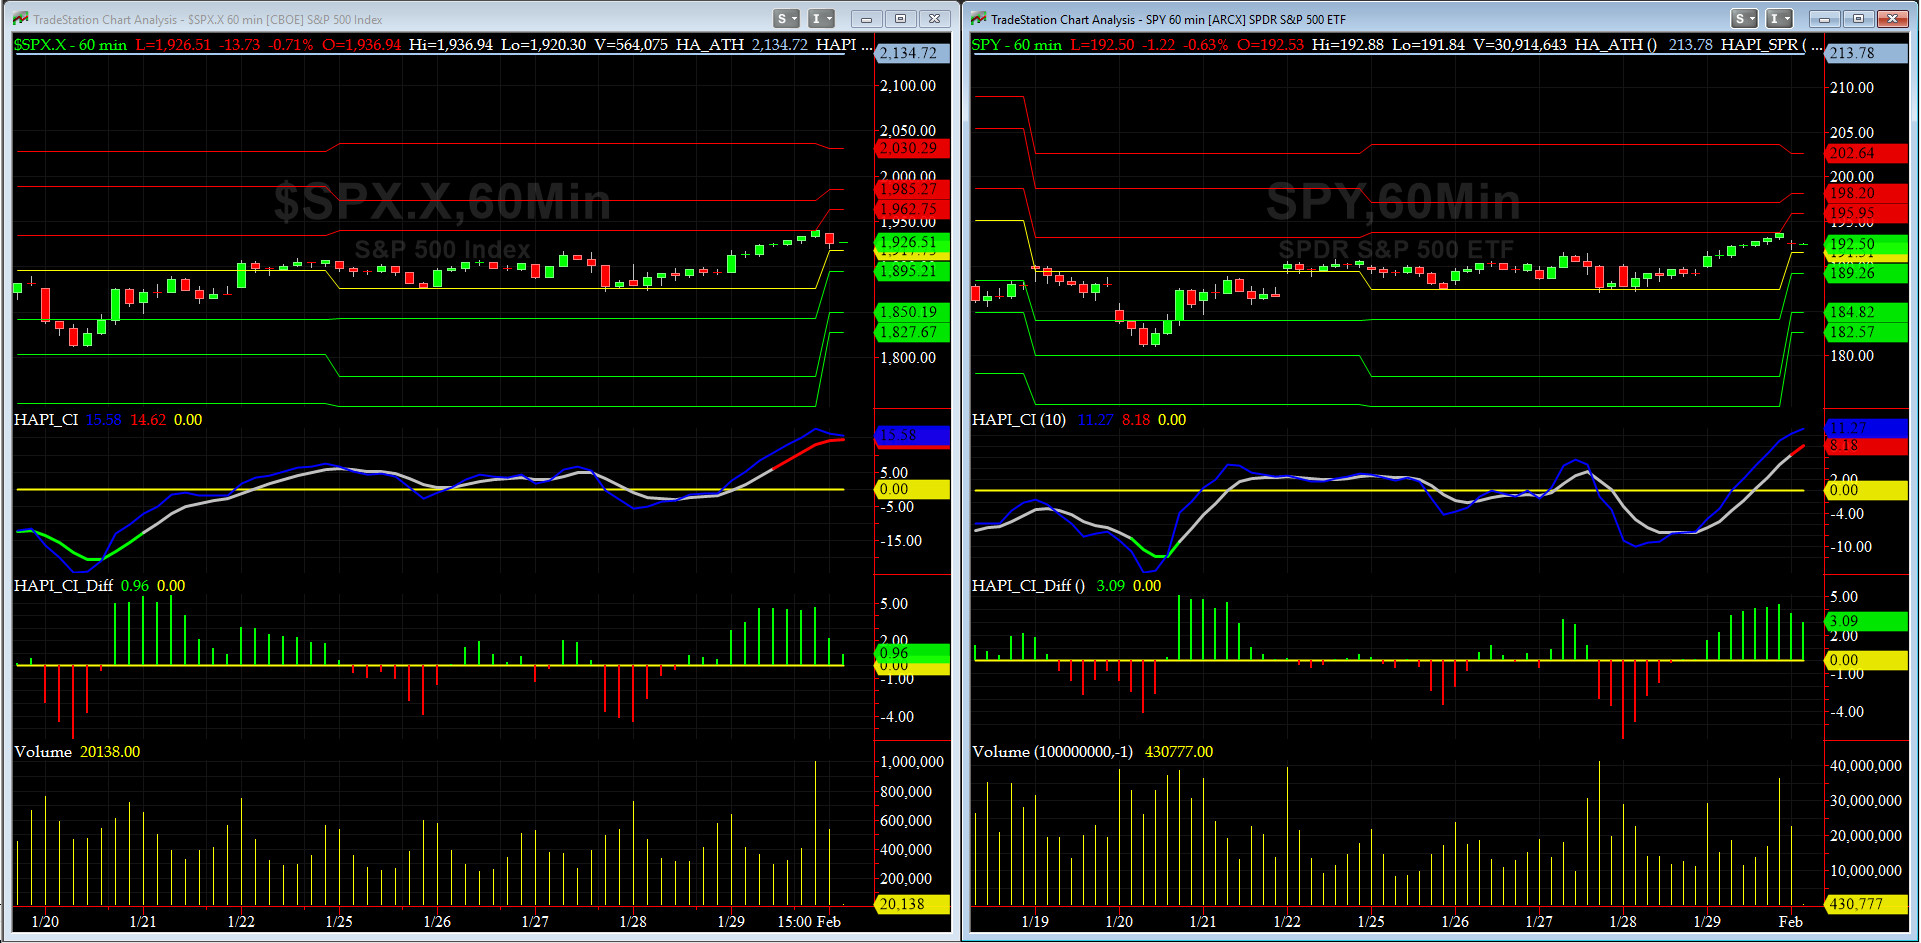
Monday, February 1, 2016, 1045ET
Companion Chart for Market Bias Review, Issue #129
|
|
|
|
|
|
Sunday, January 31, 2016, 2100ET
Market Bias, Issue #129
Our current SPX Bias with Timer Digest: SHORT SPX as of Tuesday, January 26, 2016 Close at 1903.63
Our previous Bias: LONG SPX (as of Wednesday, January 20, 2016 Close at 1859.33)
This WEEK�s Bias = NEUTRAL for a day or two then we take a [short] position
Profit Target = N/A
Money Management Stop = N/A
BOTTOM LINE: Bank of Japan�s unexpected move on Friday to lower a key interest rate below zero is viewed, by some, as a sign that the program of radical economic stimulus, introduced by Prime Minister Shinzo Abe in 2013, just isn't working.
Markets' initial response was positive: Nikkei closed up 2.8% and SPX up 2.5%.
We would rather step back and see if there is a follow thru. We suspect NOT, but only price & volume are a good tell. Have more Foumanat Tea for now.
We will review each evening and update as warranted.
NOTE: All LEVELS mentioned here have been, are, and will be, based on the S&P-500 SPX Cash Index, and not the ES Futures. Tomorrow after the first hour is complete, we will post here a companion chart showing critical short-term WEEKLY levels to watch for possible �retest failures.�
Also Note: Once one the targets is hit (Profit or Money Management), the trade for that week is over. Go to Cash and wait for the next PMT Issue.
Fari Hamzei
|
|
|
|
|
|
Sunday, January 31, 2016 1800ET
Market Timing Charts, Analysis & Commentary for Issue #129
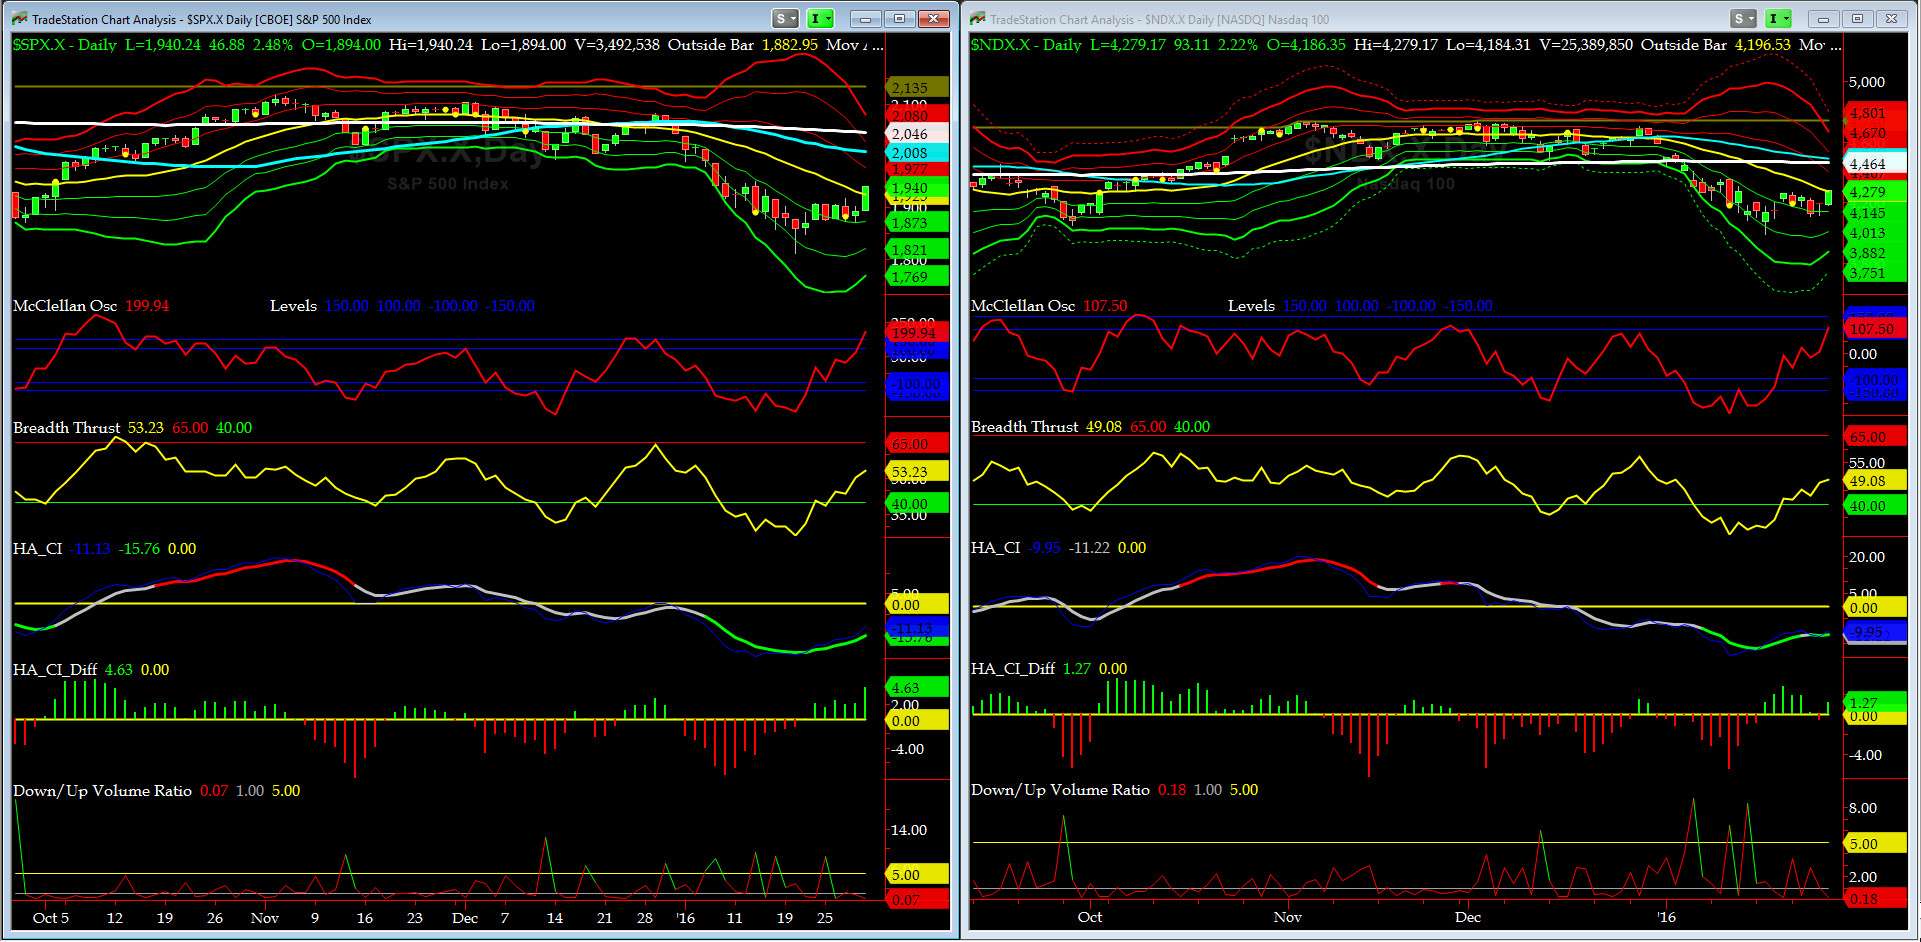
Timer Charts of S&P-500 Cash Index (SPX) + NASDAQ-100 Cash Index (NDX)
Most recent S&P-500 Cash Index (SPX): 1940.24 up +34.34 (up +1.8%) for the week ending on Friday, January 29th, 2016, which closed above its zero sigma.
SPX ALL TIME INTRADAY HIGH = 2134.72 (reached on Wednesday, May 20th, 2015)
SPX ALL TIME CLOSING HIGH = 2130.82 (reached on Thursday, May 21st, 2015)
Current DAILY +2 Sigma SPX = 2028 with WEEKLY +2 Sigma = 2147
Current DAILY 0 Sigma (20 day MA) SPX = 1925 with WEEKLY 0 Sigma = 2010
Current DAILY -2 Sigma SPX = 1821 with WEEKLY -2 Sigma = 1874
NYSE McClellan Oscillator = +200 (-150 is start of the O/S area; around -275 to -300 area or lower, we go into the �launch-pad� mode, over +150, we are in O/B area)
NYSE Breadth Thrust = 53.23 (40 is considered as oversold and 65 as overbought)
We had a great bounce on Friday which surprised us. Are we over-extended? Not yet but we should be close. End of the Month BUYS + some anticipation of fresh cash coming in from pending M&A activity managed to register one largest MOC data we have seen in months, if not in years ($4.4 Bils).
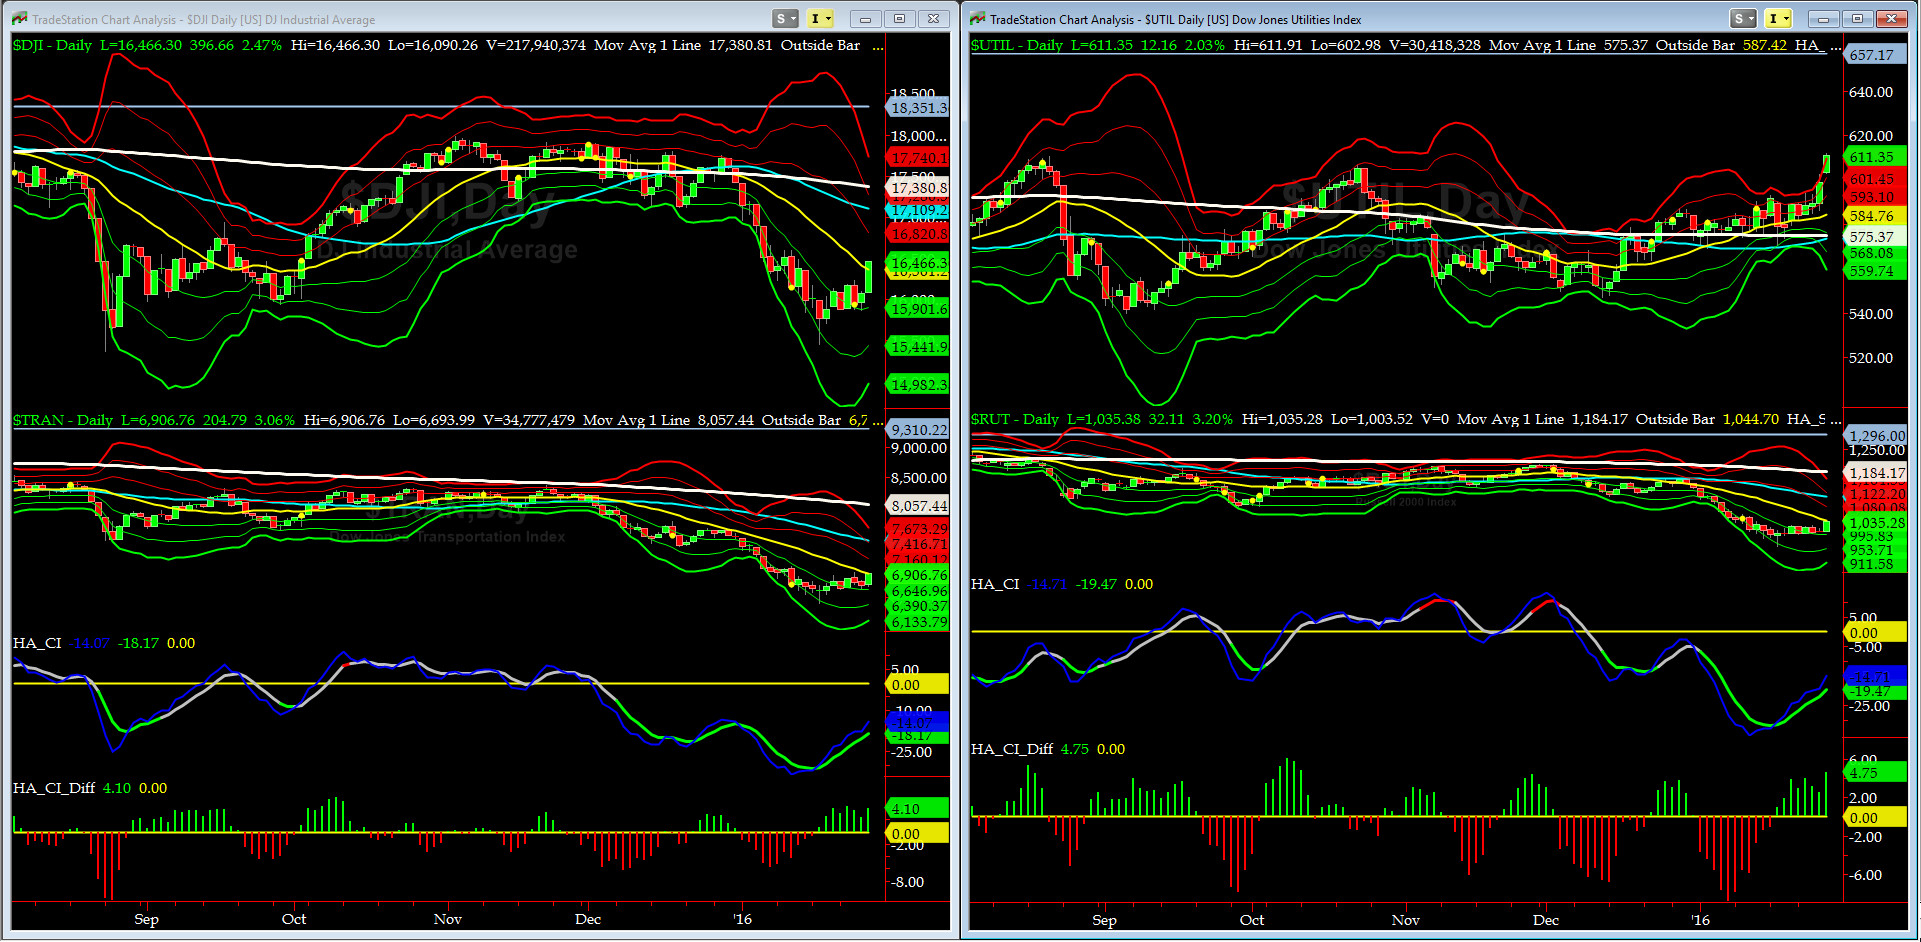
Canaries [in the Coal Mine] Chart for DJ TRAN & RUT Indices
200-Day MA DJ TRAN = 7455 or -14.3% above DJ TRAN (max observed in last 5 yrs = 20.2%, min = -20.3%)
200-Day MA RUT = 1111 or -12.6% above RUT (max observed in last 5 yrs = 21.3%, min = -22.6%)
Both DJ Transports (proxy for economic conditions 6 to 9 months hence) & Russell 2000 Small Caps (proxy for RISK ON/OFF) edged up this past week but not a hard bounce like SPX. We read that as negative tell!!
We still maintain that a key retest failure is ahead and we need to keep our guards up.
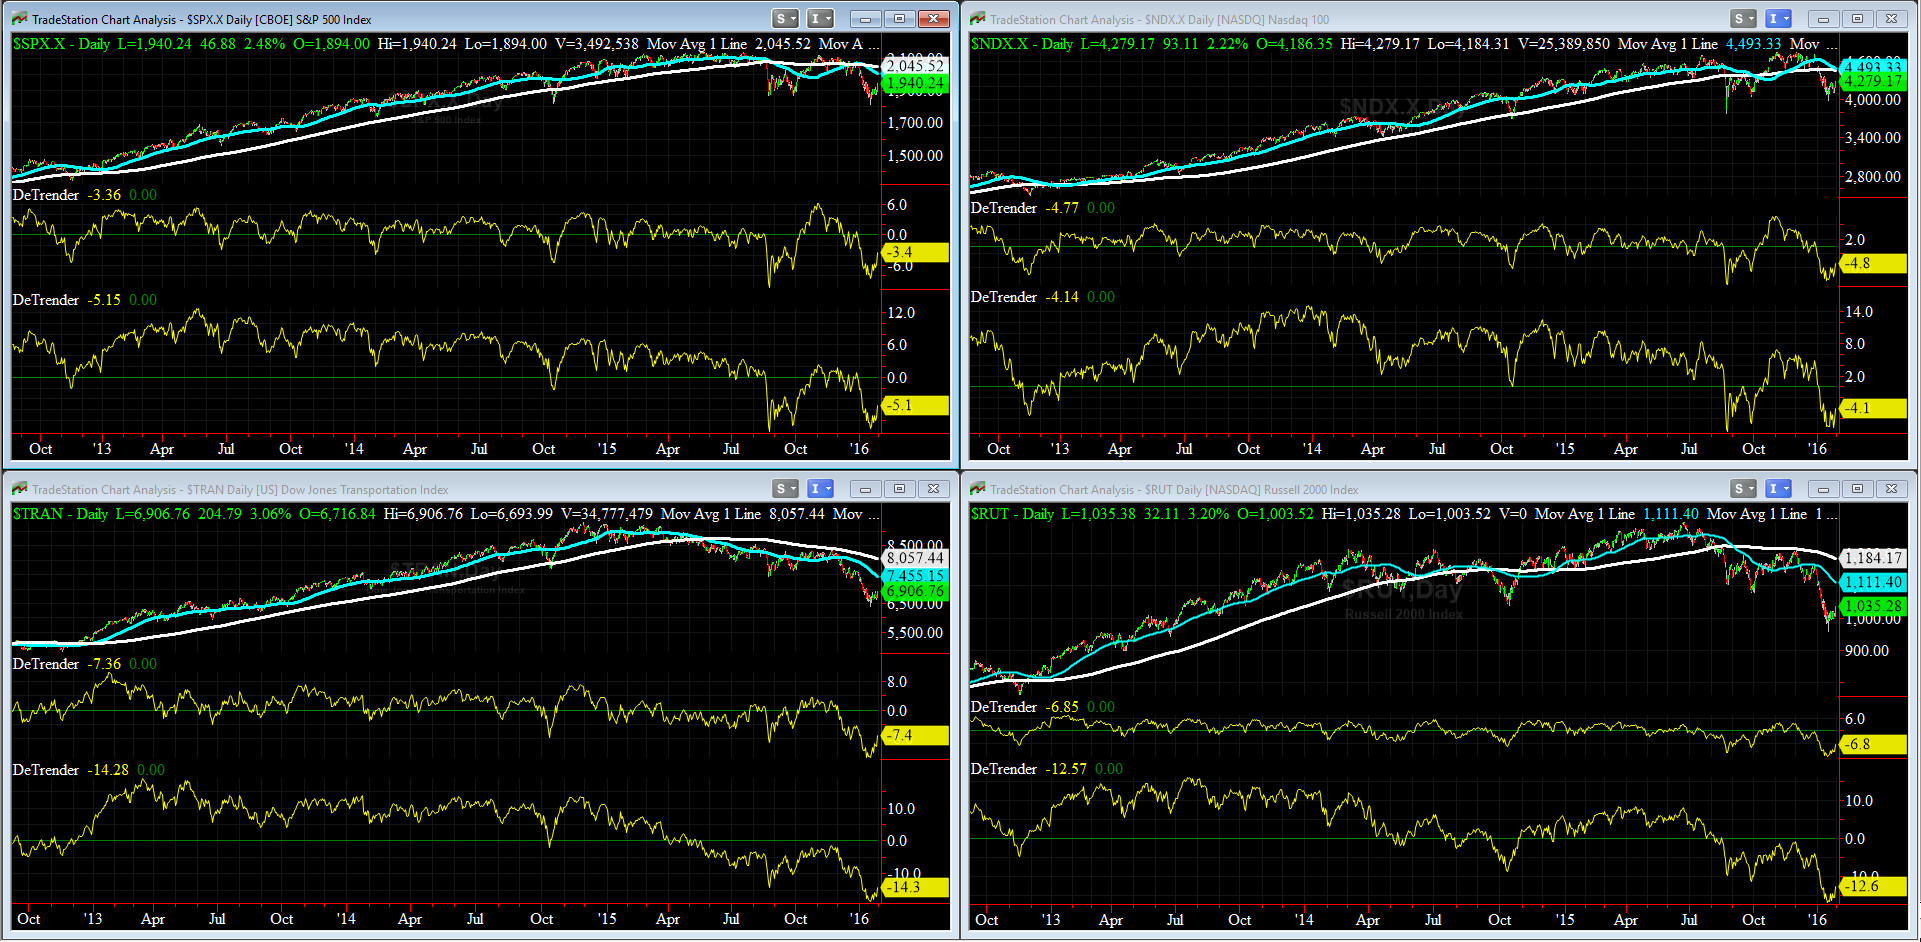
DeTrenders Charts for SPX, NDX, TRAN & RUT Indices
50-Day MA SPX =2008 or -3.4% above SPX (max observed in last 5 yrs = +8.6%, min = -9.3% )
200-Day MA SPX = 2046 or -5.1% above SPX (max observed in last 5 yrs = 15.2%, min = -14%)
All of our Eight DeTrenders are still negative but now they are all reversed up.
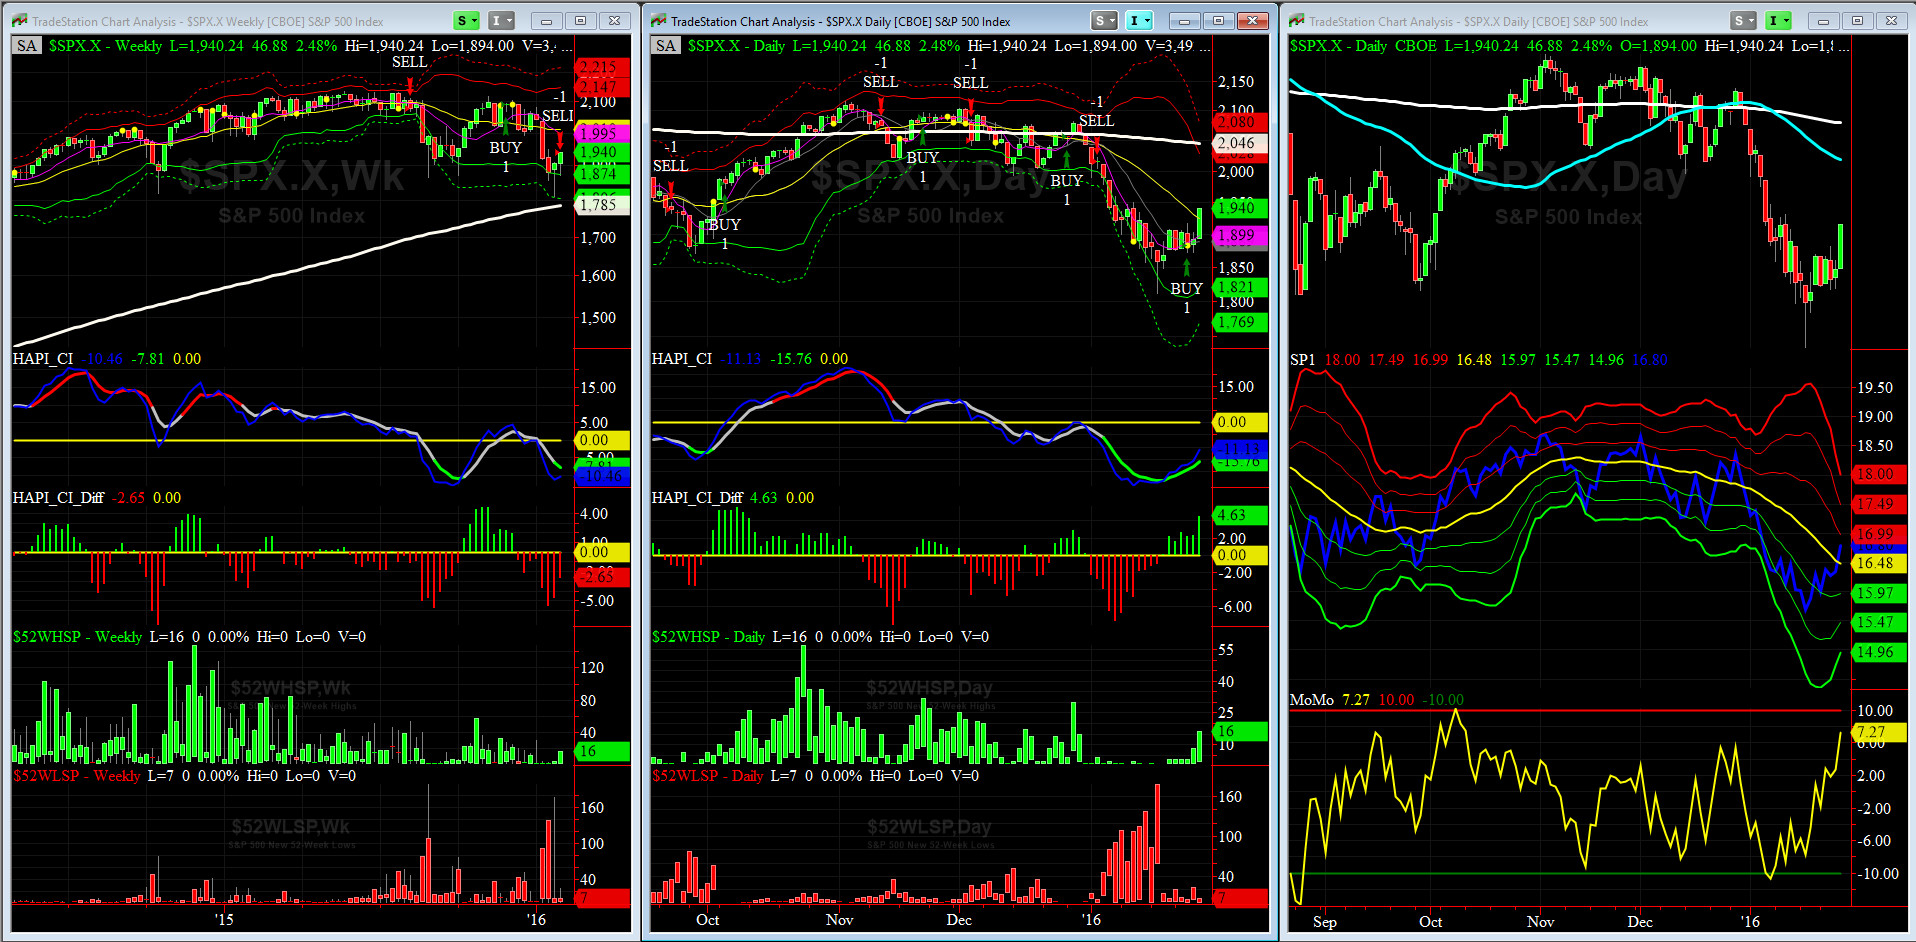
HA_SP1_momo Chart
WEEKLY Timing Model = on a SELL Signal since Friday 1/29/16 CLOSE
DAILY Timing Model = on a BUY Signal since Tuesday 1/27/16 CLOSE
Max SPX 52wk-highs reading last week = 16 (over 120-140, the local maxima is in)
Max SPX 52wk-Lows reading last week = 24 (over 40-60, the local minima is in)
HA_SP1 = just below its +1 Sigma
HA_Momo = +7.27 (reversals most likely occur above +10 or below -10)
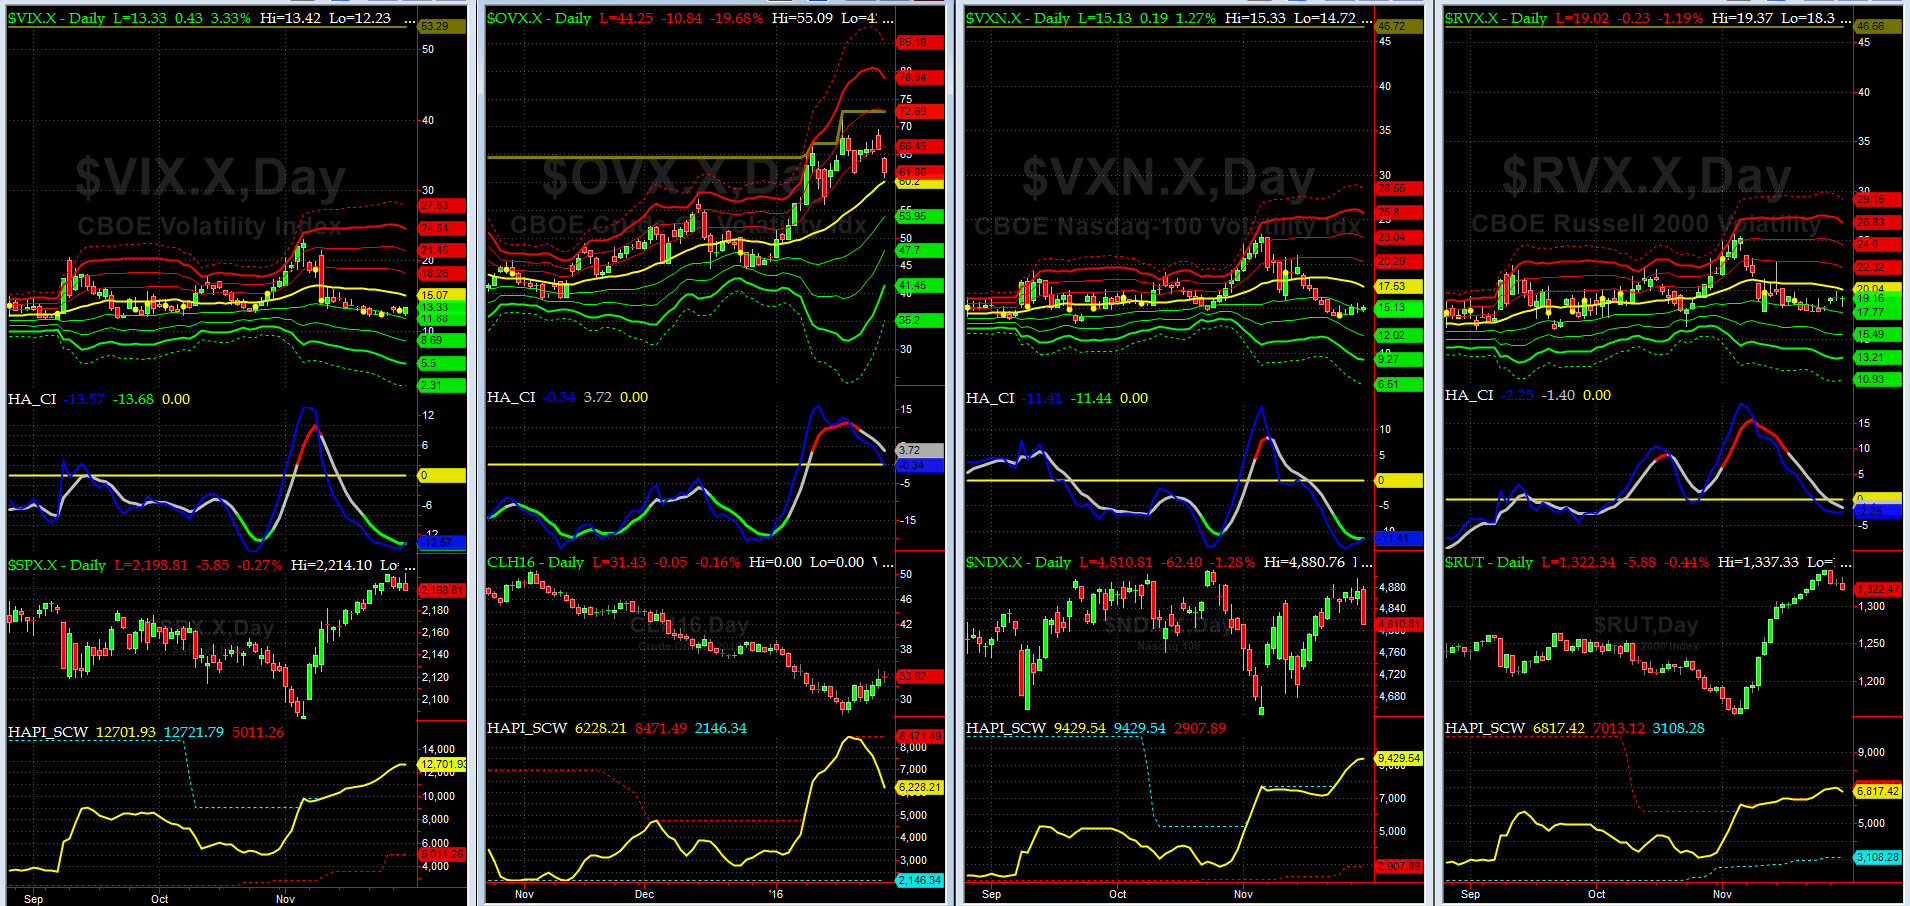
Vol of the Vols Chart
VIX = 20.20 which is just below its -1 sigma (remember it�s the VIX�s vol pattern (its sigma channels) that matters, and not the level of VIX itself (this is per Dr. Robert Whaley, a great mentor and the inventor of original VIX, now called VXO. VIX usually peaks around a test of its +4 sigma).
This shockwave is over, at least for now, ioho, till the next shoe drops.
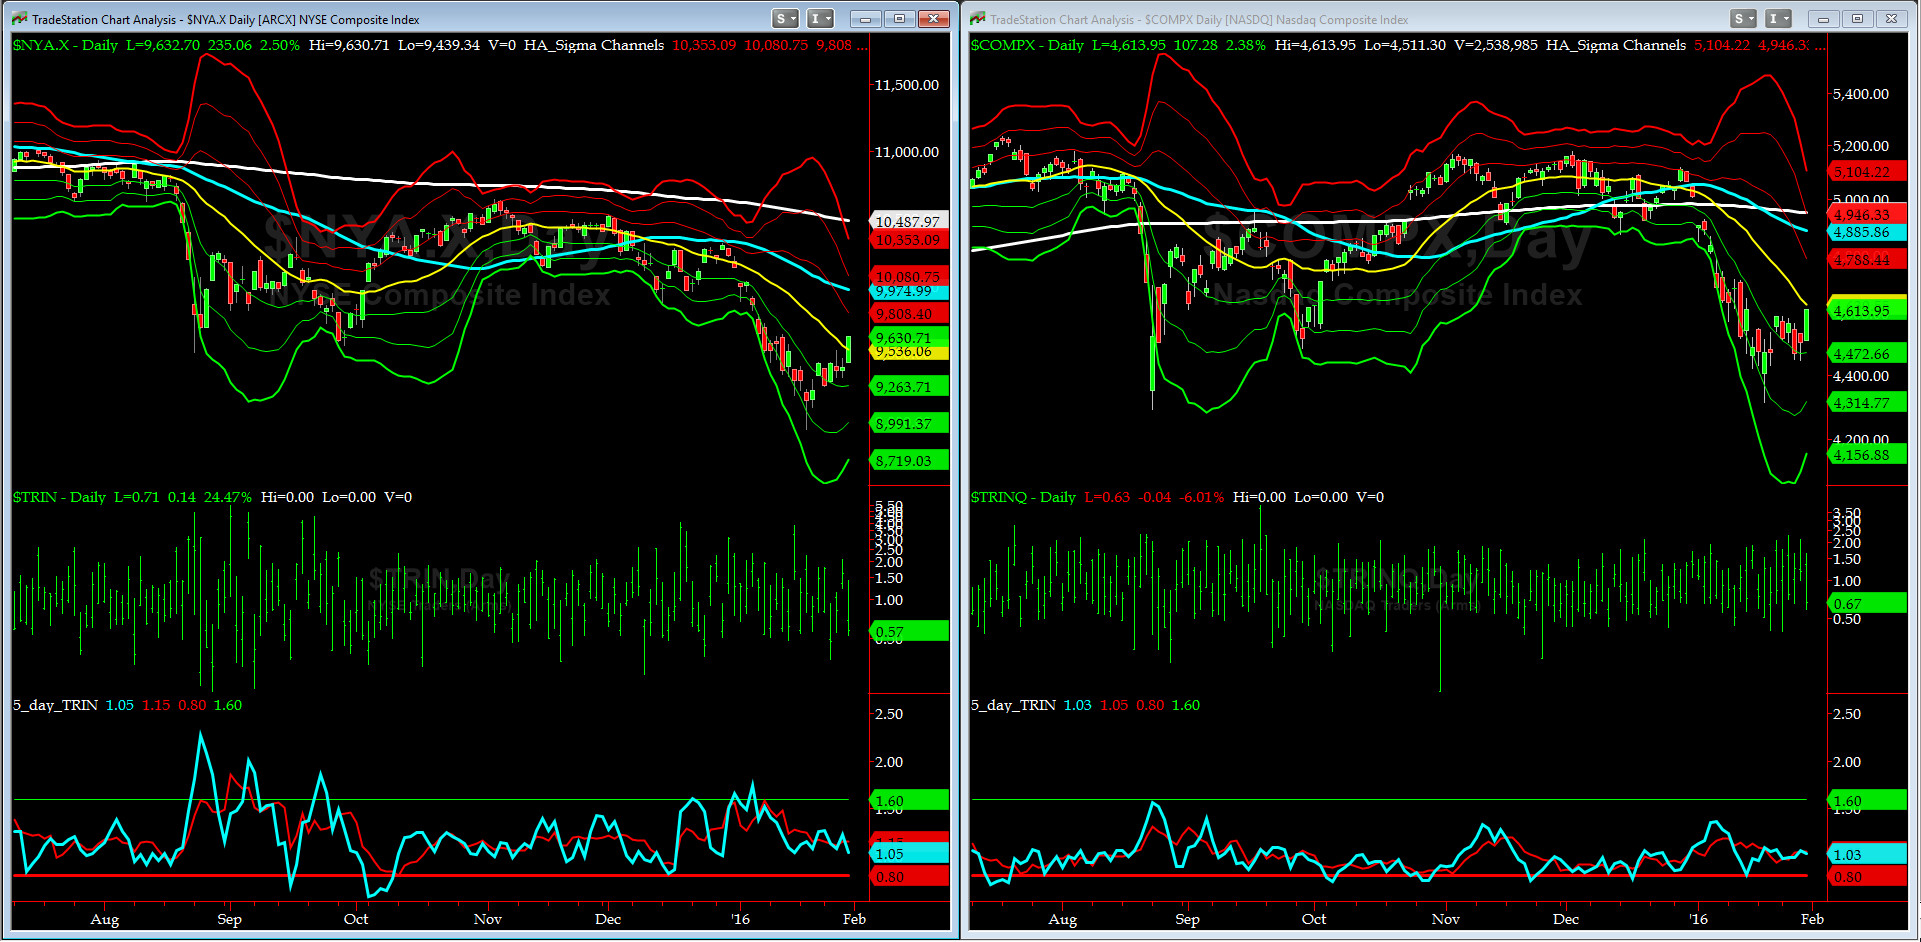
5-day TRIN & TRINQ Charts
Both 5-day TRIN (for NYSE) and 5-day TRINQ (for NASDAQ) closed, again, very neutral this past Friday.
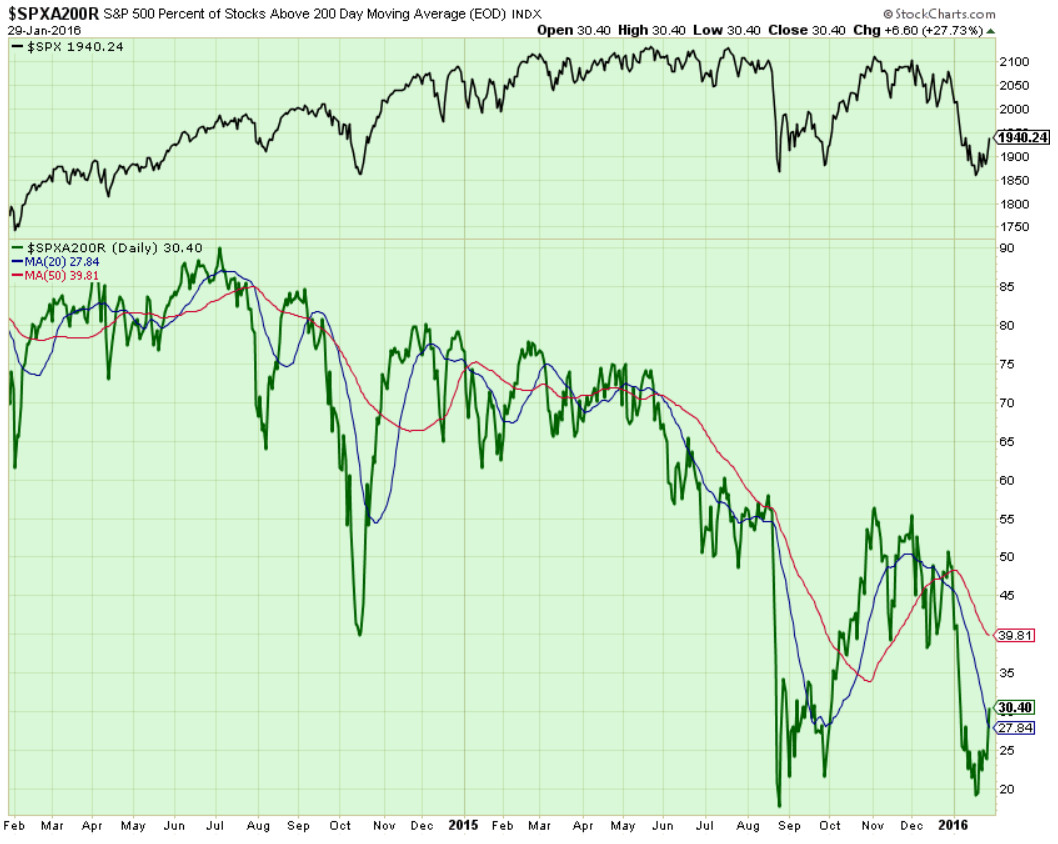
Components of SPX above their respective 200day MA Chart
The 30% level was tested last Friday but the real target still is the 34-35% zone.
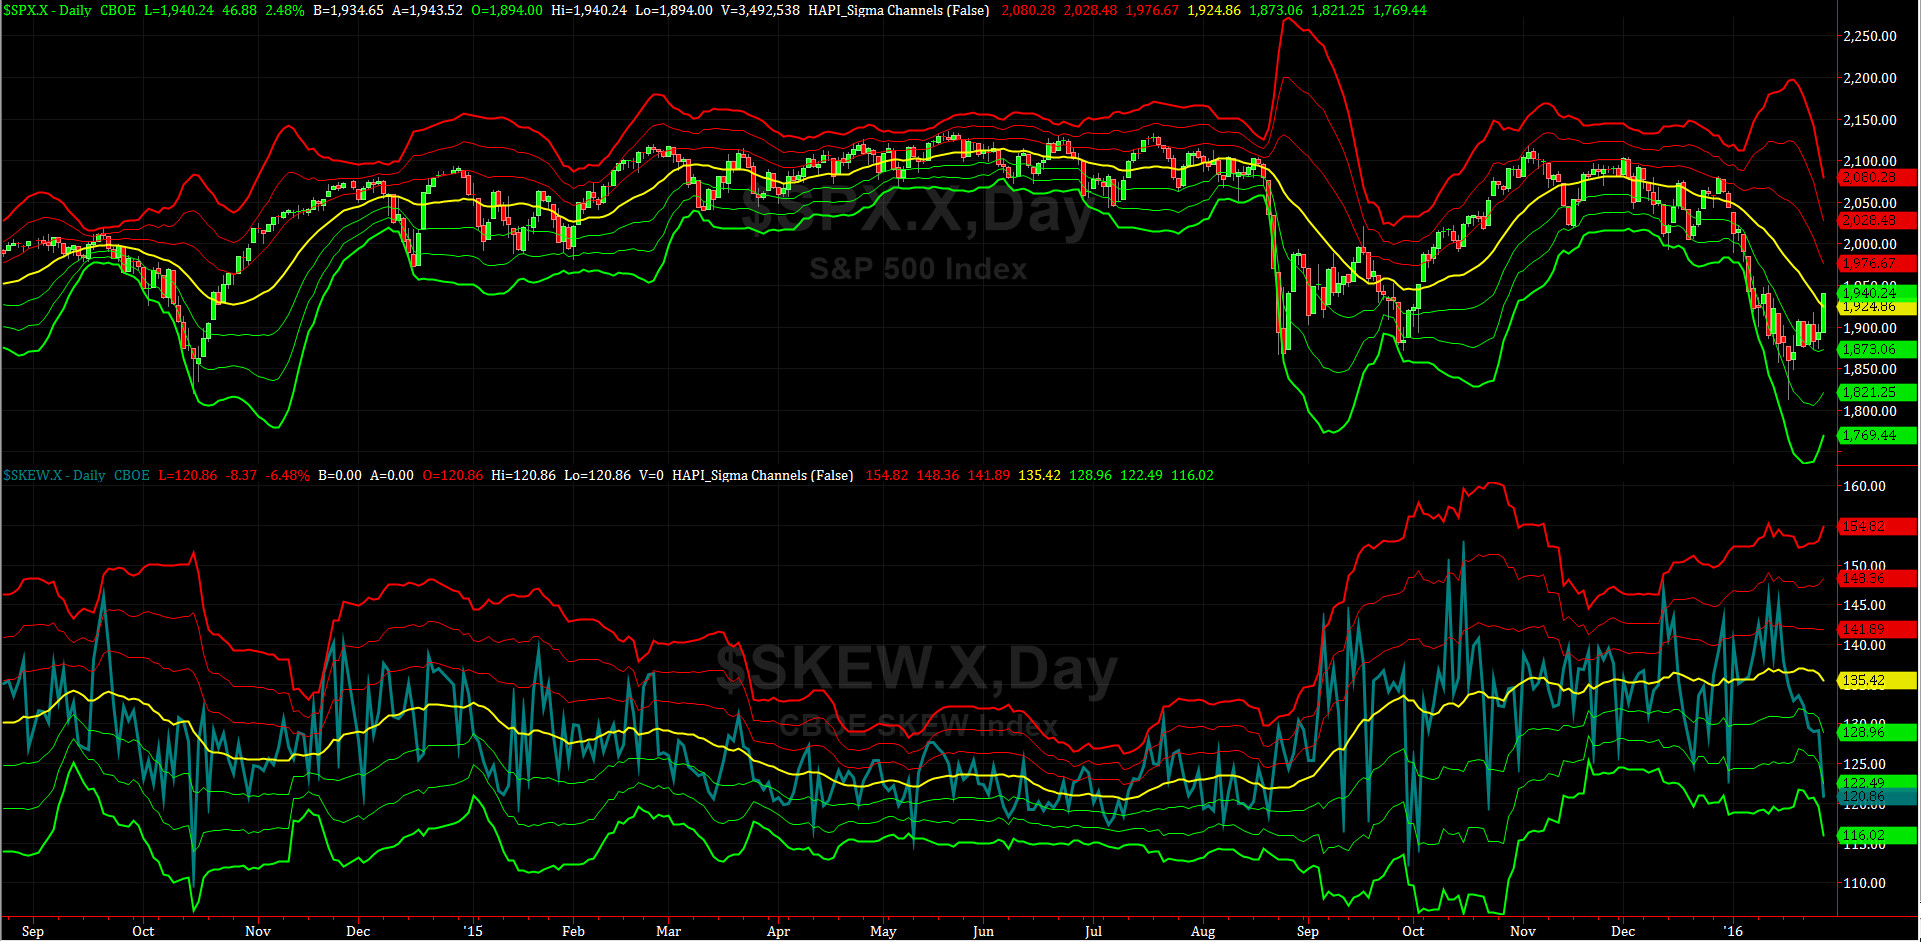
SPX SKEW (Tail Risk) Chart
SPX SKEW (Tail Risk) = 120.86 is below its -2 sigma (normal = 120-125, range 100-150)
All Quiet on the MidWestern Front?
Yes, ALL VERY CALM & QUIET until the next perfect storm hits, ioho.
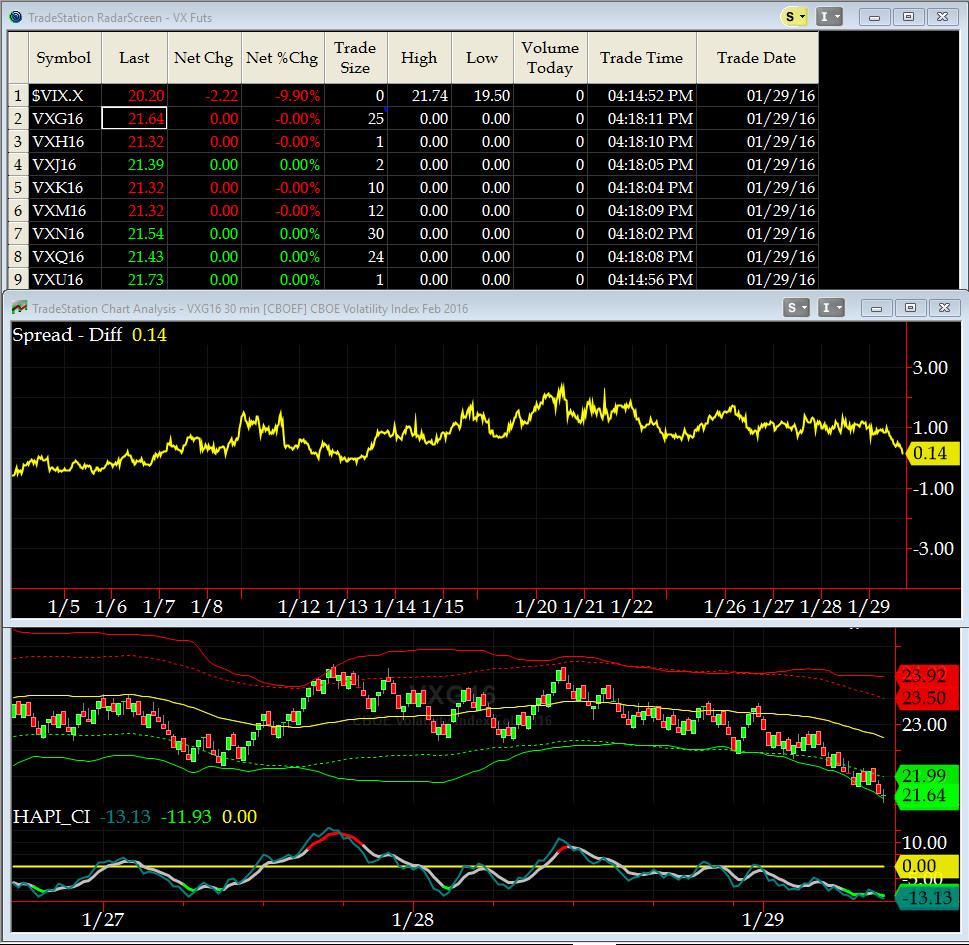
3-month VIX Futures Spread(VX) Chart
Our 3-month VIX Futures Spread (LONG FEB16 SHORT MAY16), closed Friday at +0.14. That's neutral for now.
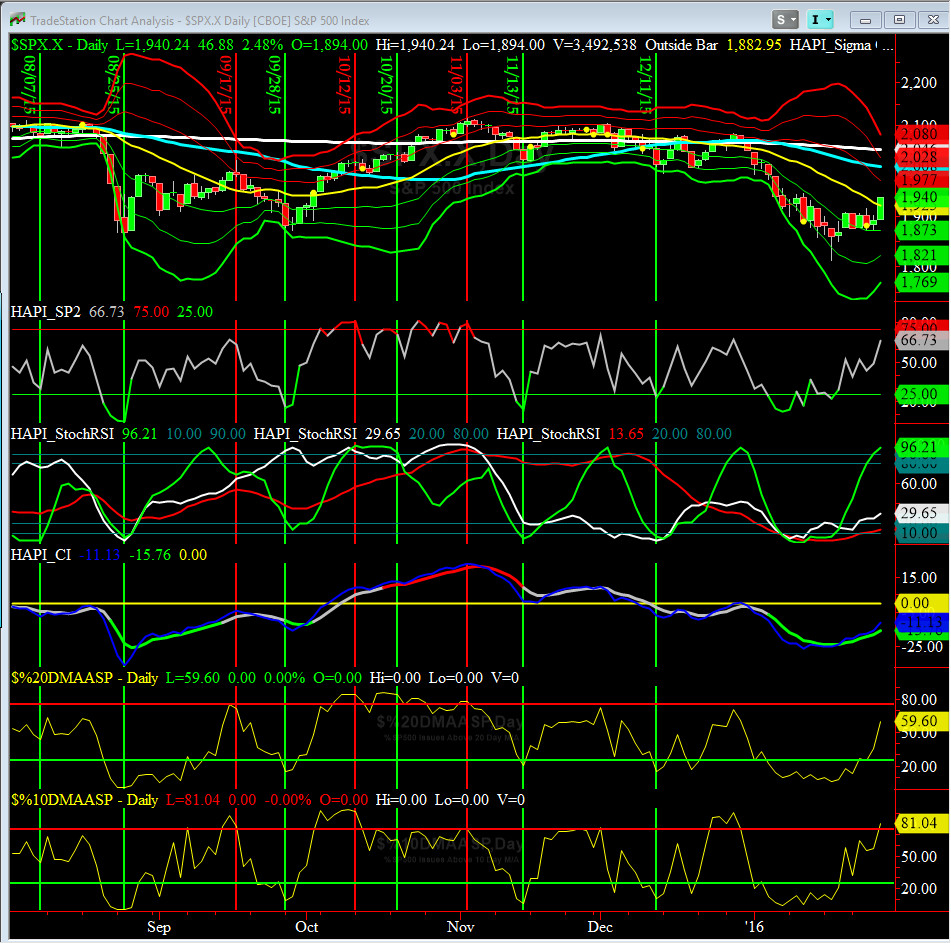
HA_SP2 Chart
HA_SP2 = 66.7 (Buy signal <= 25, Sell Signal >= 75)
At ~67, this prop indicator is showing a gradual move up but not overbought yet.
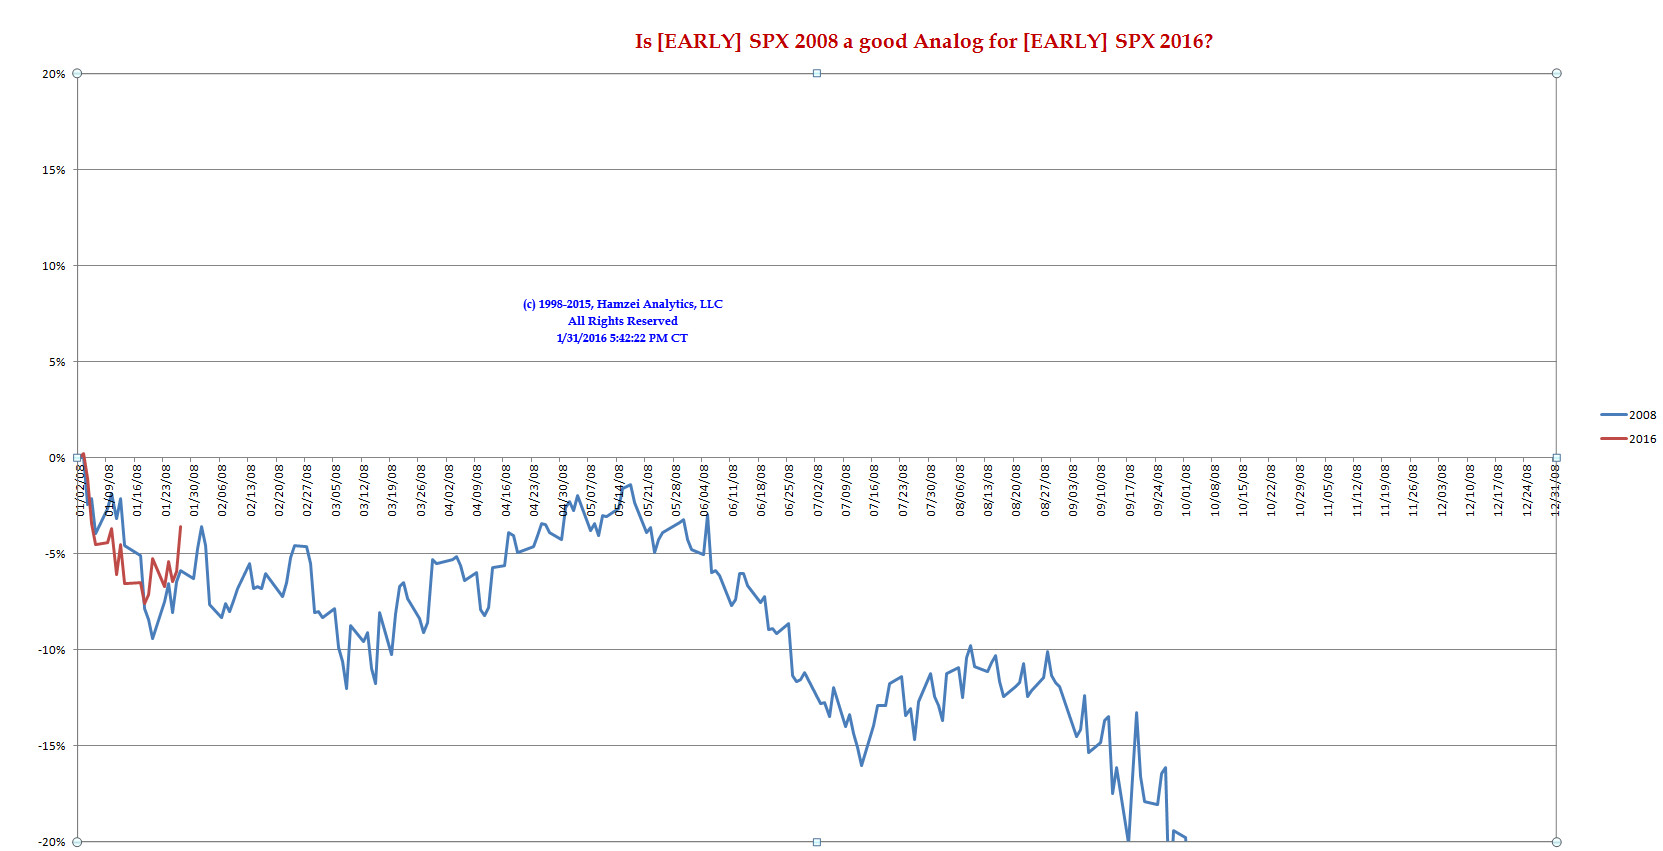
SPX 2008 Analog for SPX 2016
FWIW, my co-pilot, @Capt_Tiko (now with about 260 Twitter Followers) is anxiously following a track using 2008. I may have to step in and provide some guidance and counsel.
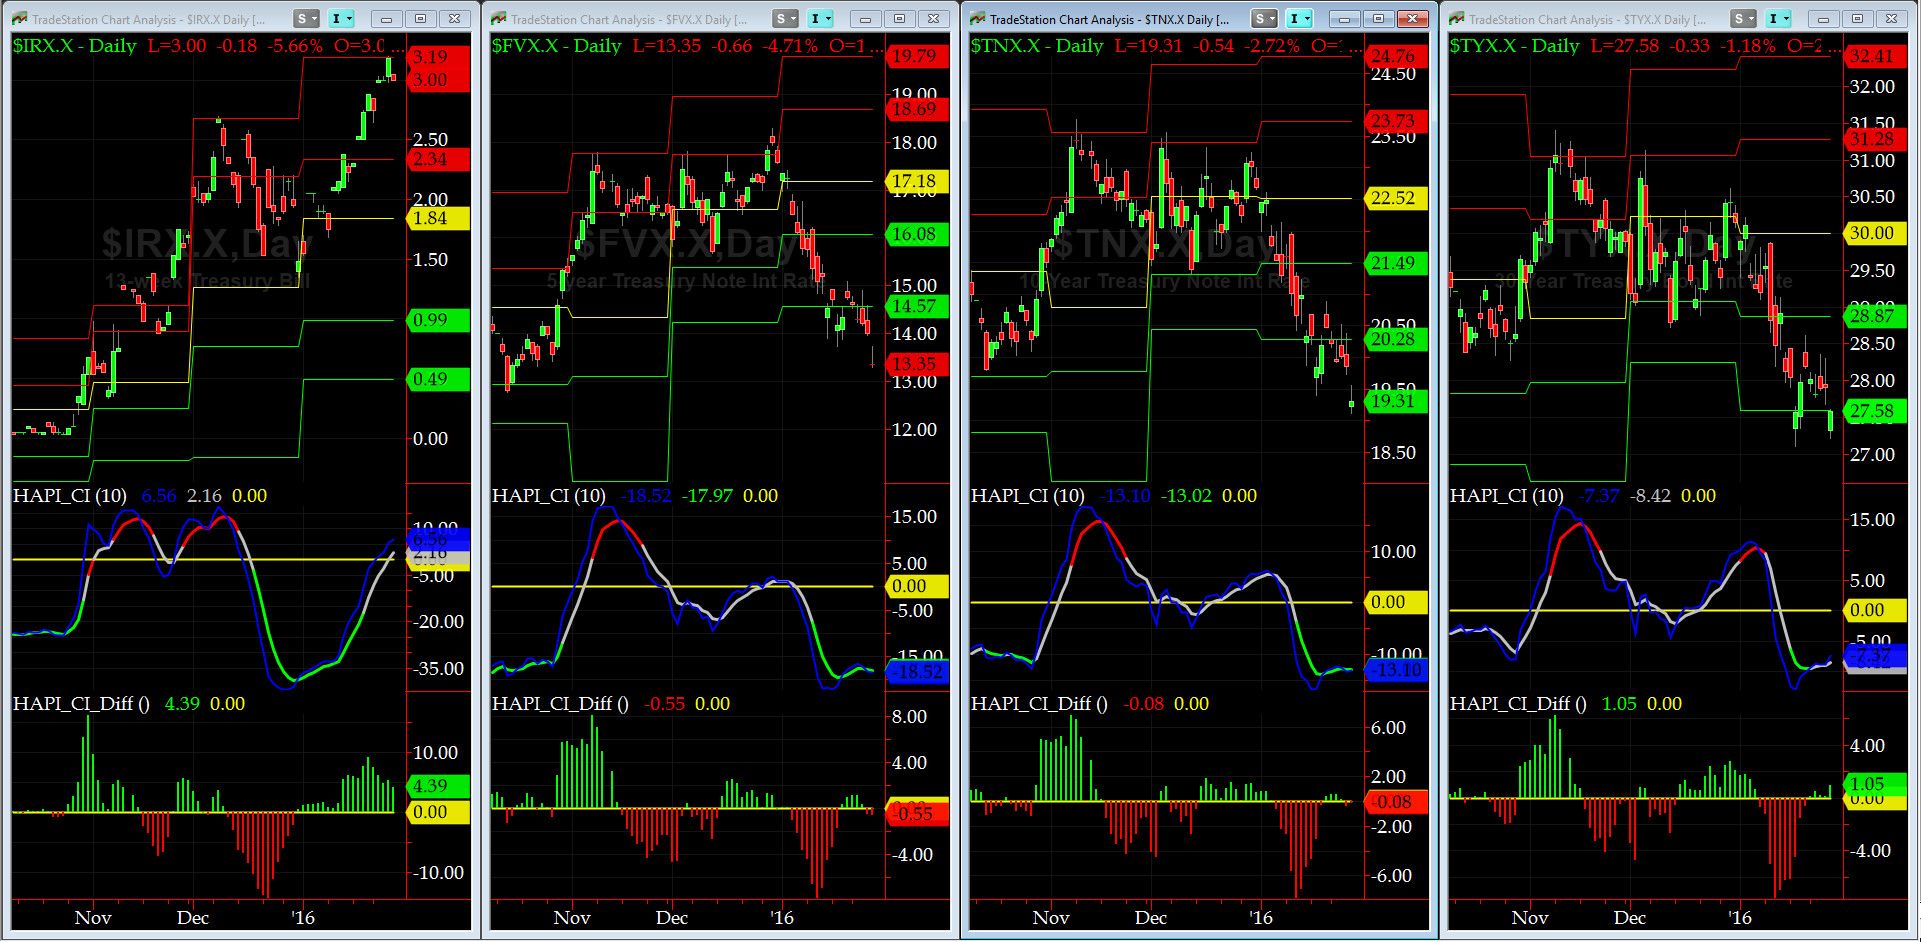
US Treasury T-Notes & T-Bonds Yields Chart
Treasury Complex Yields snapped down on Friday as Equities took off hard due to BoJ surprise easing announcement.
Good luck this week,
Fari Hamzei
|
|
|
|
|
|
Customer Care:
|
|
|
|
|
|
|
|
|
|


