|
Sunday, February 14, 2016 2230ET
Market Timing Charts, Analysis & Commentary for Issue #131
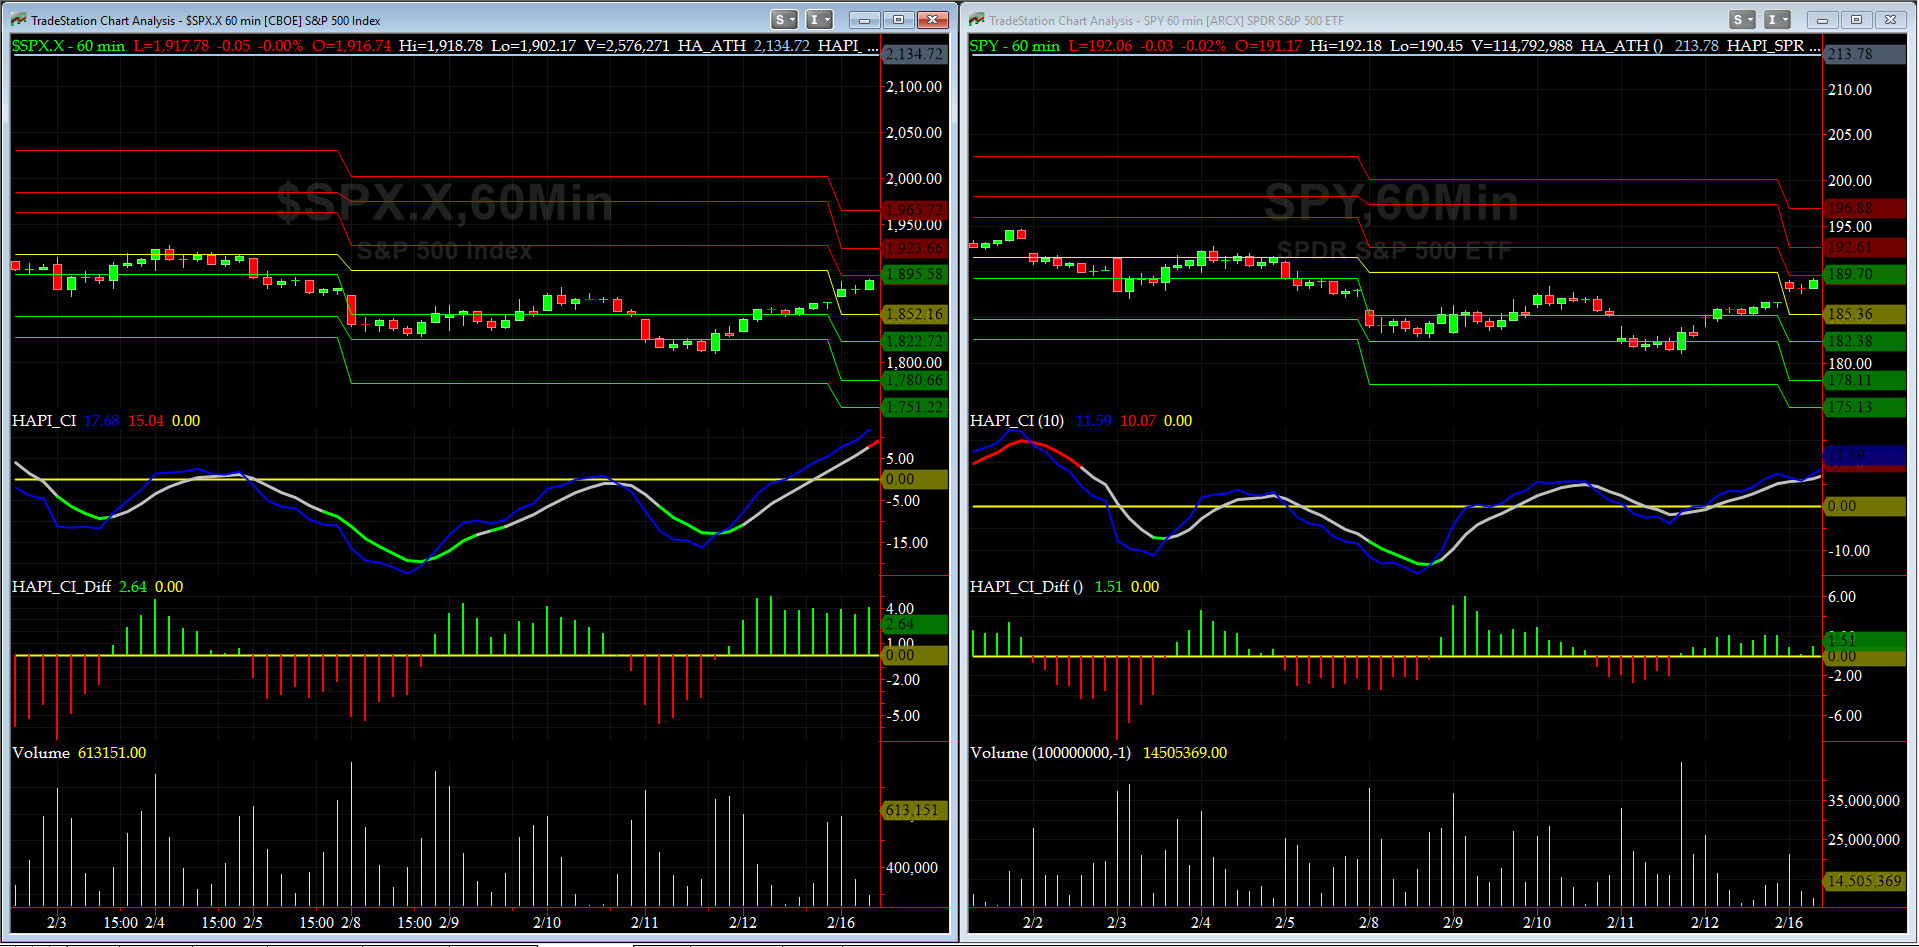
Timer Charts of S&P-500 Cash Index (SPX) + NASDAQ-100 Cash Index (NDX)
Most recent S&P-500 Cash Index (SPX): 1864.78 down -15.72 (down -0.84%) for the week ending on Friday, February 5th, 2016, which closed above its -1 sigma.
SPX ALL TIME INTRADAY HIGH = 2134.72 (reached on Wednesday, May 20th, 2015)
SPX ALL TIME CLOSING HIGH = 2130.82 (reached on Thursday, May 21st, 2015)
Current DAILY +2 Sigma SPX = 1943 with WEEKLY +2 Sigma = 2159
Current DAILY 0 Sigma (20 day MA) SPX = 1885 with WEEKLY 0 Sigma = 2003
Current DAILY -2 Sigma SPX = 1827 with WEEKLY -2 Sigma = 1847
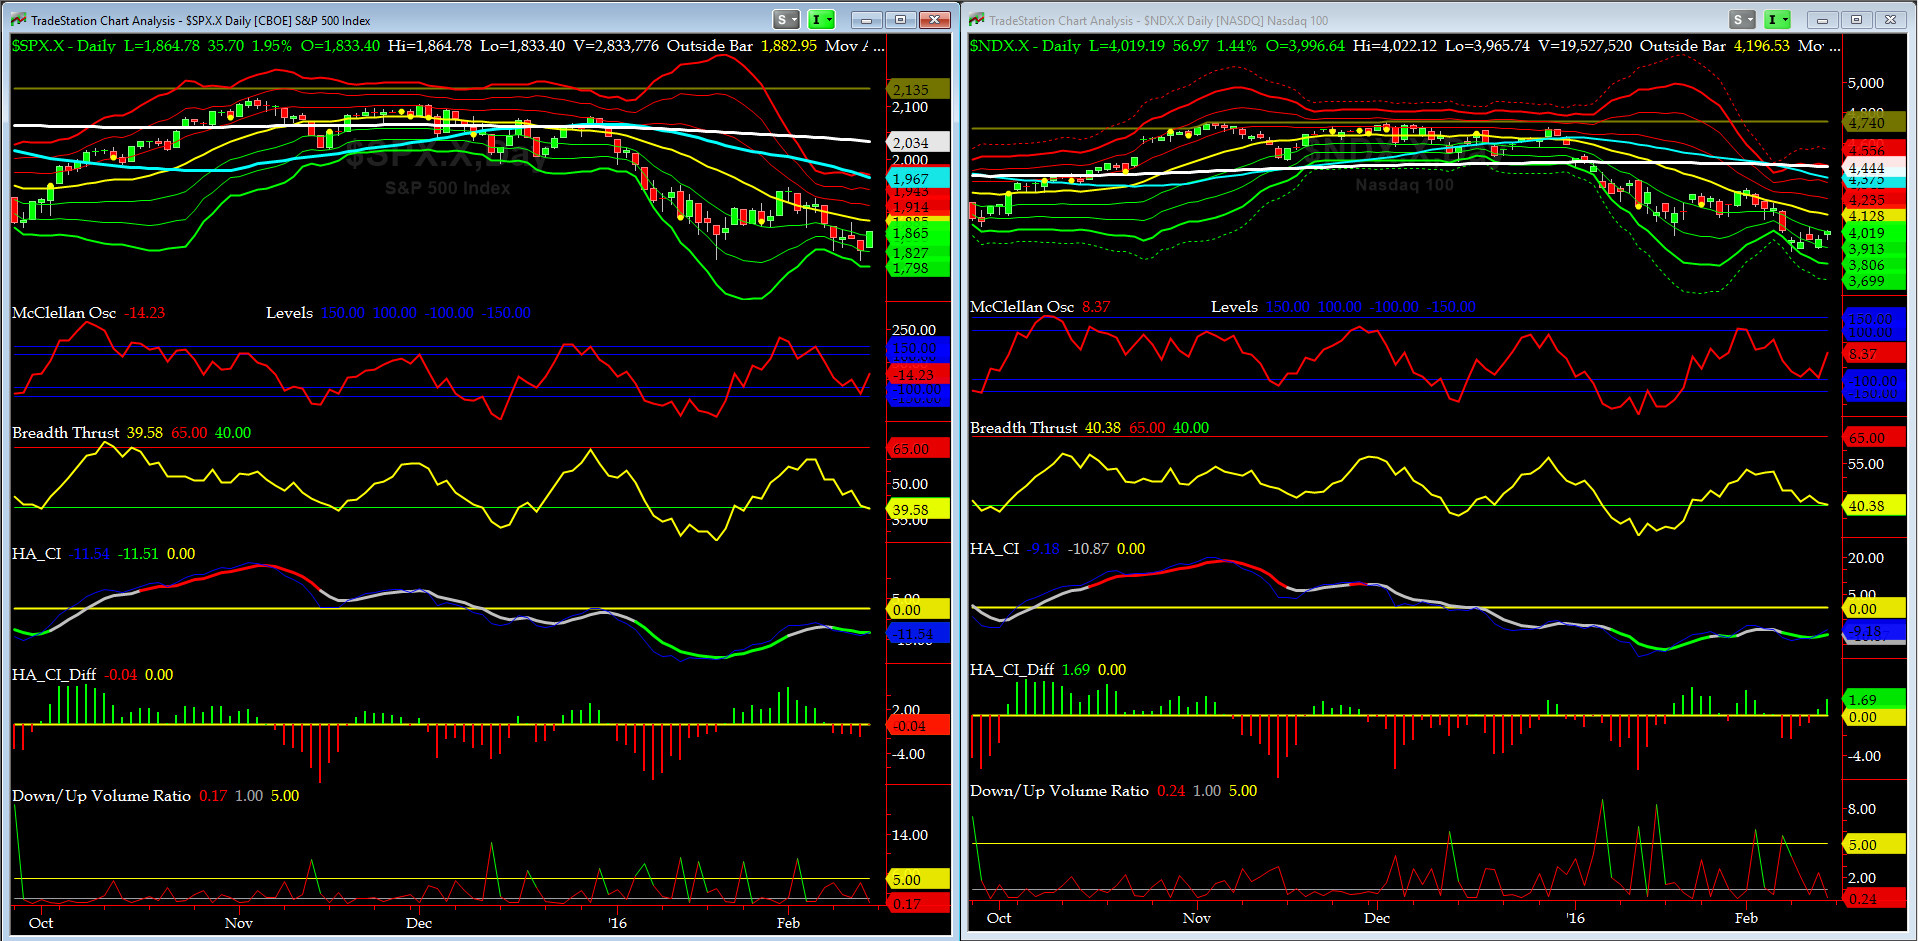
NYSE McClellan Oscillator = -14 (-150 is start of the O/S area; around -275 to -300 area or lower, we go into the �launch-pad� mode, over +150, we are in O/B area)
NYSE Breadth Thrust = 39.6 (40 is considered as oversold and 65 as overbought)
Worth noting is that NAZZ is leading NYSE here.

Canaries [in the Coal Mine] Chart for DJ TRAN & RUT Indices
200-Day MA DJ TRAN = 7965 or -11.5% above DJ TRAN (max observed in last 5 yrs = 20.2%, min = -20.3%)
200-Day MA RUT = 1170 or -17.0% above RUT (max observed in last 5 yrs = 21.3%, min = -22.6%)
DJ Transports (proxy for economic conditions 6 to 9 months hence) is STILL in a channel breakout.
Russell 2000 Small Caps (proxy for RISK ON/OFF) sold off most of last week with exception of Friday. RISK is still OFF, ioho.
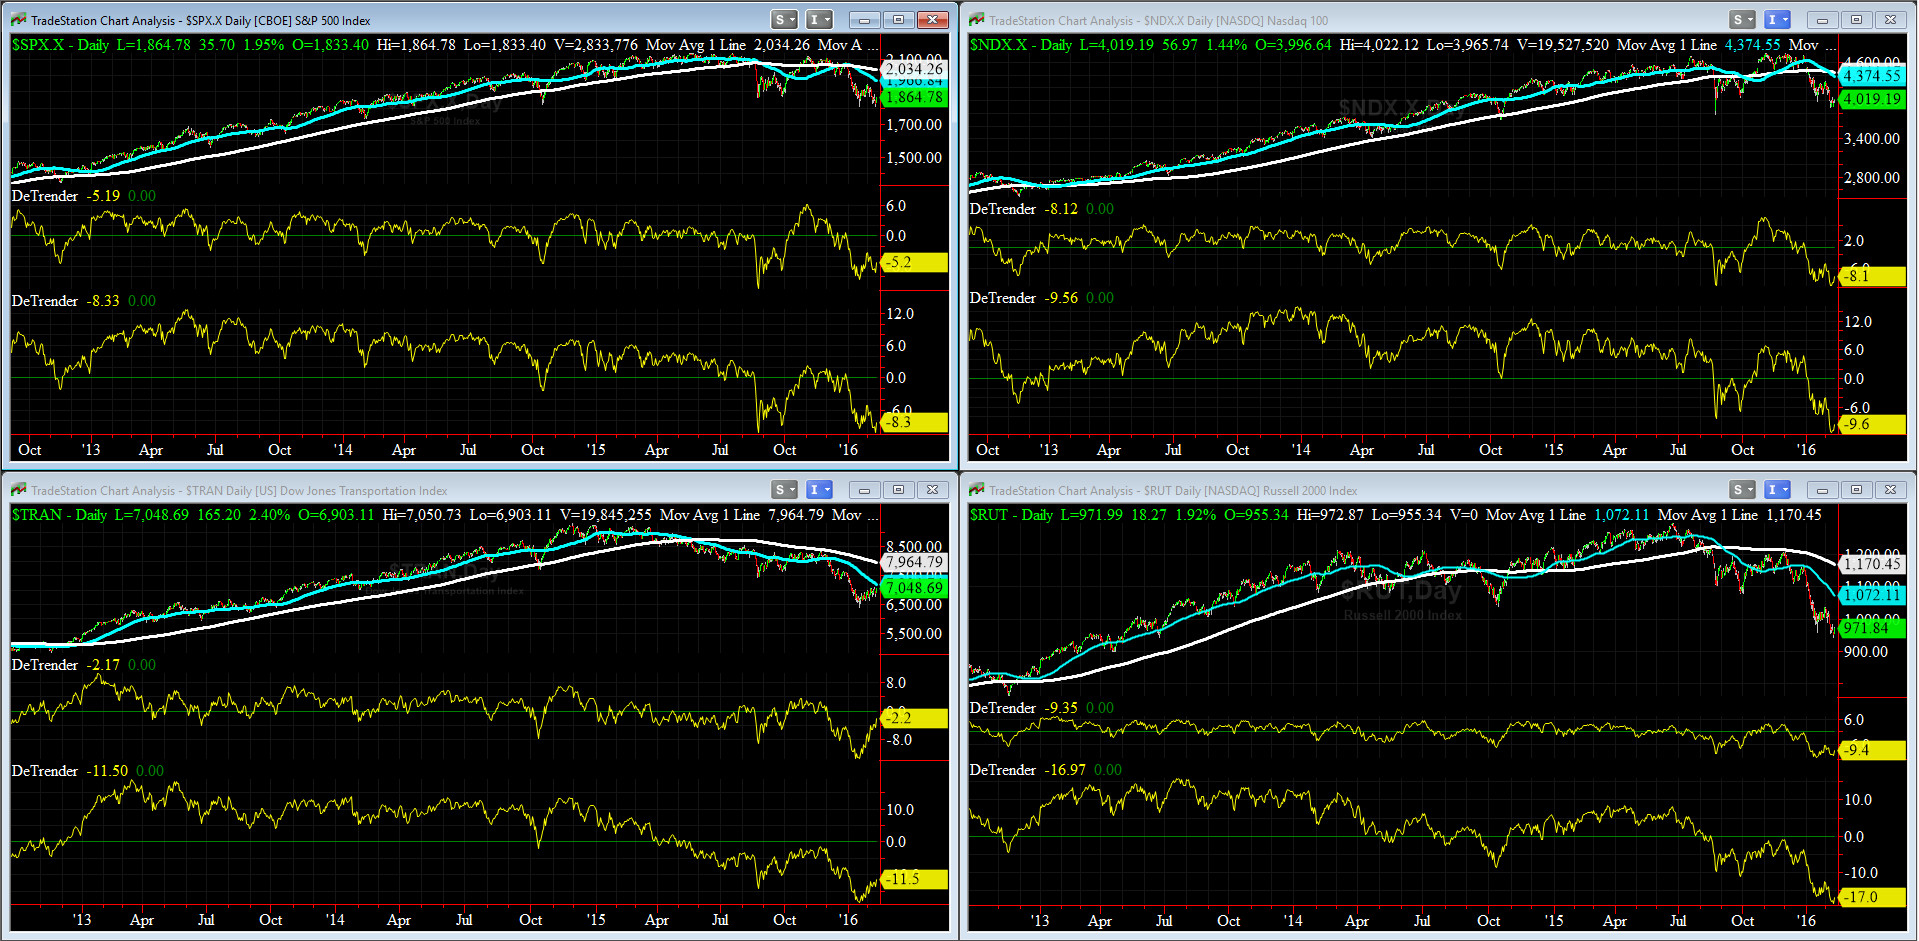
DeTrenders Charts for SPX, NDX, TRAN & RUT Indices
50-Day MA SPX =1967 or -5.2% above SPX (max observed in last 5 yrs = +8.6%, min = -9.3% )
200-Day MA SPX = 2034 or -8.3% above SPX (max observed in last 5 yrs = 15.2%, min = -14%)
All of our Eight DeTrenders are still negative but now they are improving.
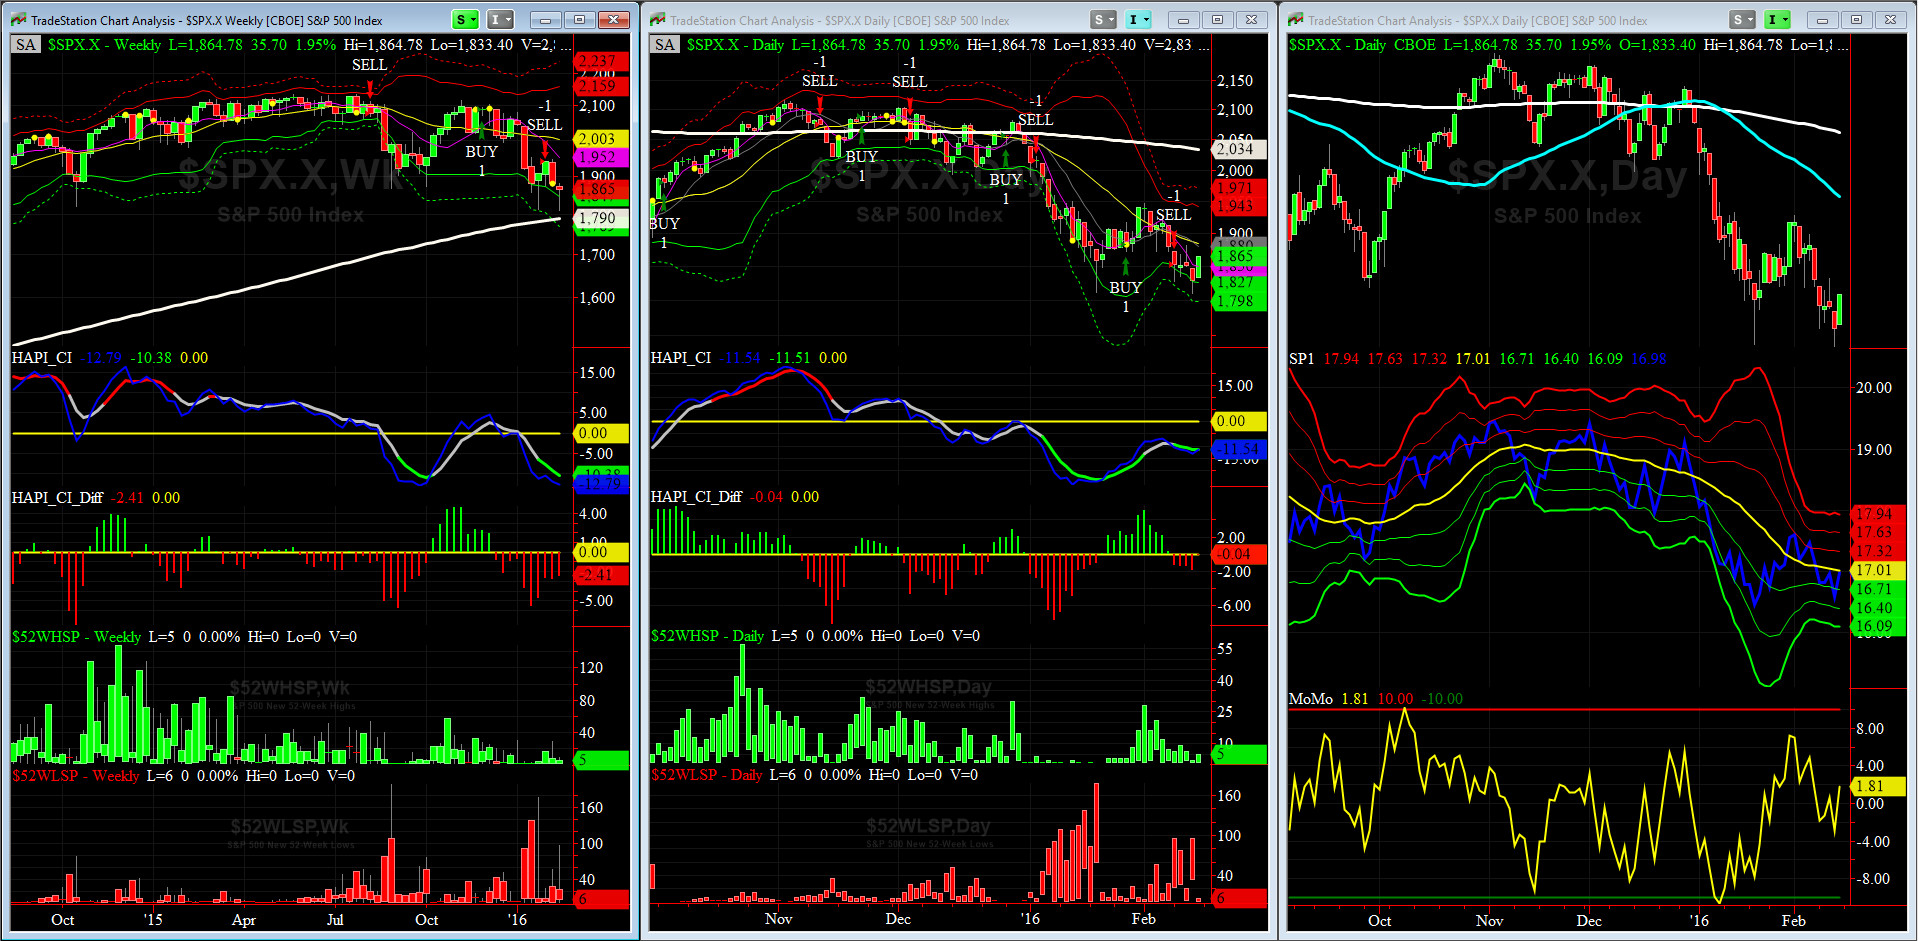
HA_SP1_momo Chart
WEEKLY Timing Model = on a SELL Signal since Friday 1/29/16 CLOSE
DAILY Timing Model = on a SELL Signal since Monday 2/8/16 CLOSE
Max SPX 52wk-highs reading last week = 9 (over 120-140, the local maxima is in)
Max SPX 52wk-Lows reading last week = 96 (over 40-60, the local minima is in)
HA_SP1 = almost at its zero Sigma
HA_Momo = +1.81 (reversals most likely occur above +10 or below -10)

Vol of the Vols Chart
VIX = 25.4 which is just above its zero sigma (remember it�s the VIX�s vol pattern (its sigma channels) that matters, and not the level of VIX itself (this is per Dr. Robert Whaley, a great mentor and the inventor of original VIX, now called VXO. VIX usually peaks around a test of its +4 sigma).
As stated here in the last 2 weeks, this shockwave is over till the next shoe drops.
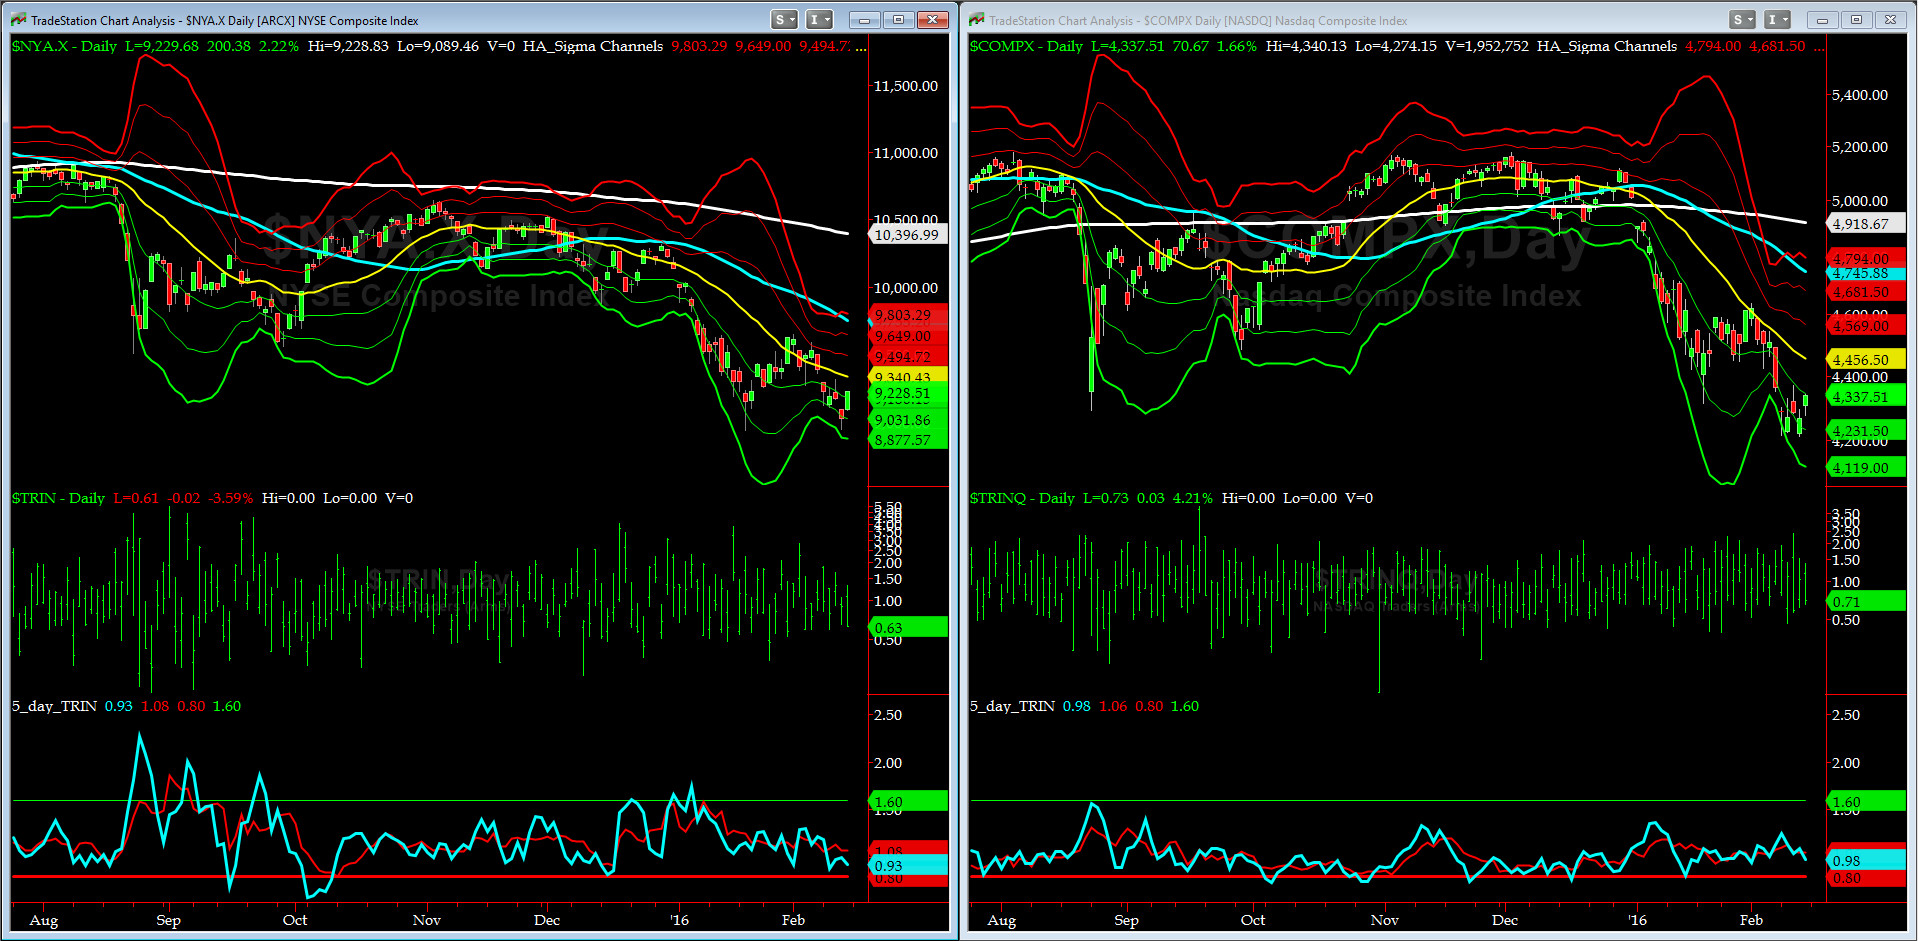
5-day TRIN & TRINQ Charts
Both 5-day TRIN (for NYSE) and 5-day TRINQ (for NASDAQ) heading to a SELL signal here. This chart is worth watching in the coming week or two.
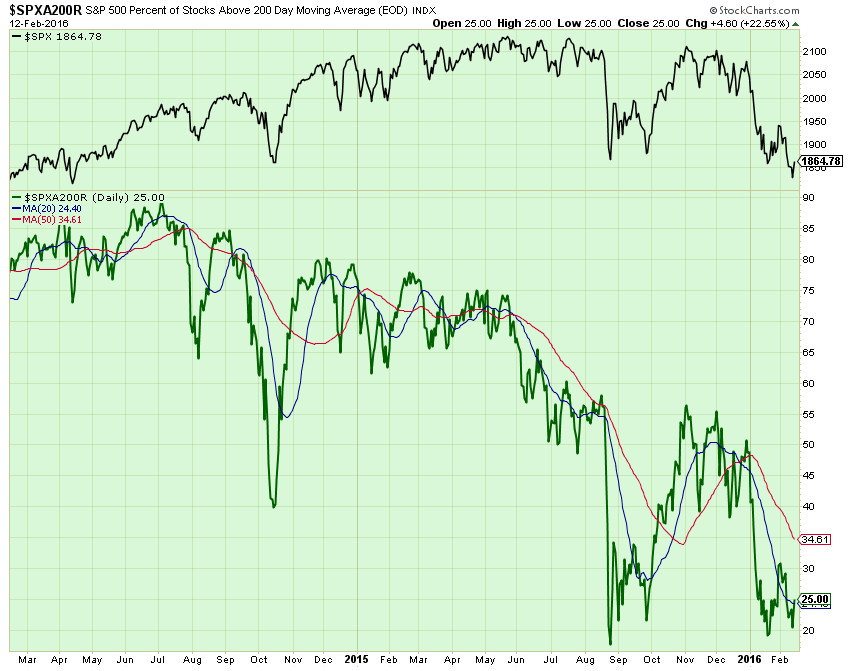
Components of SPX above their respective 200day MA Chart
We closed the week at 25% for this scoring indicator. Next, we need to see it cross its 50bar which is at 34% now (red line).
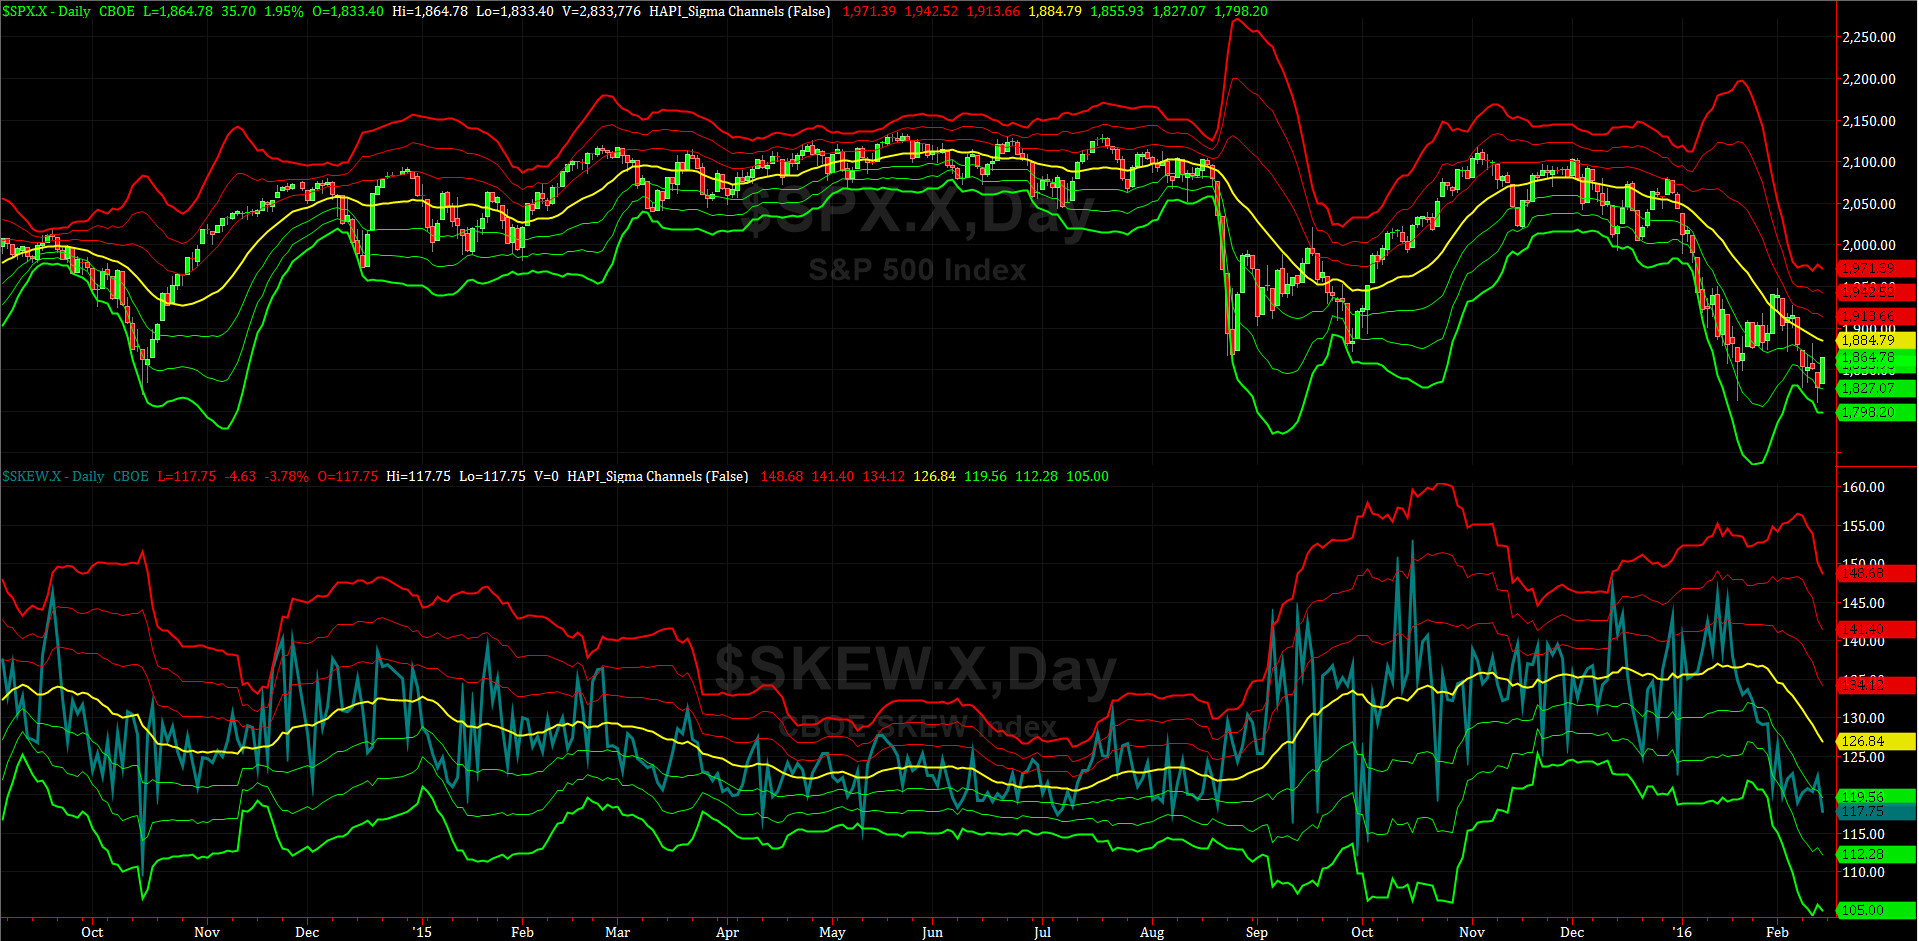
SPX SKEW (Tail Risk) Chart
SPX SKEW (Tail Risk) = 118 and about its -1 sigma (normal = 120-125, range 100-150)
All Quiet on the MidWestern Front? It should not be, given the recent price action.
The tail risk is subsiding to pre-August2015 levels.
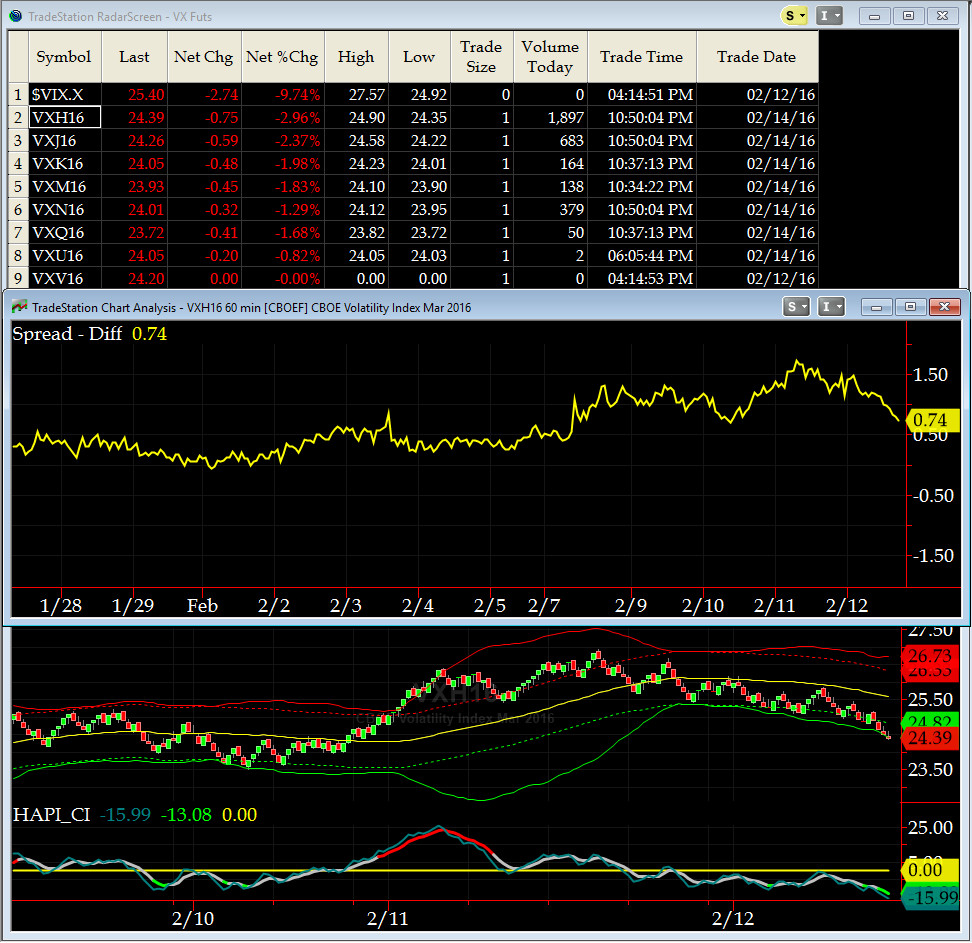
3-month VIX Futures Spread(VX) Chart
Our 3-month VIX Futures Spread (LONG MAR16 SHORT JUN16), closed Friday at +0.74. That says Thursday may have the s/t low (local minima) for now.
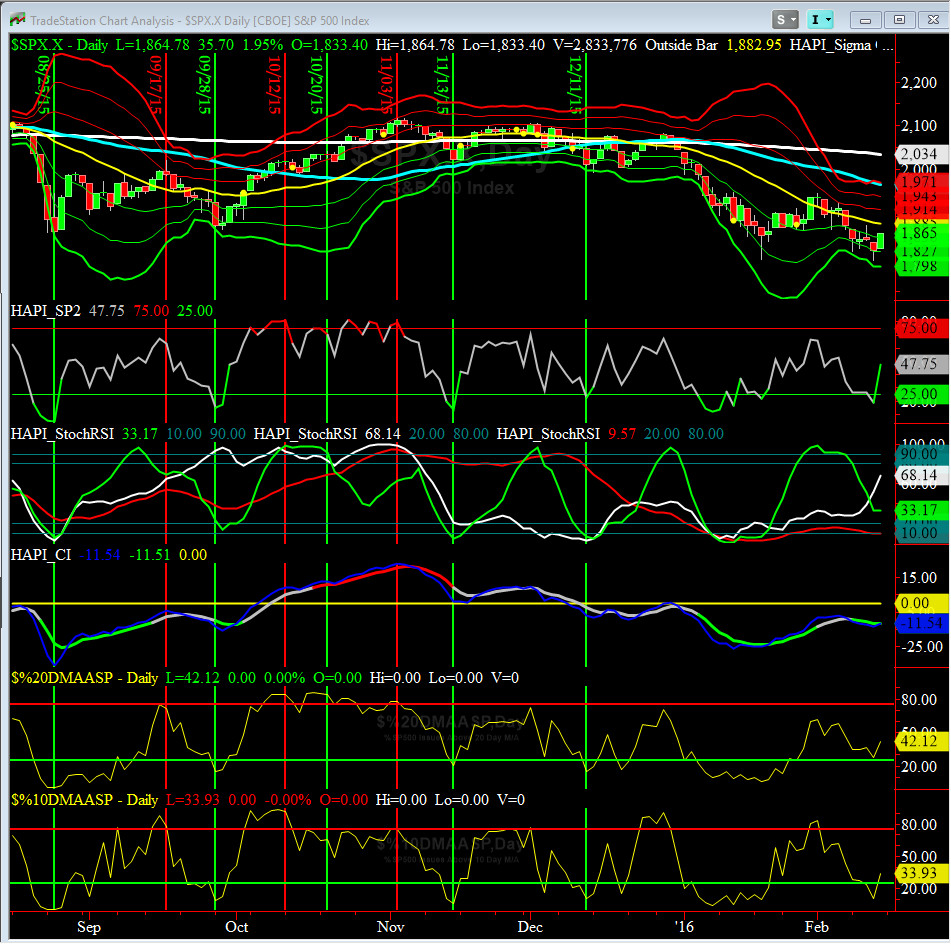
HA_SP2 Chart
HA_SP2 = 47.75 (Buy signal <= 25, Sell Signal >= 75)
At ~48, this prop indicator went to neutral in one day (last Friday).
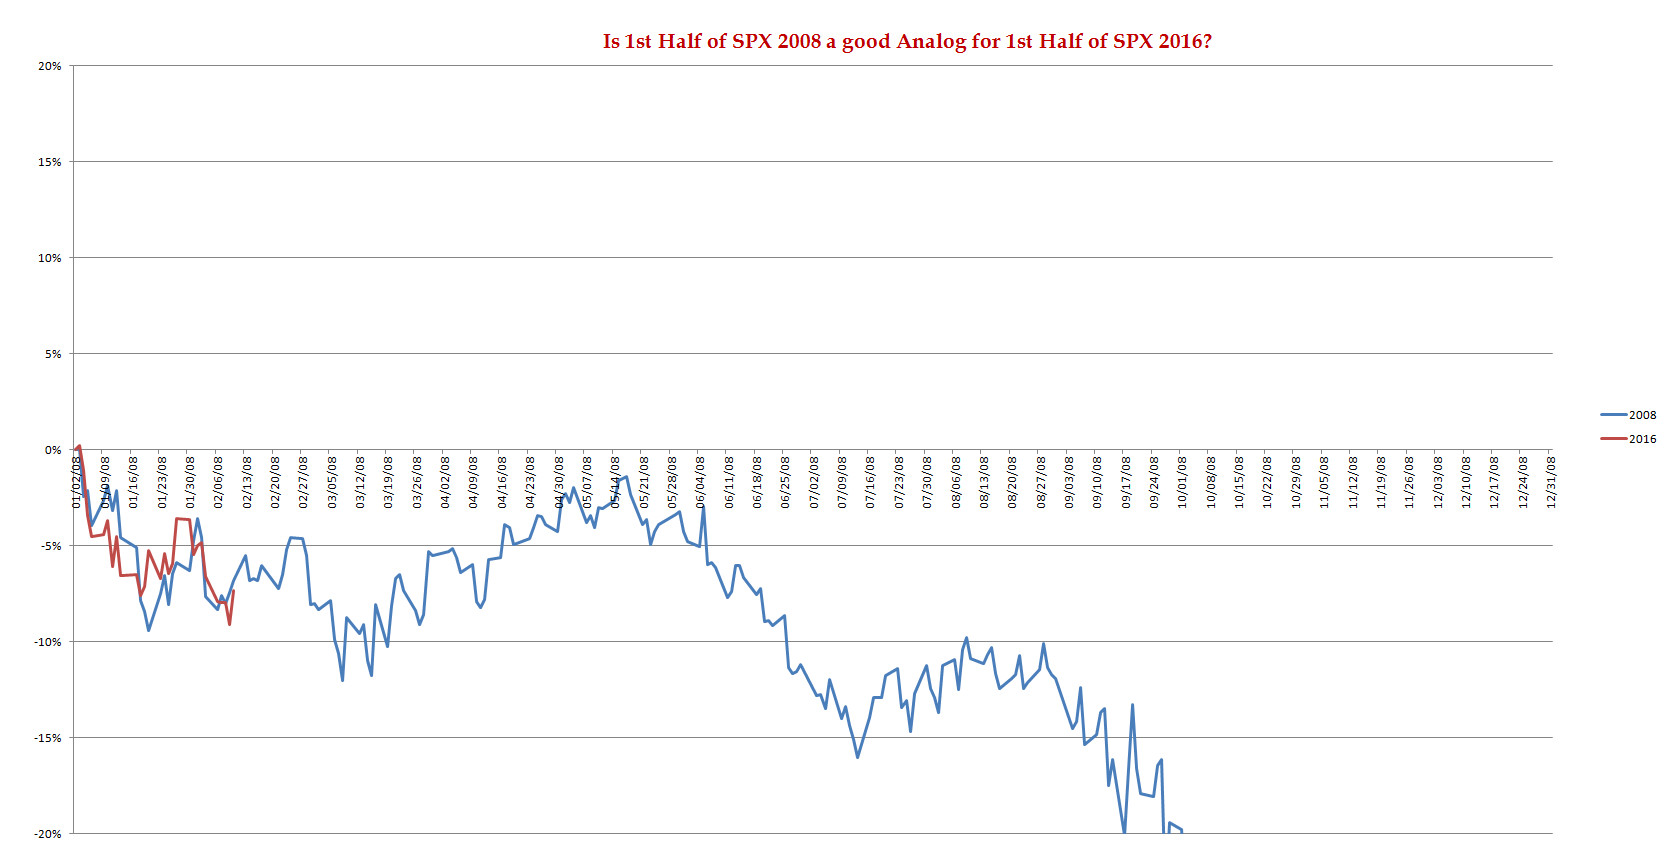
SPX 2008 Analog for SPX 2016
My co-pilot, @Capt_Tiko, is still tracking the 2008 price action vs 2016. He continues to tell us that 2016 will be a lot like 2008, at least for the first half. We wish we had his IQ. Must be his Albacore Tuna + Foumanat Tea Diet.

US Treasury T-Notes & T-Bonds Yields Chart
Treasury Complex Yields rose sharply on Thursday and Friday.
Fari Hamzei
|


 Proactive Market Timing