|
Saturday Afternoon, April 30, 2016 1400ET
Market Timing Charts, Analysis & Commentary for Issue #141
Timer Charts of S&P-500 Cash Index (SPX) + NASDAQ-100 Cash Index (NDX)
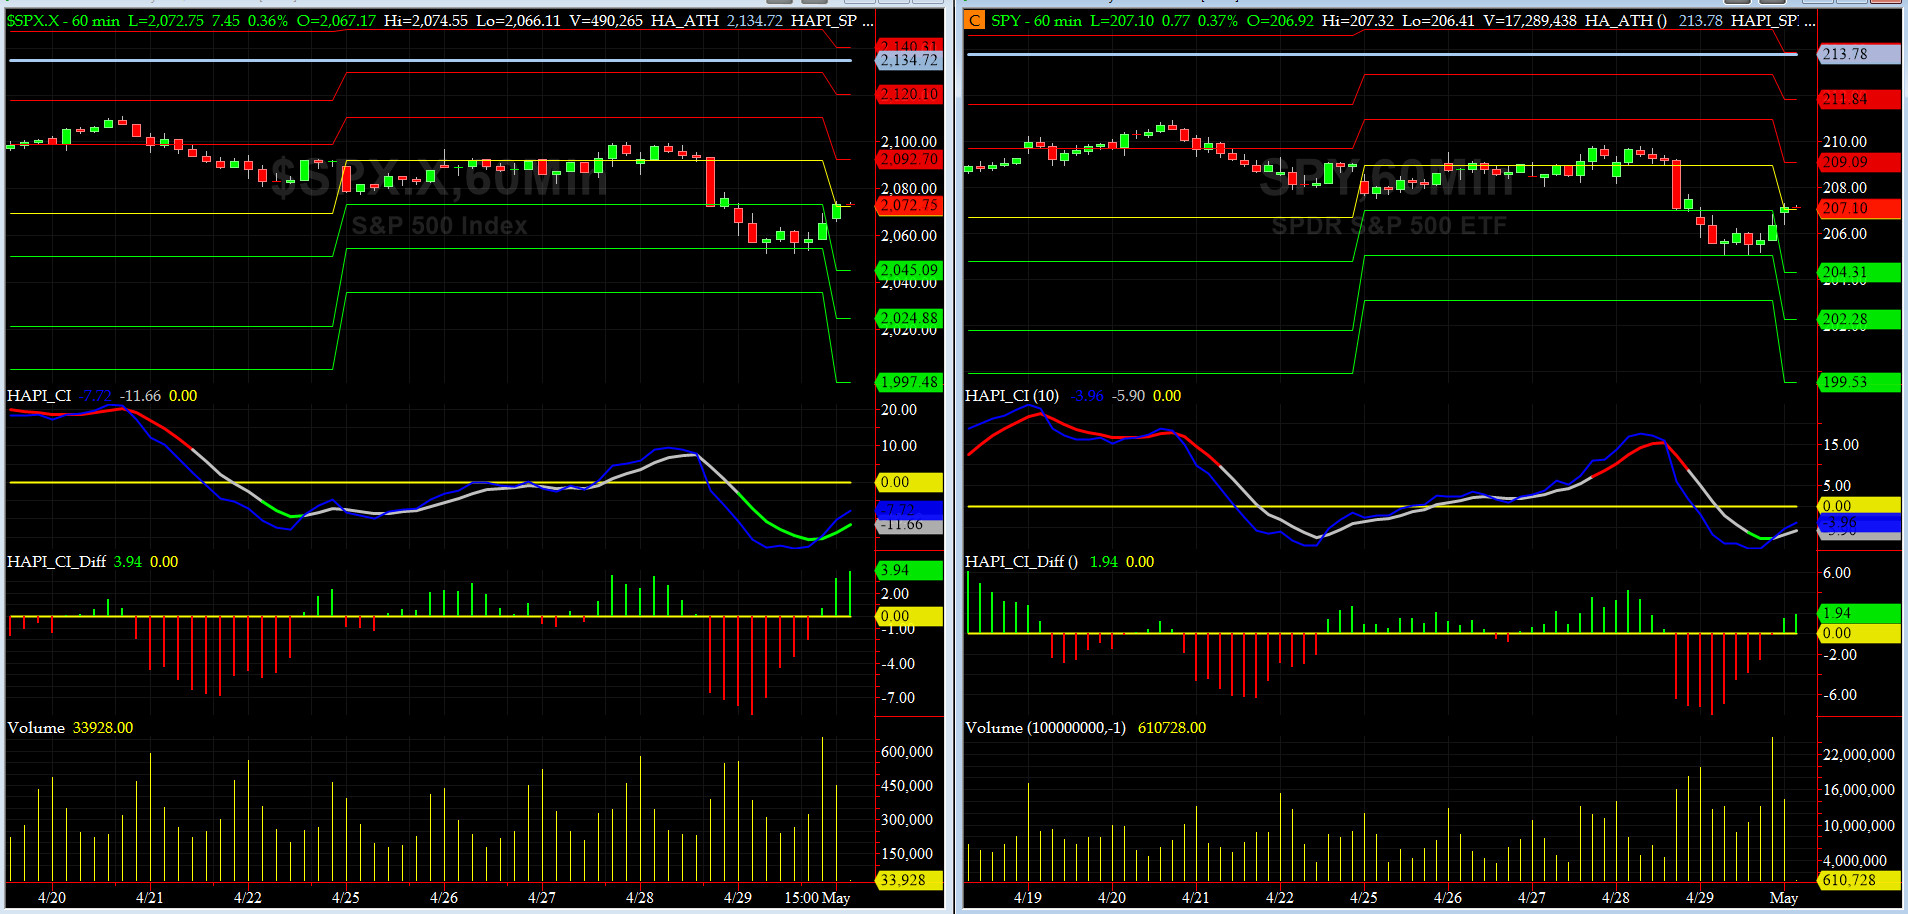
Most recent S&P-500 Cash Index (SPX): 2065.30 down -26.28 (down -1.2%) for the week ending on Friday, April 29th, 2016, which closed just below its zero sigma.
SPX ALL TIME INTRADAY HIGH = 2134.72 (reached on Wednesday, May 20th, 2015)
SPX ALL TIME CLOSING HIGH = 2130.82 (reached on Thursday, May 21st, 2015)
Current DAILY +2 Sigma SPX = 2115 with WEEKLY +2 Sigma = 2140
Current DAILY 0 Sigma (20 day MA) SPX = 2076 with WEEKLY 0 Sigma = 1992
Current DAILY -2 Sigma SPX = 2037 with WEEKLY -2 Sigma = 1843
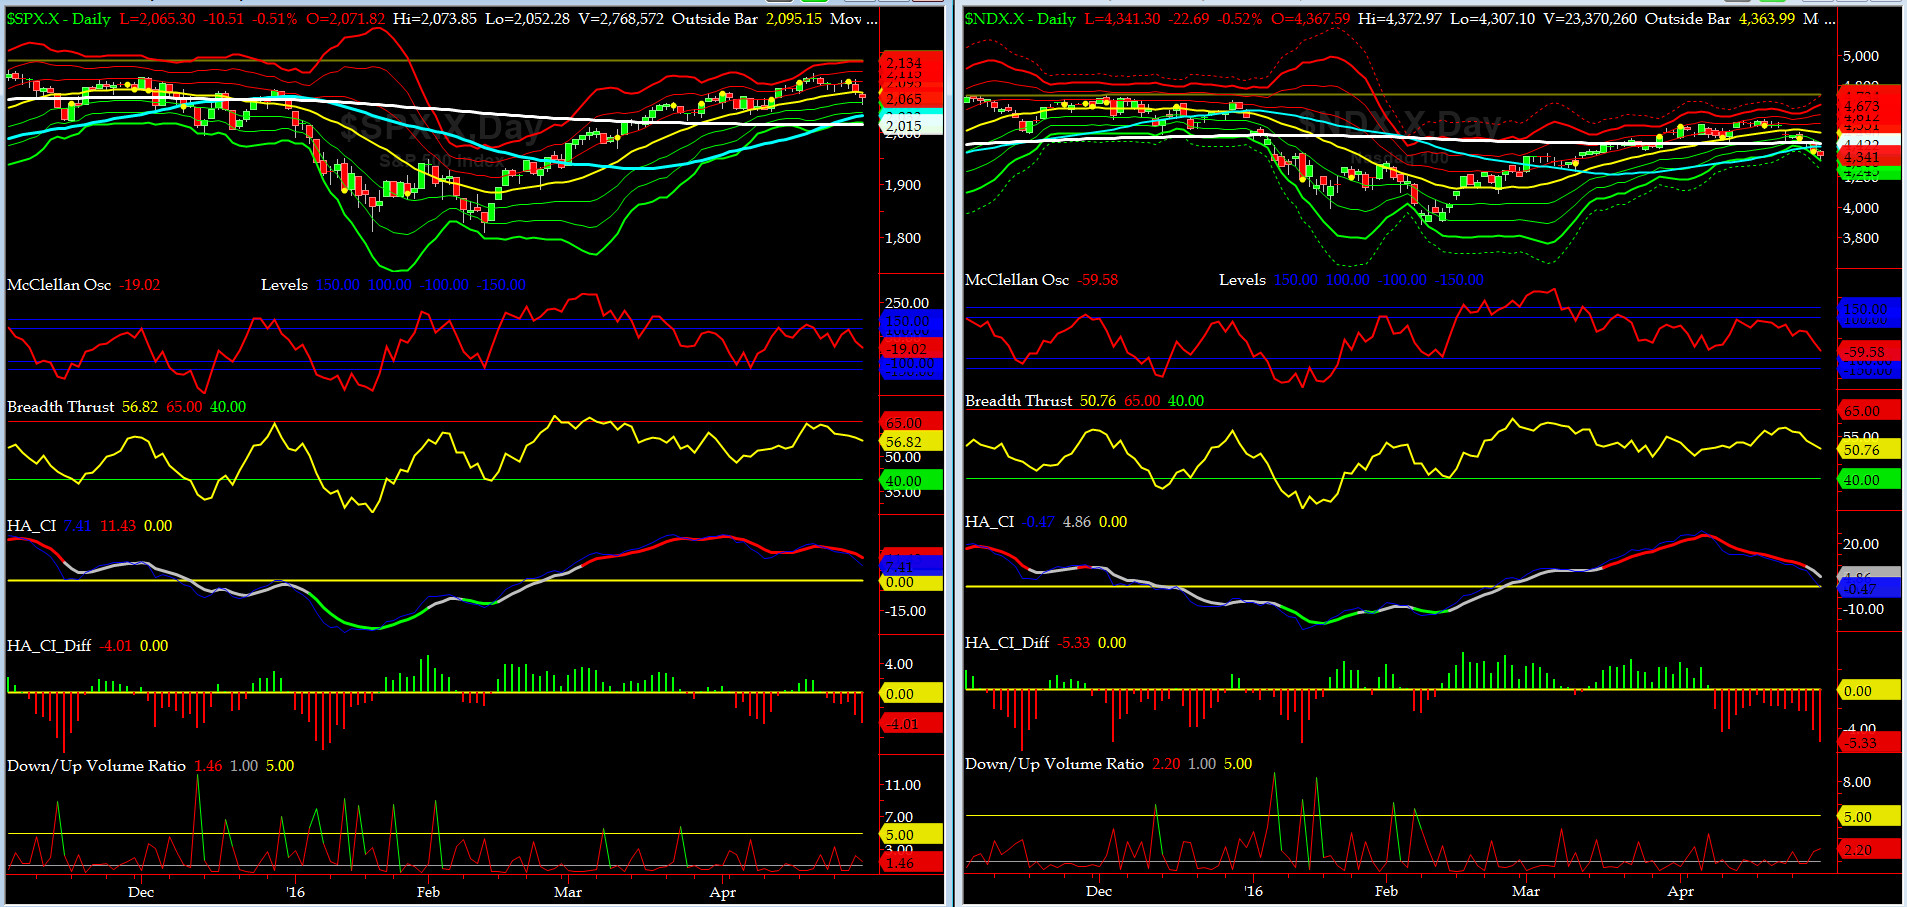
NYSE McClellan Oscillator = -19 (-150 is start of the O/S area; around -275 to -300 area or lower, we go into the �launch-pad� mode, over +150, we are in O/B area)
NYSE Breadth Thrust = 56.9 (40 is considered as oversold and 65 as overbought)
On Tuesday AAPL missed (after MSFT & GOOGL misses in the prior week), and on Thursday, Carl Icahn sold his massive AAPL position -- if you recall, we told him (on Twitter) back in July of 2015, to SELL Apple at 130 (Carl never listens - behaved the same way when he was on the Board of Governors of Princeton.... oh well). With non-action of BOJ Wednesday, we had two tsunamis this week.
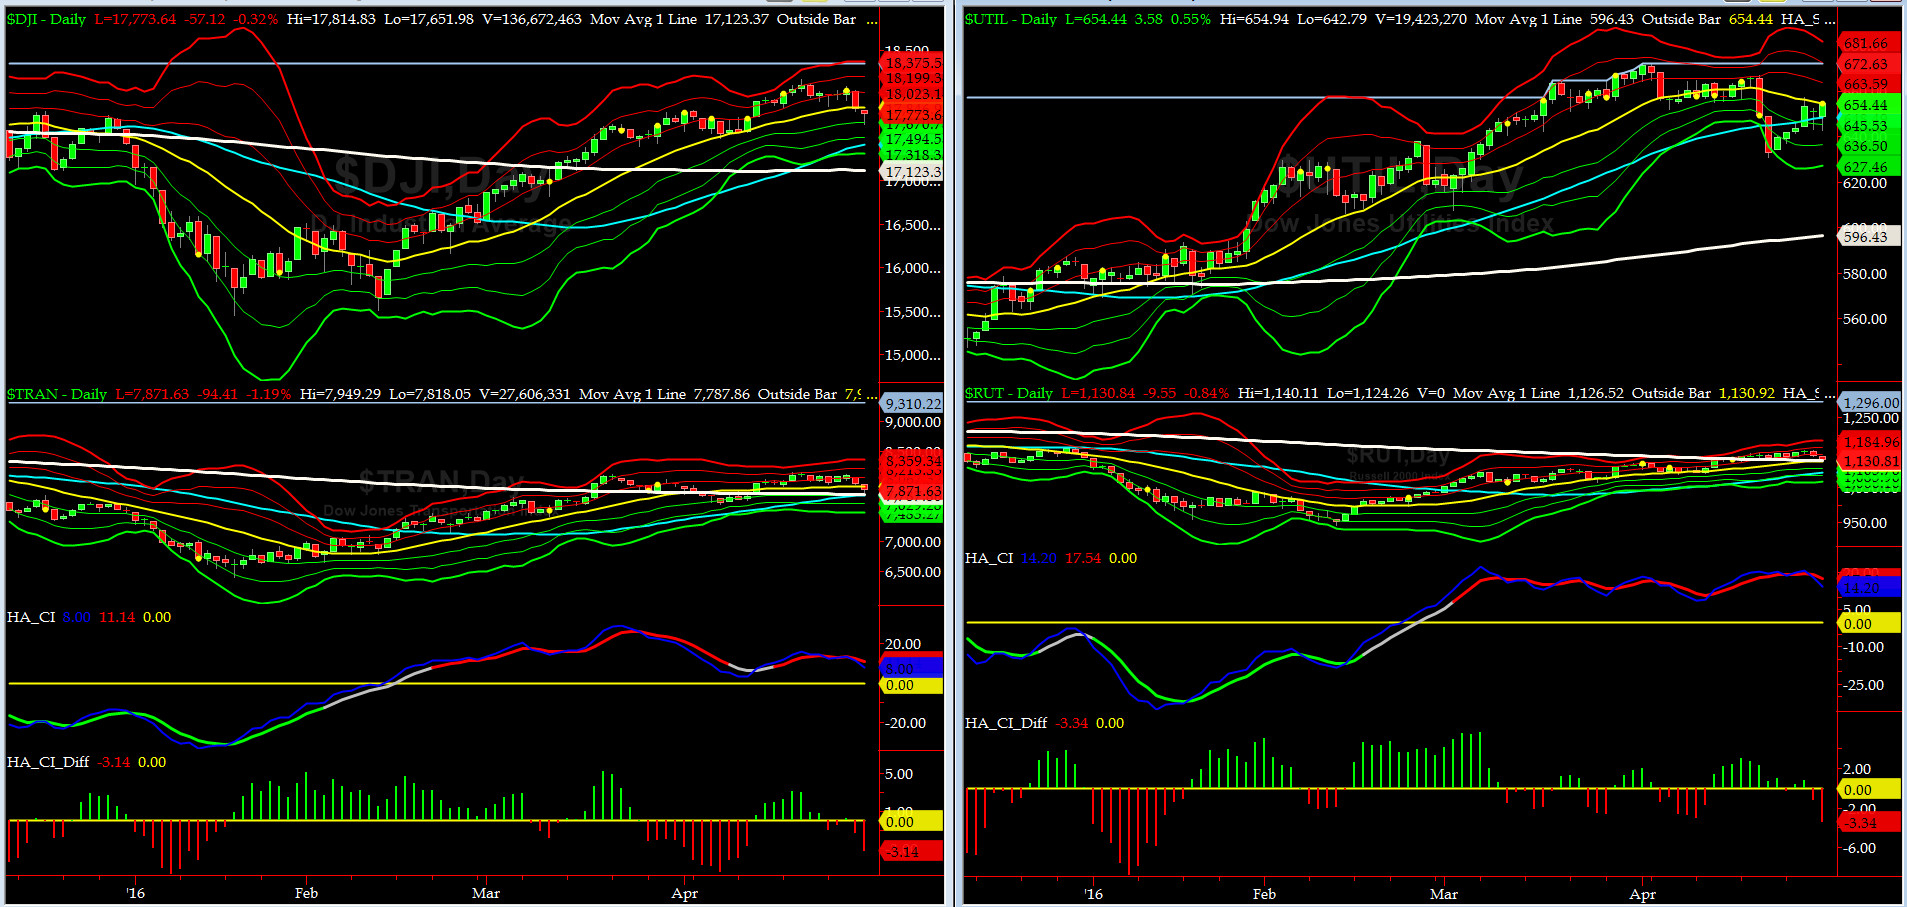
Canaries [in the Coal Mine] Chart for DJ TRAN & RUT Indices
200-Day MA DJ TRAN = 7787 or 1.1% below DJ TRAN (max observed in last 5 yrs = 20.2%, min = -20.3%)
200-Day MA RUT = 1126 or 0.4% below RUT (max observed in last 5 yrs = 21.3%, min = -22.6%)
DJ Transports (proxy for economic conditions 6 to 9 months hence) reversed very hard Thursday and Friday. We [should] expect to see another day down or bounce from here. Anything else, we have a game changer.
Russell 2000 Small Caps (proxy for RISK ON/OFF) also sold hard last two days. RISK was ON and now we need to keep an eye on it.
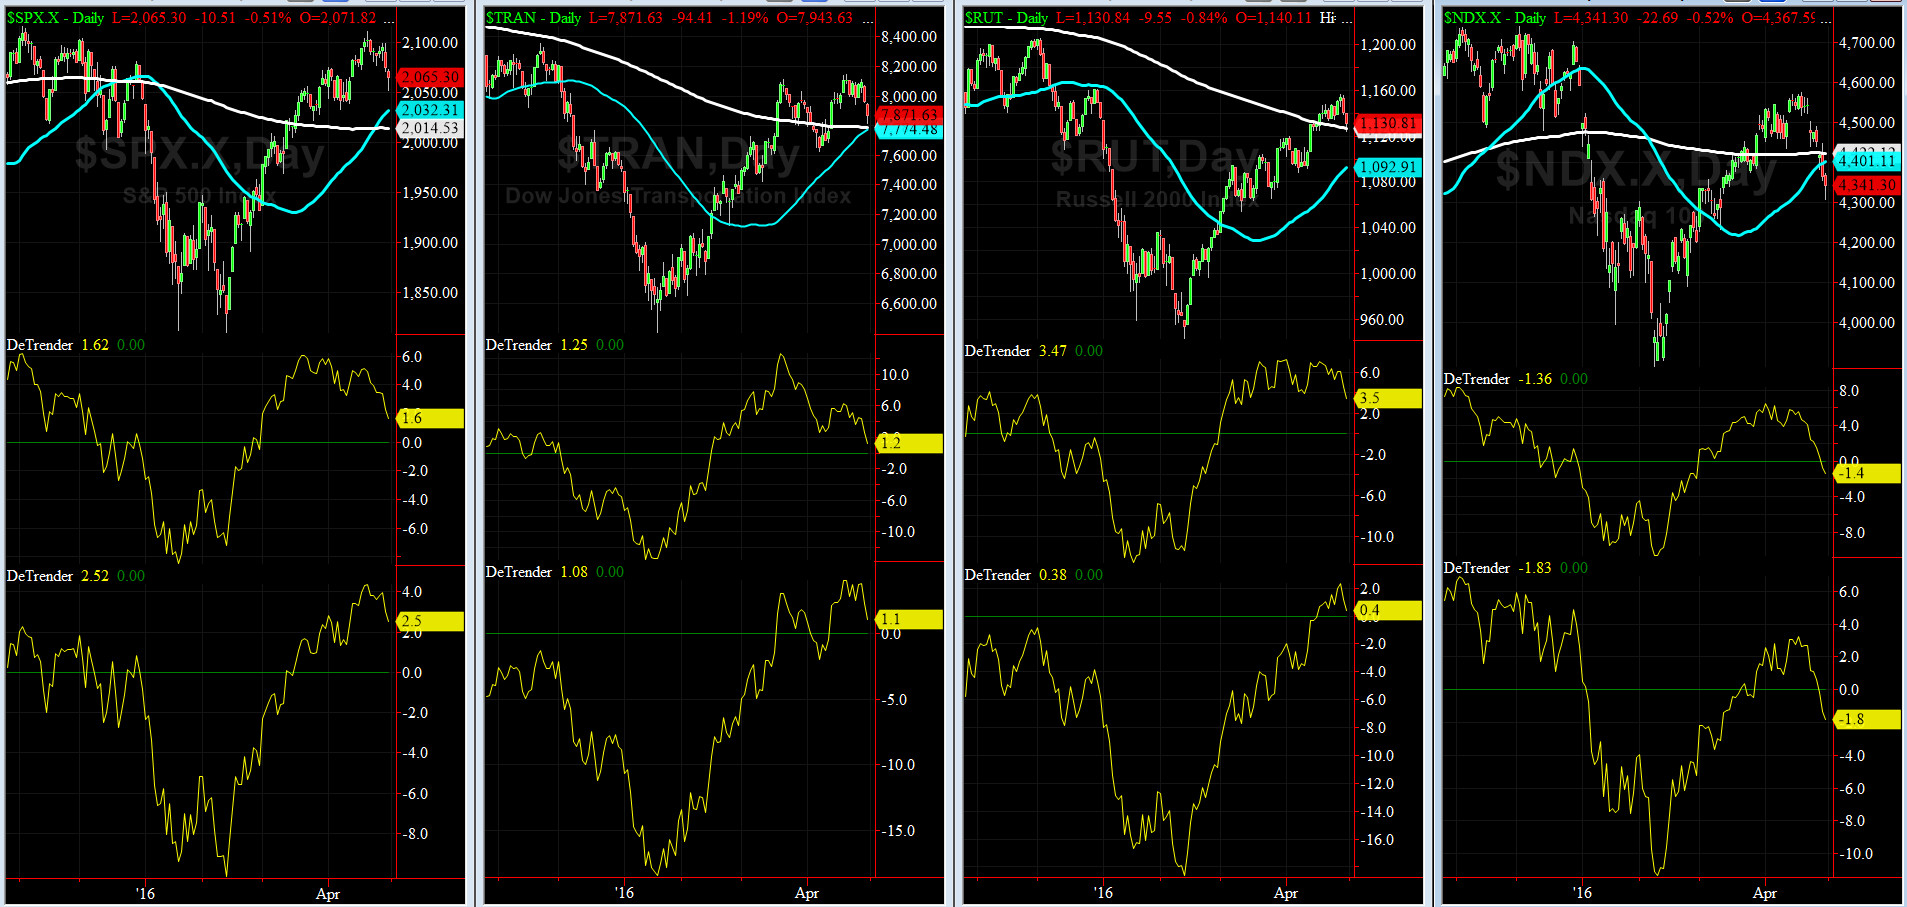
DeTrenders Charts for SPX, NDX, TRAN & RUT Indices
50-Day MA SPX = 2013 or +3.9% below SPX (max observed in last 5 yrs = +8.6%, min = -9.3%)
200-Day MA SPX = 2015 or +3.8% below SPX (max observed in last 5 yrs = 15.2%, min = -14%)
SIX of our Eight DeTrenders are positive now as NDX got whacked this week, big time. Poor Timmy, Larry, Serge & Billy. But our favorite, AMZN continued to shine, way to go Jeff.
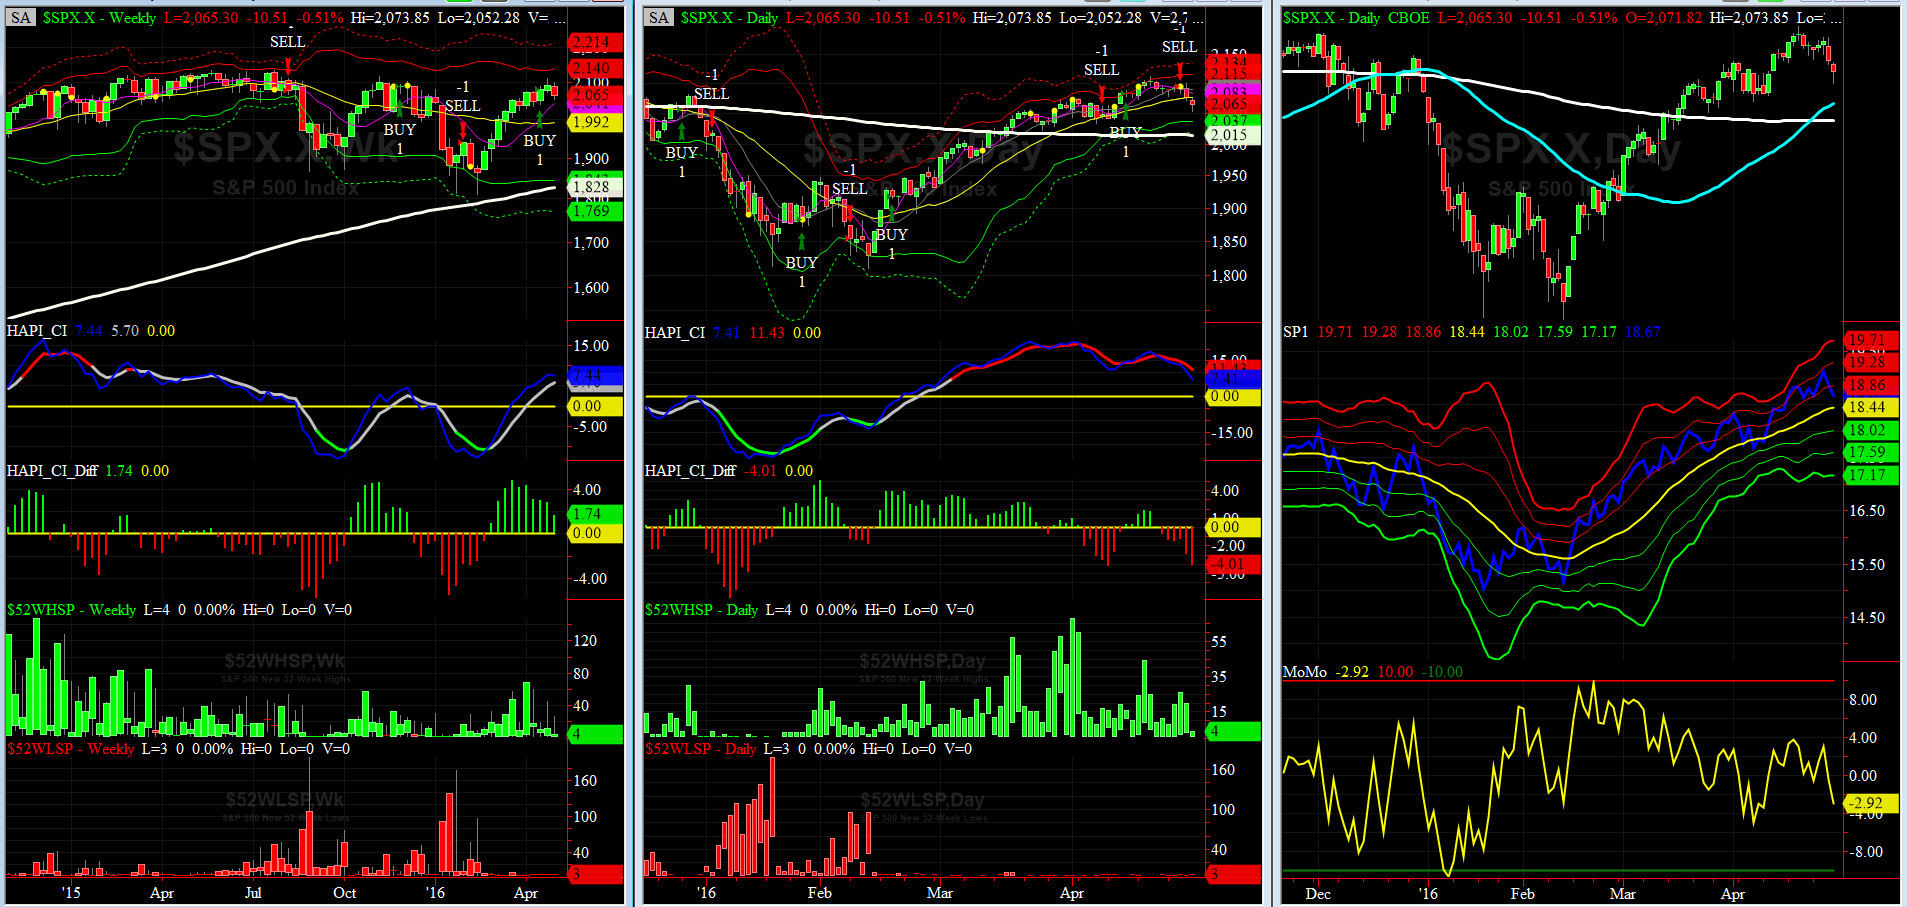
HA_SP1_momo Chart
WEEKLY Timing Model = on a BUY Signal since Friday 4/15/16 CLOSE
DAILY Timing Model = on a SELL Signal since Wednesday 4/27/16 CLOSE
Max SPX 52wk-highs reading last week = 26 (over 120-140, the local maxima is in)
Max SPX 52wk-Lows reading last week = 3 (over 40-60, the local minima is in)
HA_SP1 = between in the zero to +1 sigma channels
HA_Momo = -2.9(reversals most likely occur above +10 or below -10)
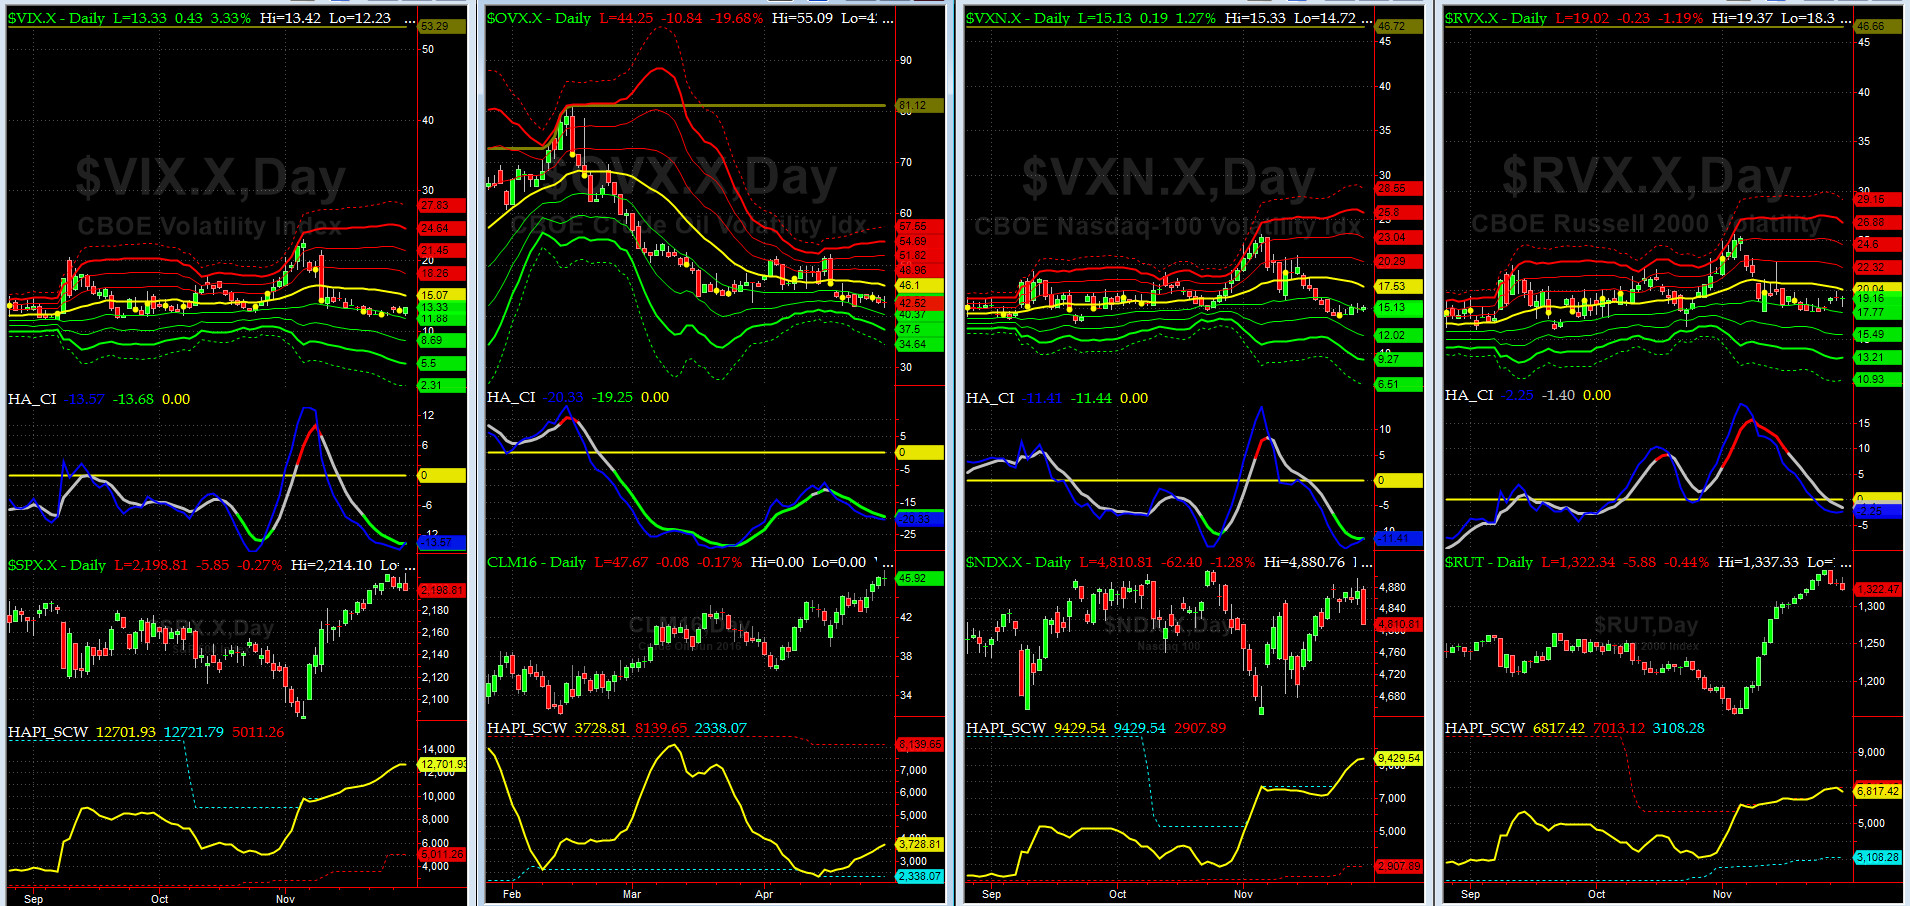
Vol of the Vols Chart
VIX = 15.7 is now at its zero sigma (remember it�s the VIX�s vol pattern (its sigma channels) that matters, and not the level of VIX itself (this is per Dr. Robert Whaley, a great mentor and the inventor of original VIX, now called VXO. VIX usually peaks around a test of its +4 sigma).
The Fear Index hit +3 sigma on Friday and reversed to close at+1 sigma. VXST hit +4 sigma !!!
Monday action is key. Is this a new shockwave, in the progress? who knows.....Techs were thrown out with bathwater.

5-day TRIN & TRINQ Charts
Looking in our rear-view mirror, 5-day TRIN gave a near-perfect SELL signal on April 20 (the day I was visiting Manhattan for my school function). Now both TRINs are very NEUTRAL.
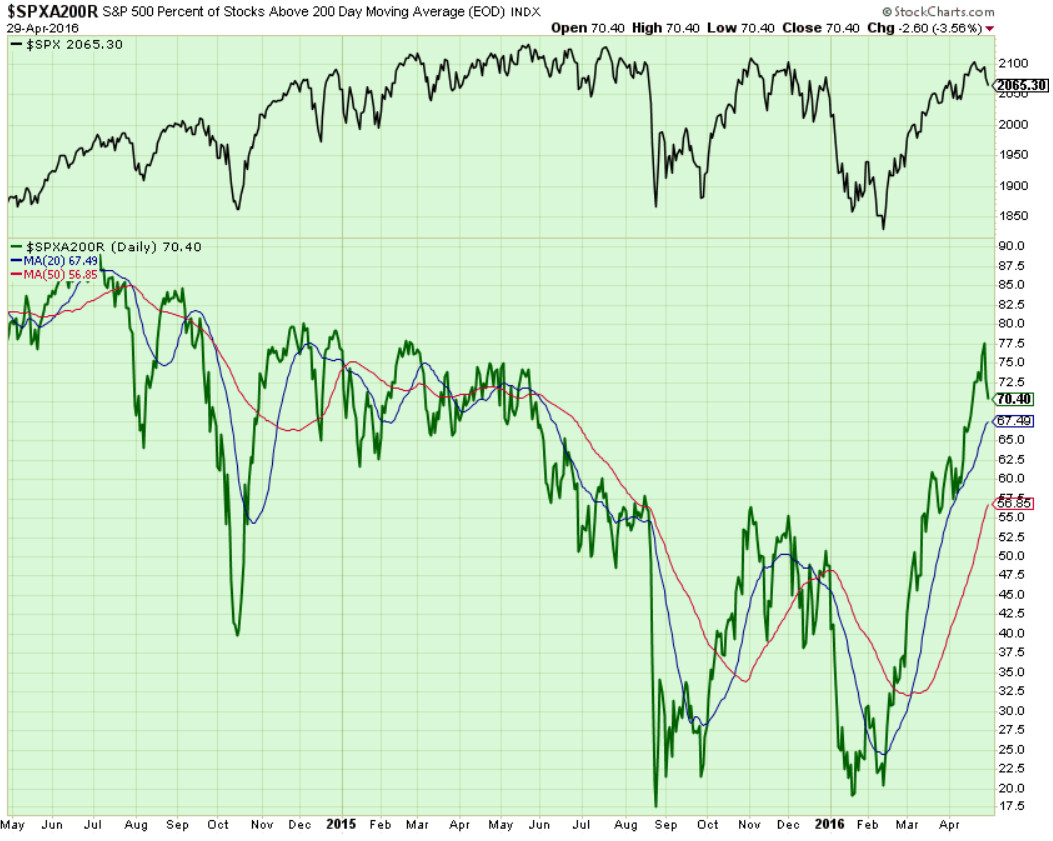
Components of SPX above their respective 200day MA Chart
BREAK OUT....BREAK OUT.....
This past week, this scoring indicator jumped to 74% in a SIDEWAY price action & neared the top of our target zone discussed here last week (72% to 75%). This is BULLISH.
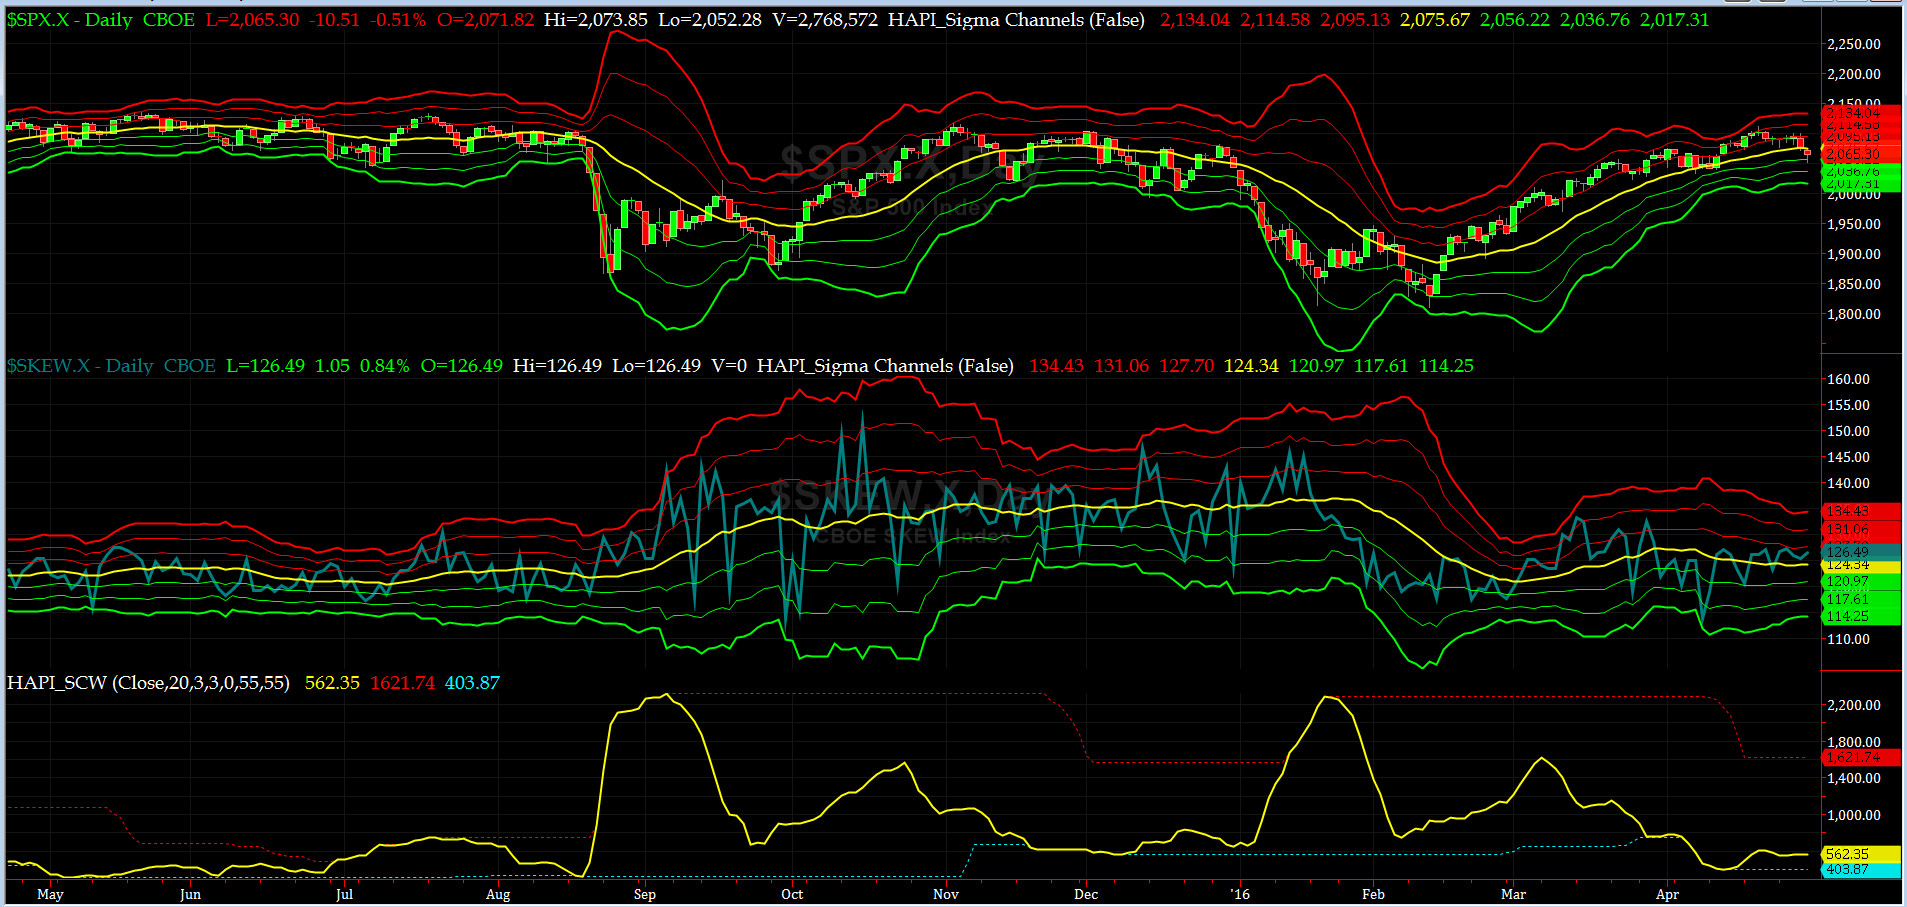
SPX SKEW (Tail Risk) Chart
SPX SKEW (Tail Risk) = 126 and still near its 0 sigma (normal = 120-125, range 100-150)
All Quiet on the Mid-Western Front? All Problems Solved, all of a sudden? Problems, we have no problems!!! And, if any, they will be solved shortly by either a certain Billionaire or a certain Millionaire (if she does not get convicted by DoJ/FBI first).... ROFLOL

3-month VIX Futures Spread(VX) Chart
Our 3-month VIX Futures Spread (LONG MAY16 & SHORT AUG16) closed at -3.22 on Friday. We should be near a local minima.
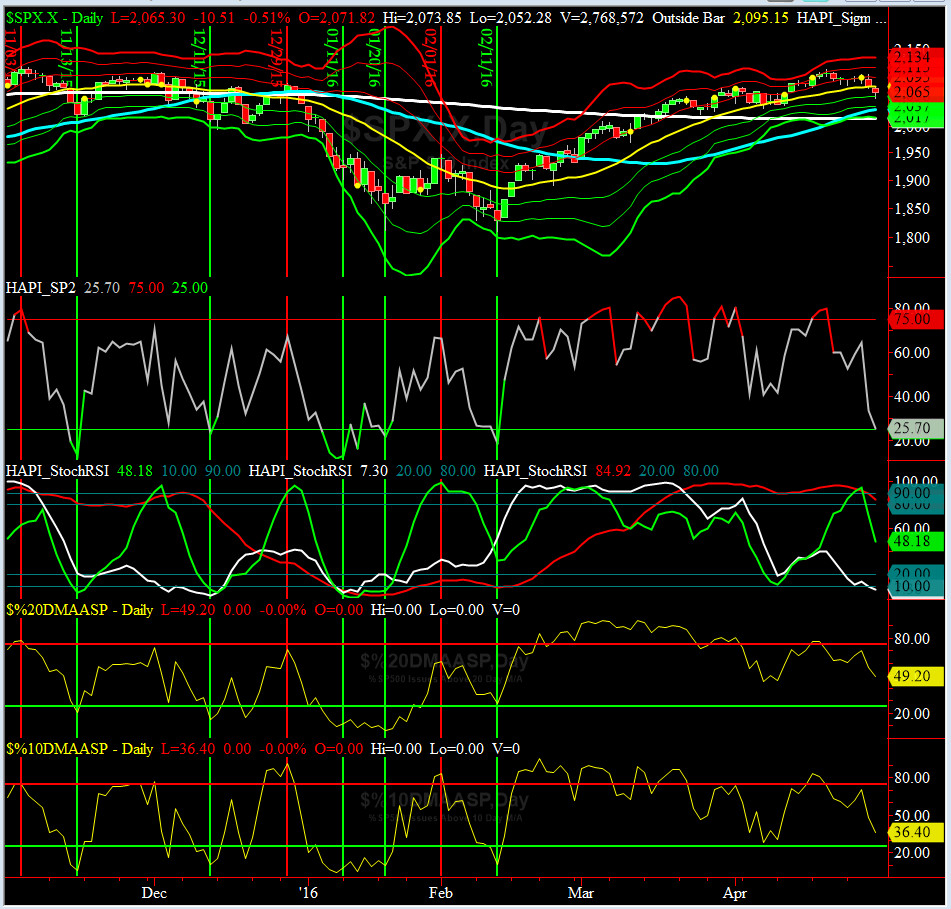
HA_SP2 Chart
HA_SP2 = 25.7 (Buy signal <= 25, Sell Signal >= 75)
At ~25, this prop indicator says we are in a BUY zone.
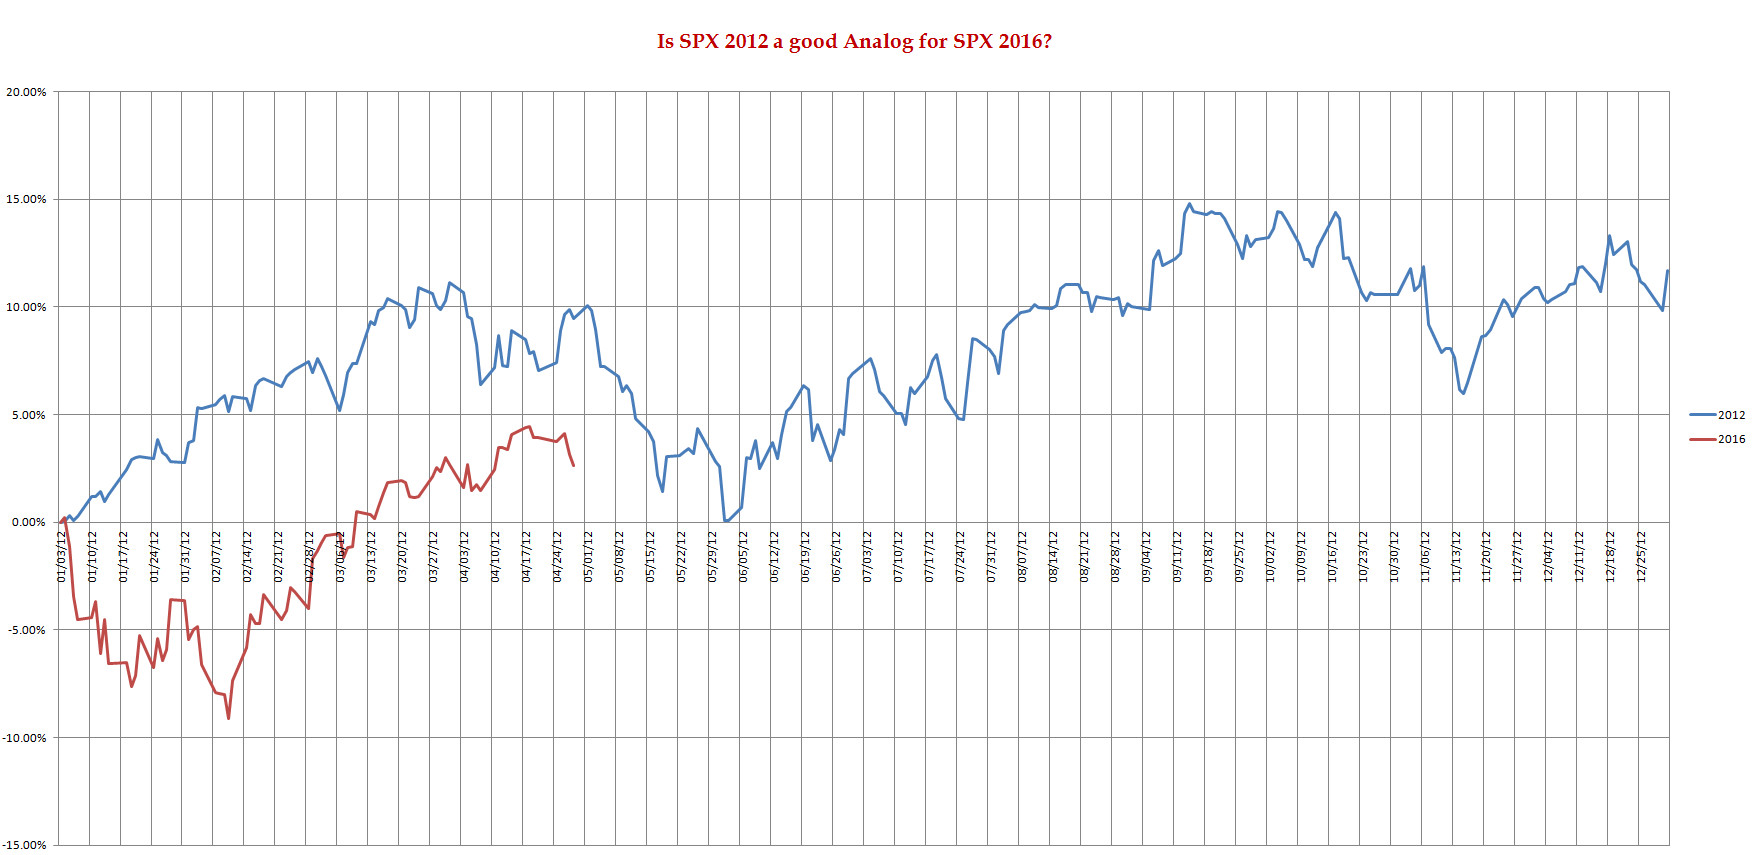
SPX 2012 Analog for SPX 2016
Based on this Analog, it looks to us that we may see a reversal in early-May. Is that certain? Of course NOT. The question remains: what will be the catalyst? who knows, stay tuned sailor......
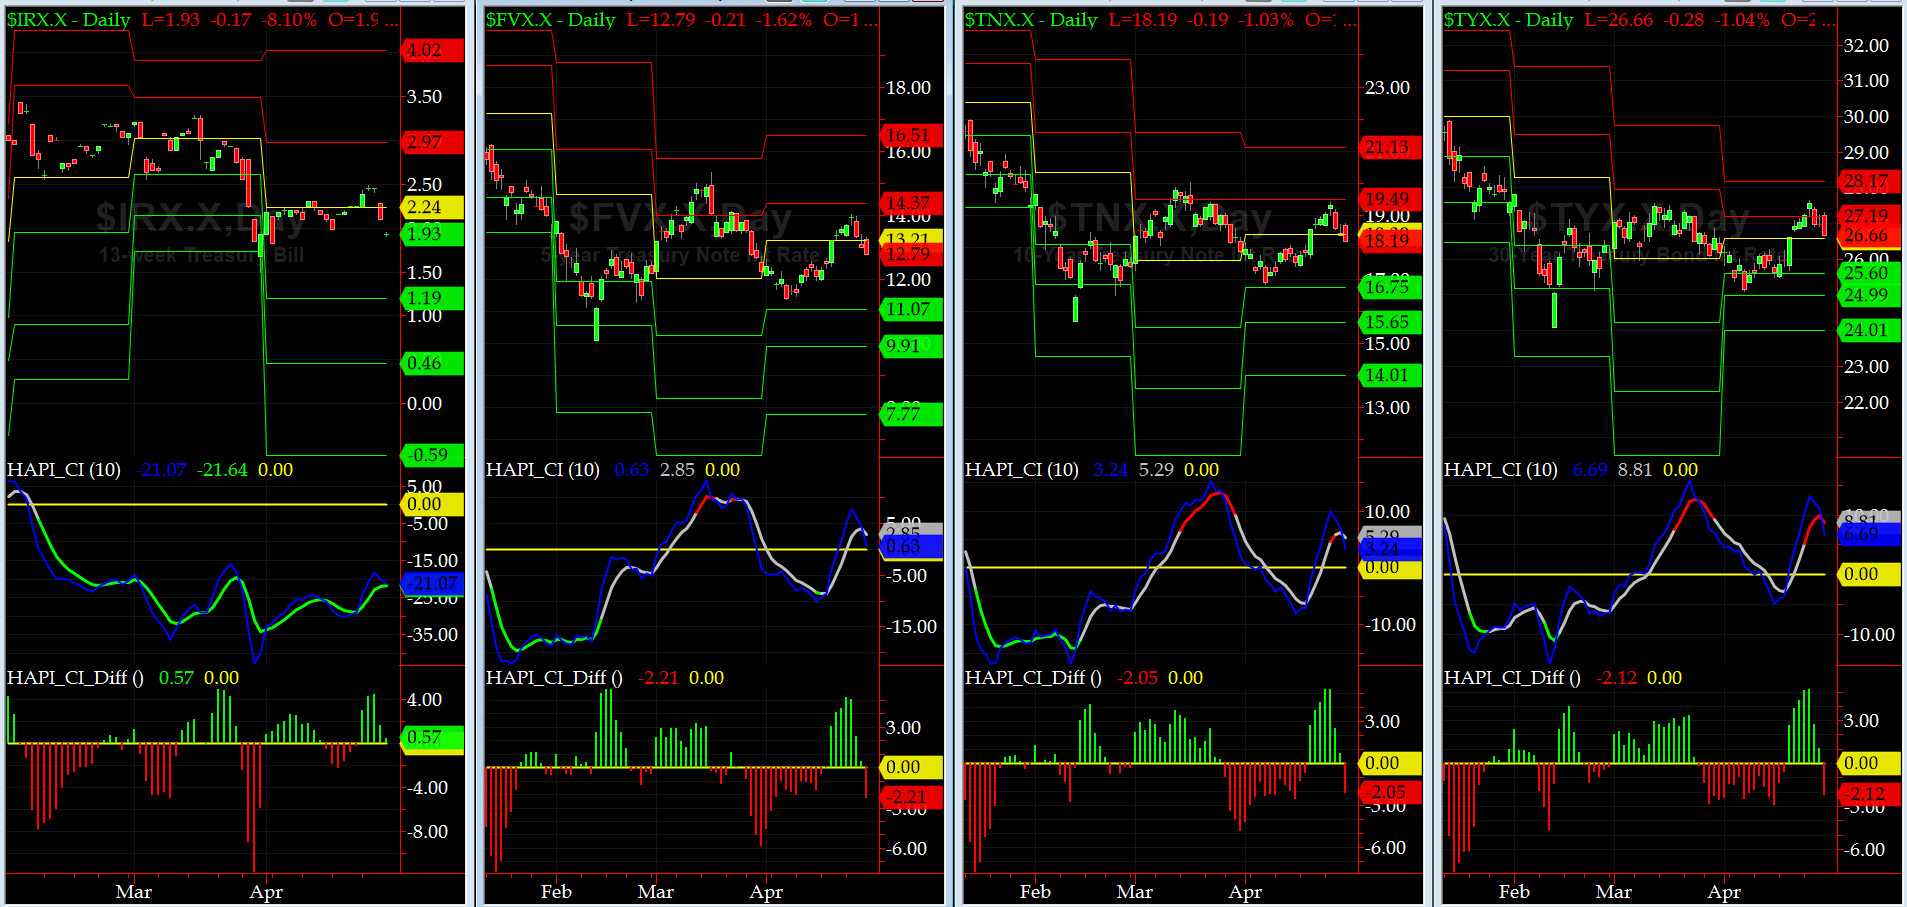
US Treasury T-Notes & T-Bonds Yields Chart
This past week, US Treasury Yield Curve jumped over their respective Monthly Pivots and thus no signal here either.
Fari Hamzei
|


 Proactive Market Timing