|
Monday, May 16, 2016 0800ET
Market Timing Charts, Analysis & Commentary for Issue #142
Timer Charts of S&P-500 Cash Index (SPX) + NASDAQ-100 Cash Index (NDX)
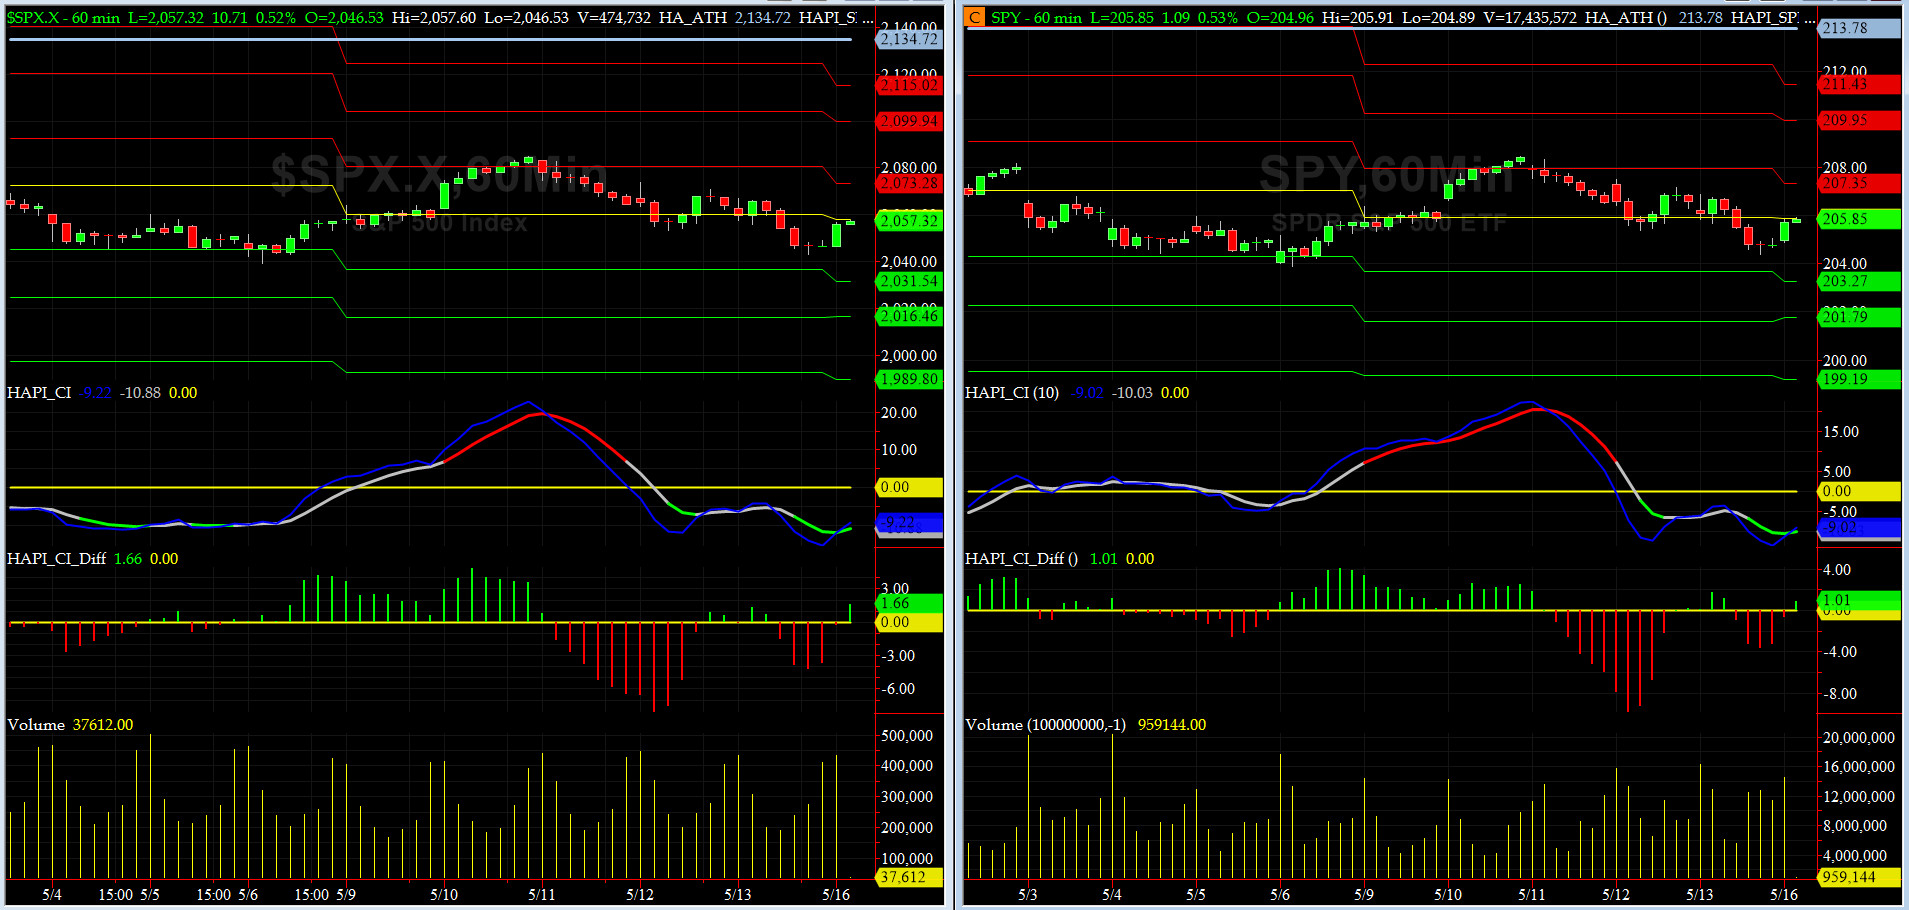
Most recent S&P-500 Cash Index (SPX): 2046.61 down -10.53 (down -0.5%) for the week ending on Friday, May 13th, 2016, which closed just about its -2 sigma.
SPX ALL TIME INTRADAY HIGH = 2134.72 (reached on Wednesday, May 20th, 2015)
SPX ALL TIME CLOSING HIGH = 2130.82 (reached on Thursday, May 21st, 2015)
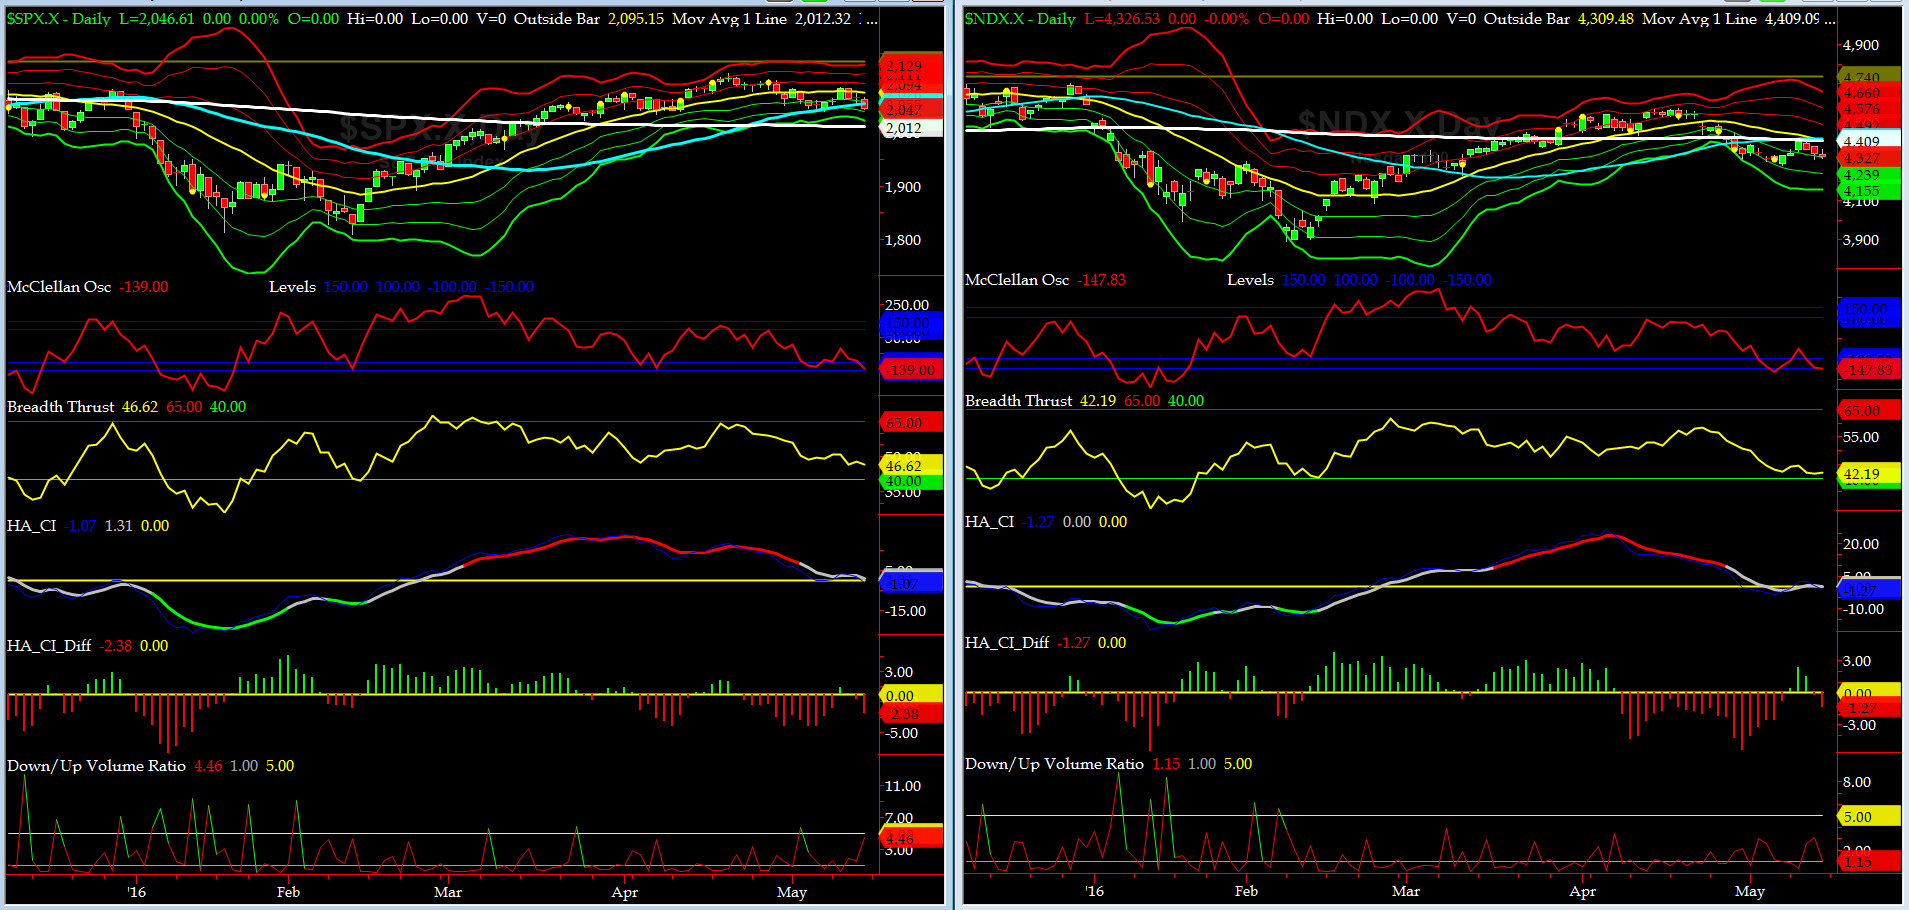
Current DAILY +2 Sigma SPX = 2111 with WEEKLY +2 Sigma = 2144
Current DAILY 0 Sigma (20 day MA) SPX = 2076 with WEEKLY 0 Sigma = 1994
Current DAILY -2 Sigma SPX = 2040 with WEEKLY -2 Sigma = 1844
NYSE McClellan Oscillator = -139 (-150 is start of the O/S area; around -275 to -300 area or lower, we go into the �launch-pad� mode, over +150, we are in O/B area)
NYSE Breadth Thrust = 46.6 (40 is considered as oversold and 65 as overbought)
SPX has put 2 lower highs since its most recent peak on April 20th. Look at Down to Up Volume Spike (almost near 5 to 1, but diverging from its May 3rd low).
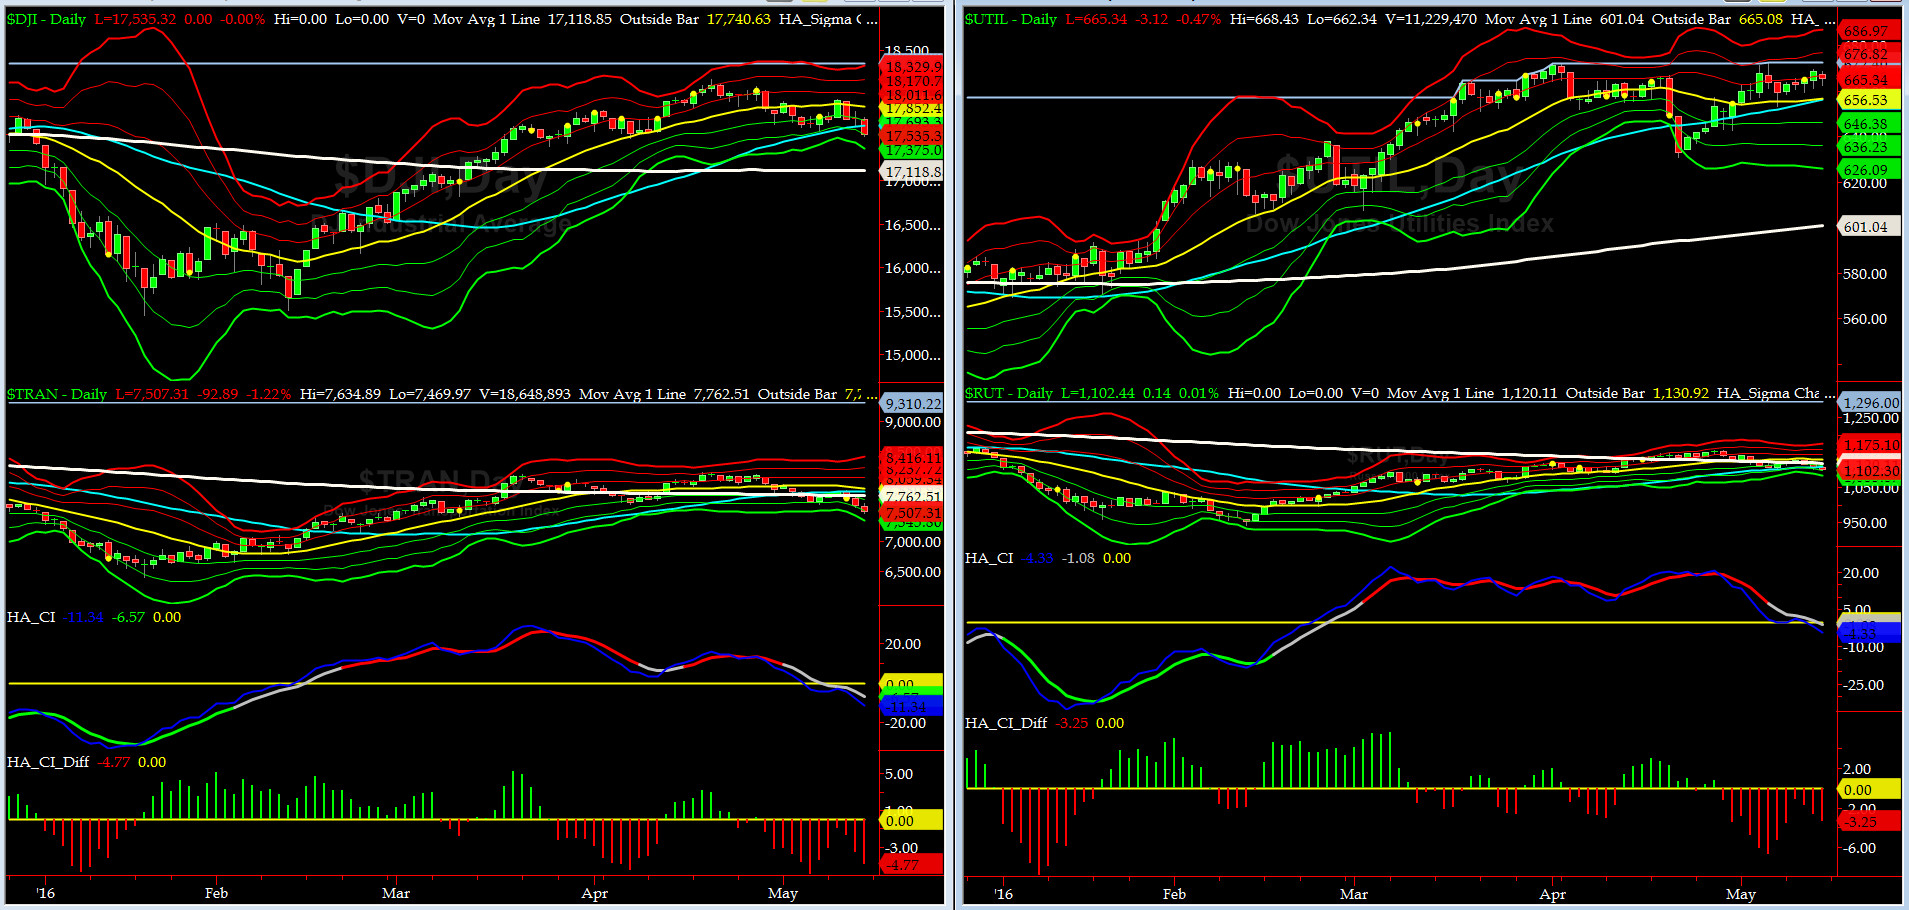
Canaries [in the Coal Mine] Chart for DJ TRAN & RUT Indices
200-Day MA DJ TRAN = 7762 or 3.3% above DJ TRAN (max observed in last 5 yrs = 20.2%, min = -20.3%)
200-Day MA RUT = 1120 or 1.6% above RUT (max observed in last 5 yrs = 21.3%, min = -22.6%)
DJ Transports (proxy for economic conditions 6 to 9 months hence) have dropped very hard in the last 3 sessions. We could have a game changer here at hand (discussed here before, and only time will tell).
Russell 2000 Small Caps (proxy for RISK ON/OFF) also sold in last few sessions but not as hard.
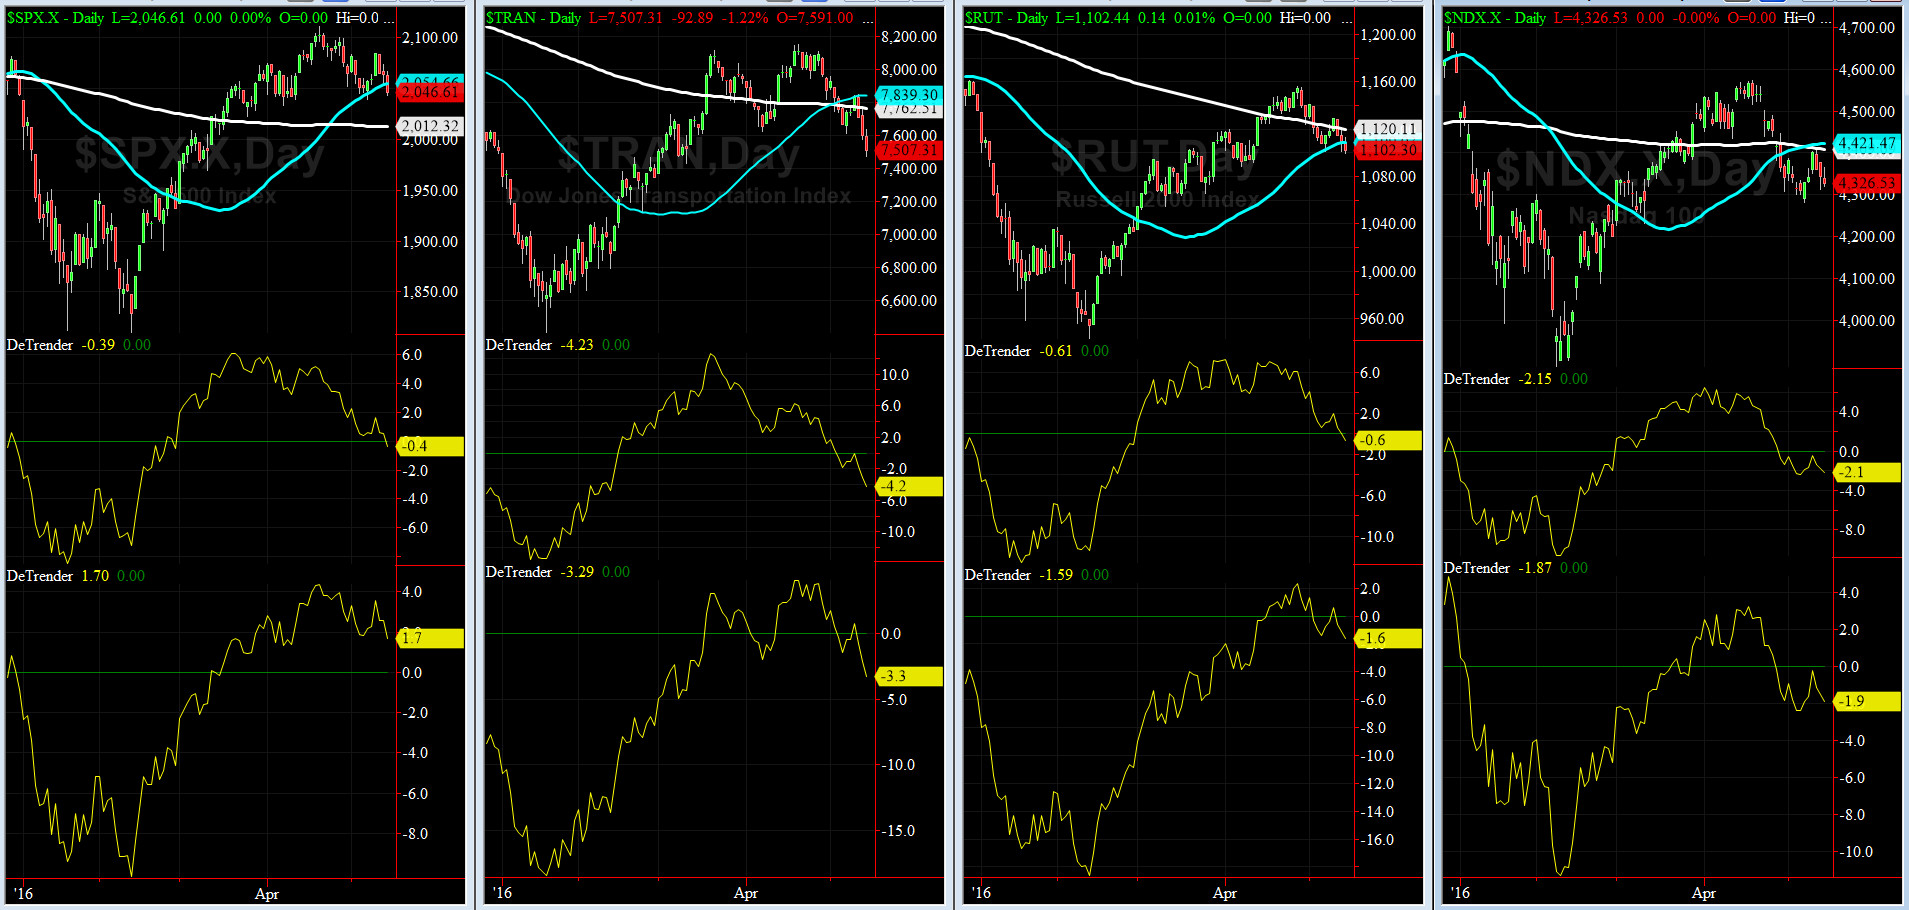
DeTrenders Charts for SPX, NDX, TRAN & RUT Indices
50-Day MA SPX = 2054 or -0.4% above SPX (max observed in last 5 yrs = +8.6%, min = -9.3%)
200-Day MA SPX = 2012 or +1.7% below SPX (max observed in last 5 yrs = 15.2%, min = -14%)
This week, SEVEN of our Eight DeTrenders are NEGTIVE now, as all four of our major indices are off their recent highs.
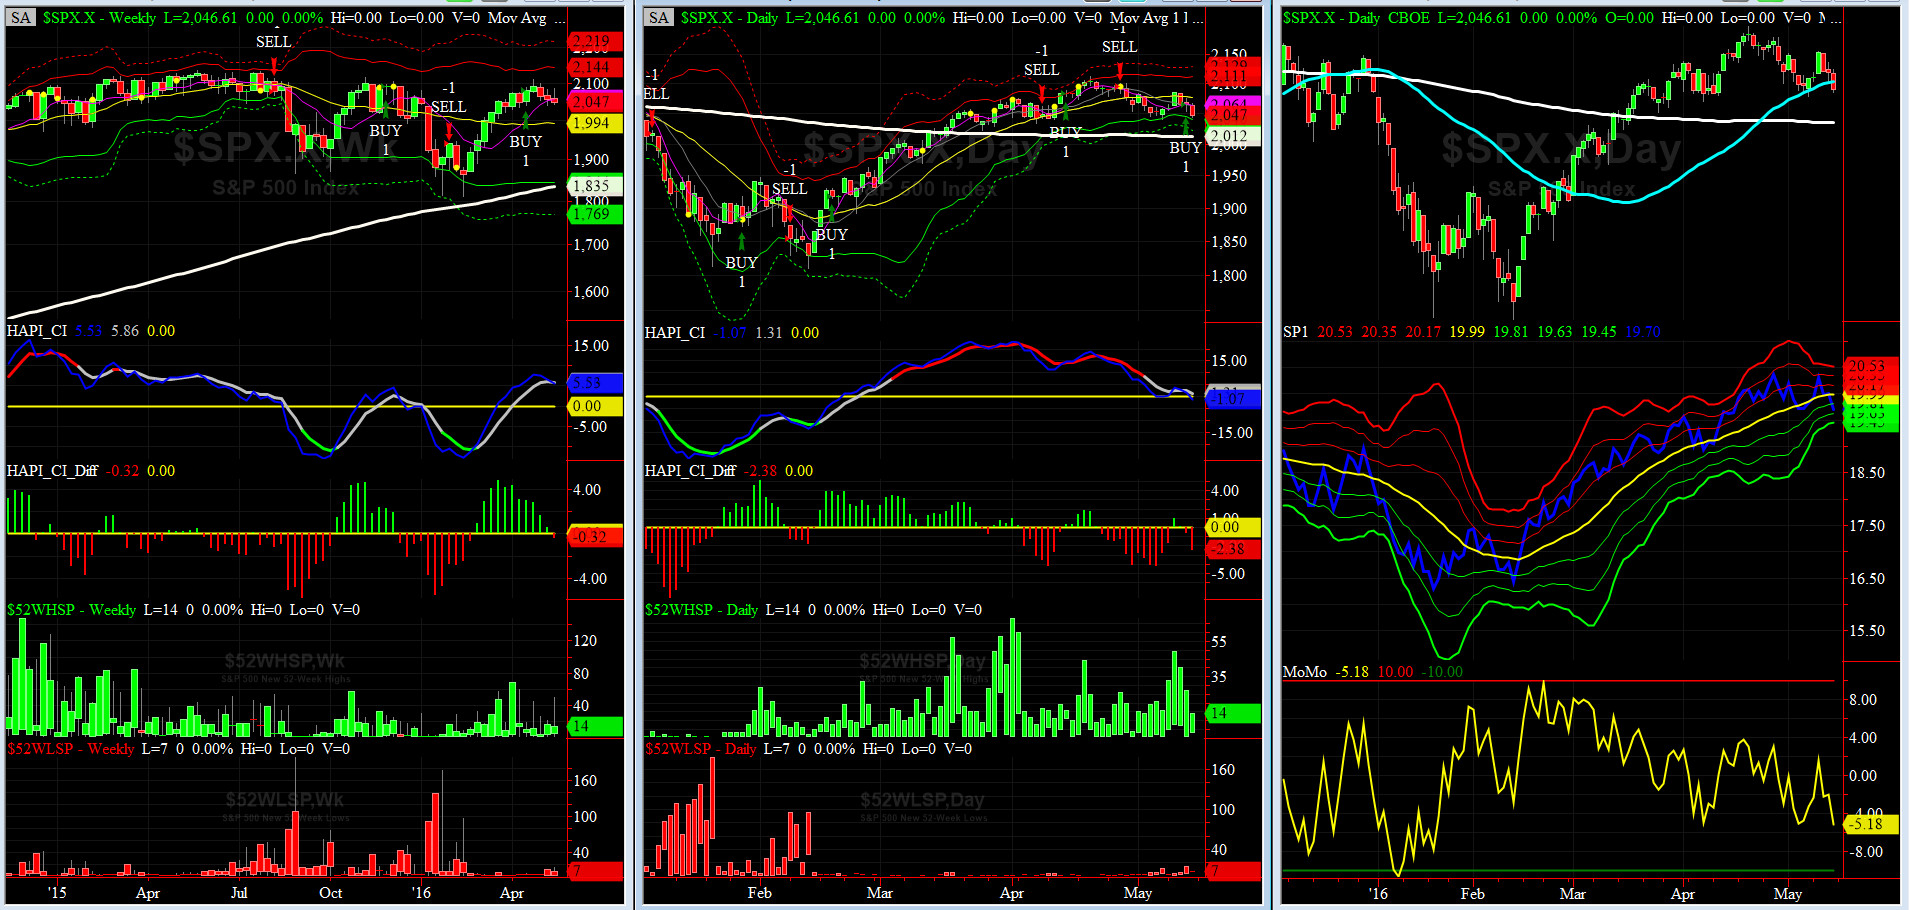
HA_SP1_momo Chart
WEEKLY Timing Model = on a BUY Signal since Friday 4/15/16 CLOSE
DAILY Timing Model = on a BUY Signal since Thursday 5/12/16 CLOSE
Max SPX 52wk-highs reading last week = 49 (over 120-140, the local maxima is in)
Max SPX 52wk-Lows reading last week = 25 (over 40-60, the local minima is in)
HA_SP1 = at about its -2 sigma channels
HA_Momo = -5.2(reversals most likely occur above +10 or below -10)
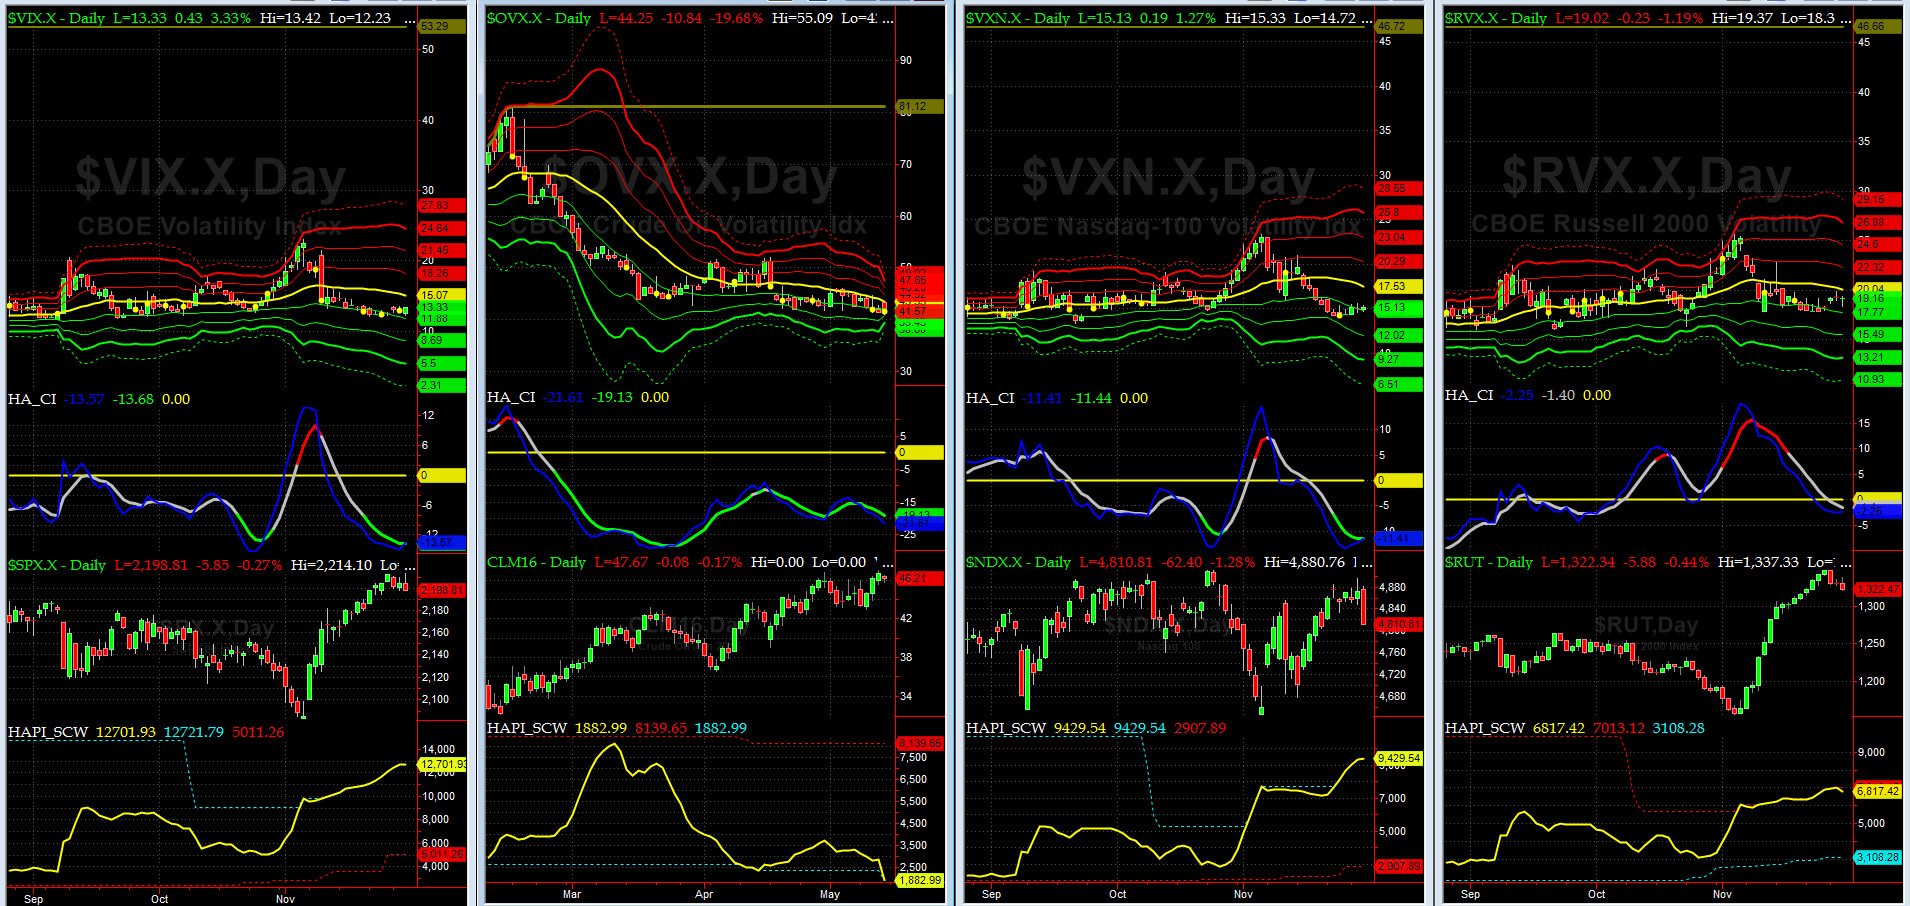
Vol of the Vols Chart
VIX = 15.04 is now at +1 sigma (remember it�s the VIX�s vol pattern (its sigma channels) that matters, and not the level of VIX itself (this is per Dr. Robert Whaley, a great mentor and the inventor of original VIX, now called VXO. VIX usually peaks around a test of its +4 sigma).
Our beloved Fear Index is docile here!!!
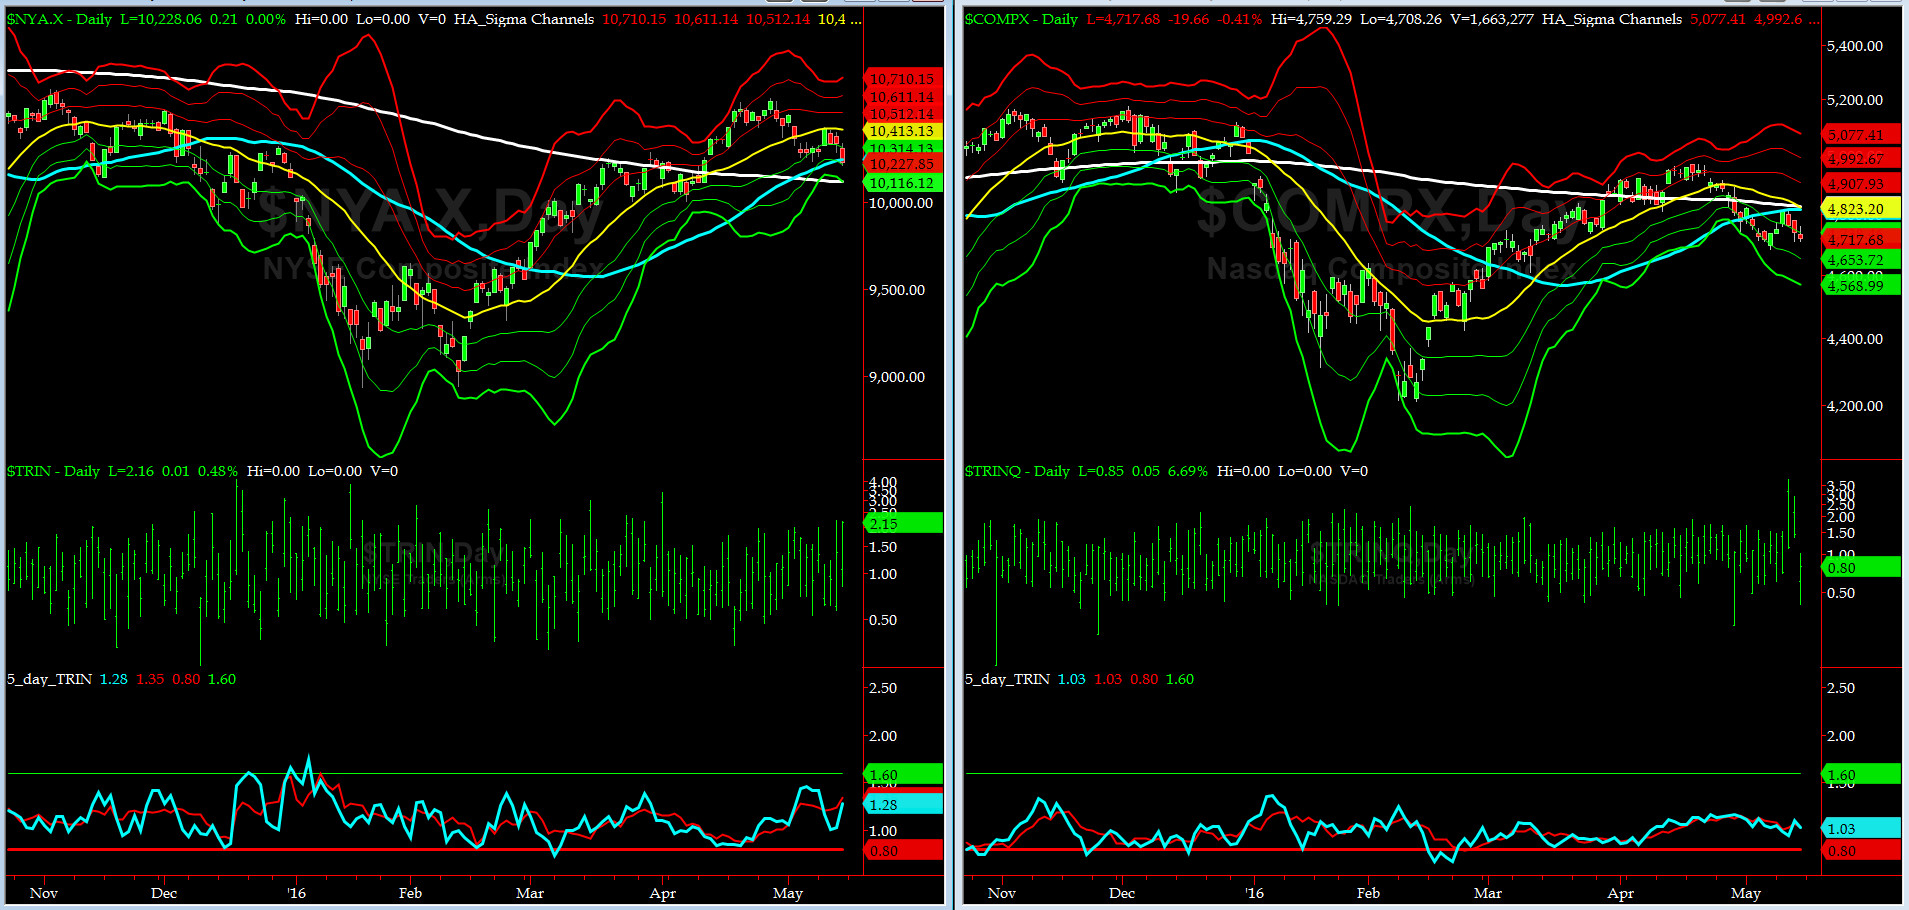
5-day TRIN & TRINQ Charts
Both 5-day TRINs remain very NEUTRAL here.

Components of SPX above their respective 200day MA Chart
In the past 2 weeks, this scoring indicator, has dropped 10 percent from 74% to 64%. If it cannot find support at 60%-62% zone, then a move down to at least 50% cannot be ruled out.
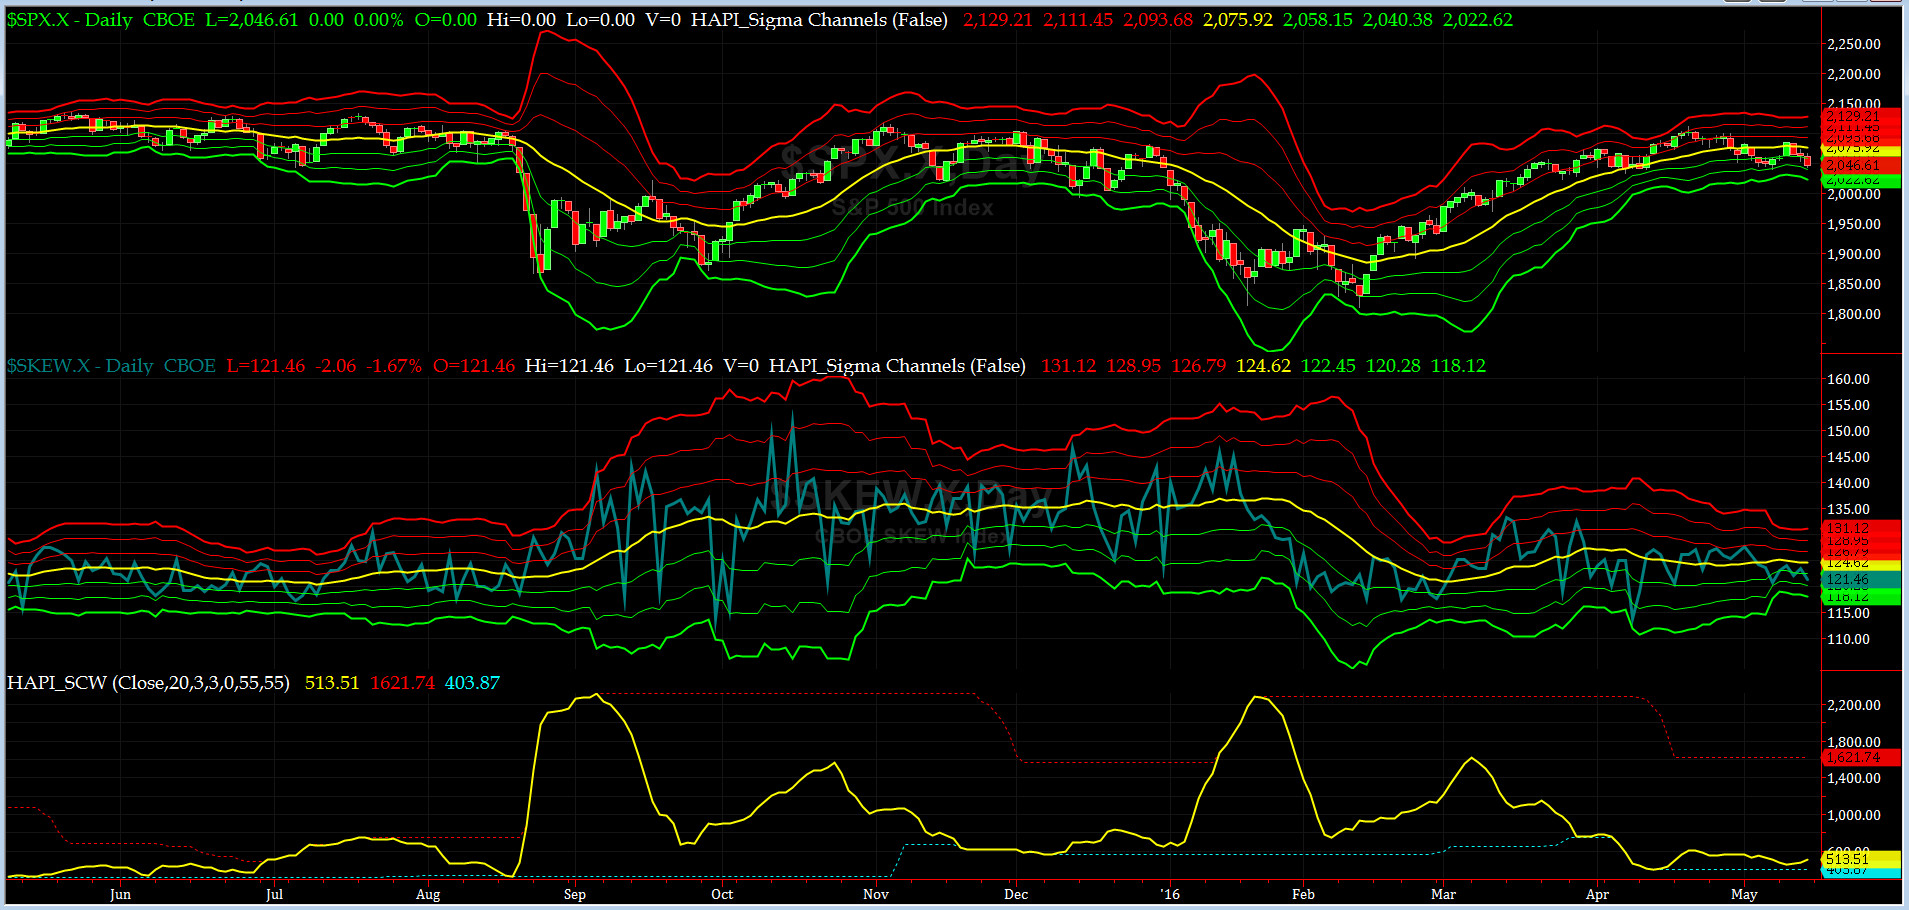
SPX SKEW (Tail Risk) Chart
SPX SKEW (Tail Risk) = 124 and still near its 0 sigma (normal = 120-125, range 100-150)
All Quiet on the Mid-Western Front? All Problems Solved, all of a sudden? Problems? we have no problems!!! Have more green tea.

3-month VIX Futures Spread(VX) Chart
Our 3-month VIX Futures Spread (LONG MAY16 & SHORT AUG16) is trading near -3.6 early Monday morning (pre-open). We should be near a local minima.
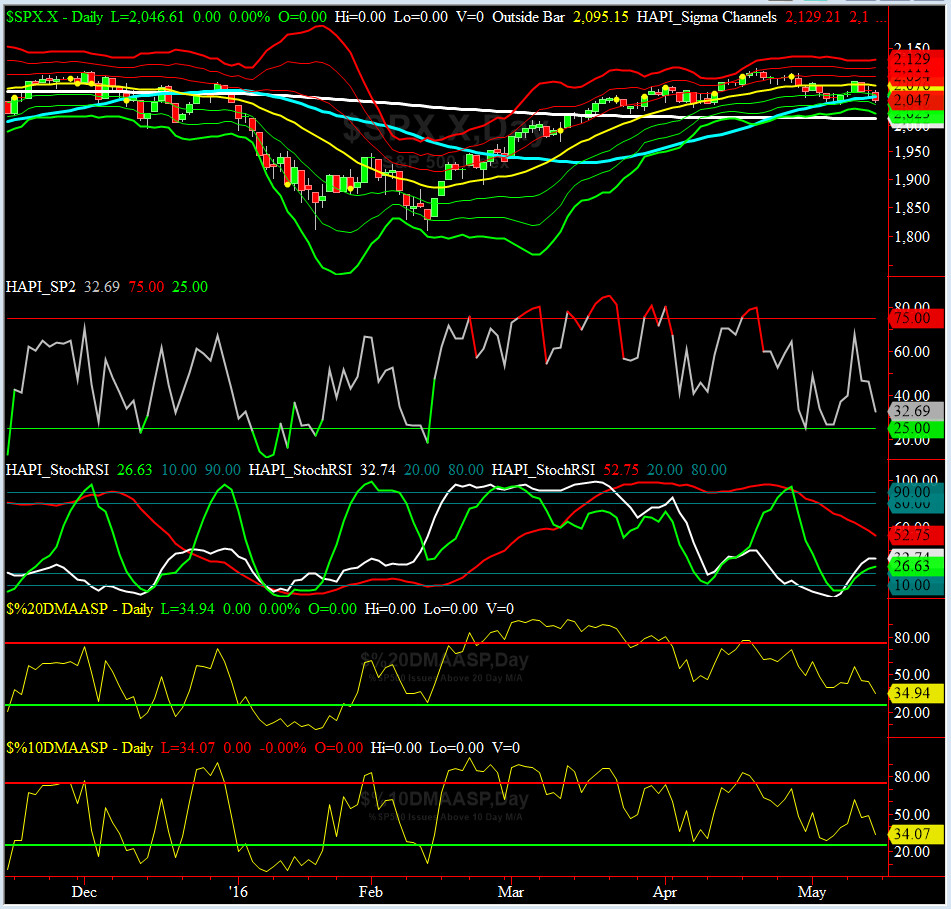
HA_SP2 Chart
HA_SP2 = 32.7 (Buy signal <= 25, Sell Signal >= 75)
At ~32, this prop indicator is neutral but notice it has put in a bullish divergence with price.
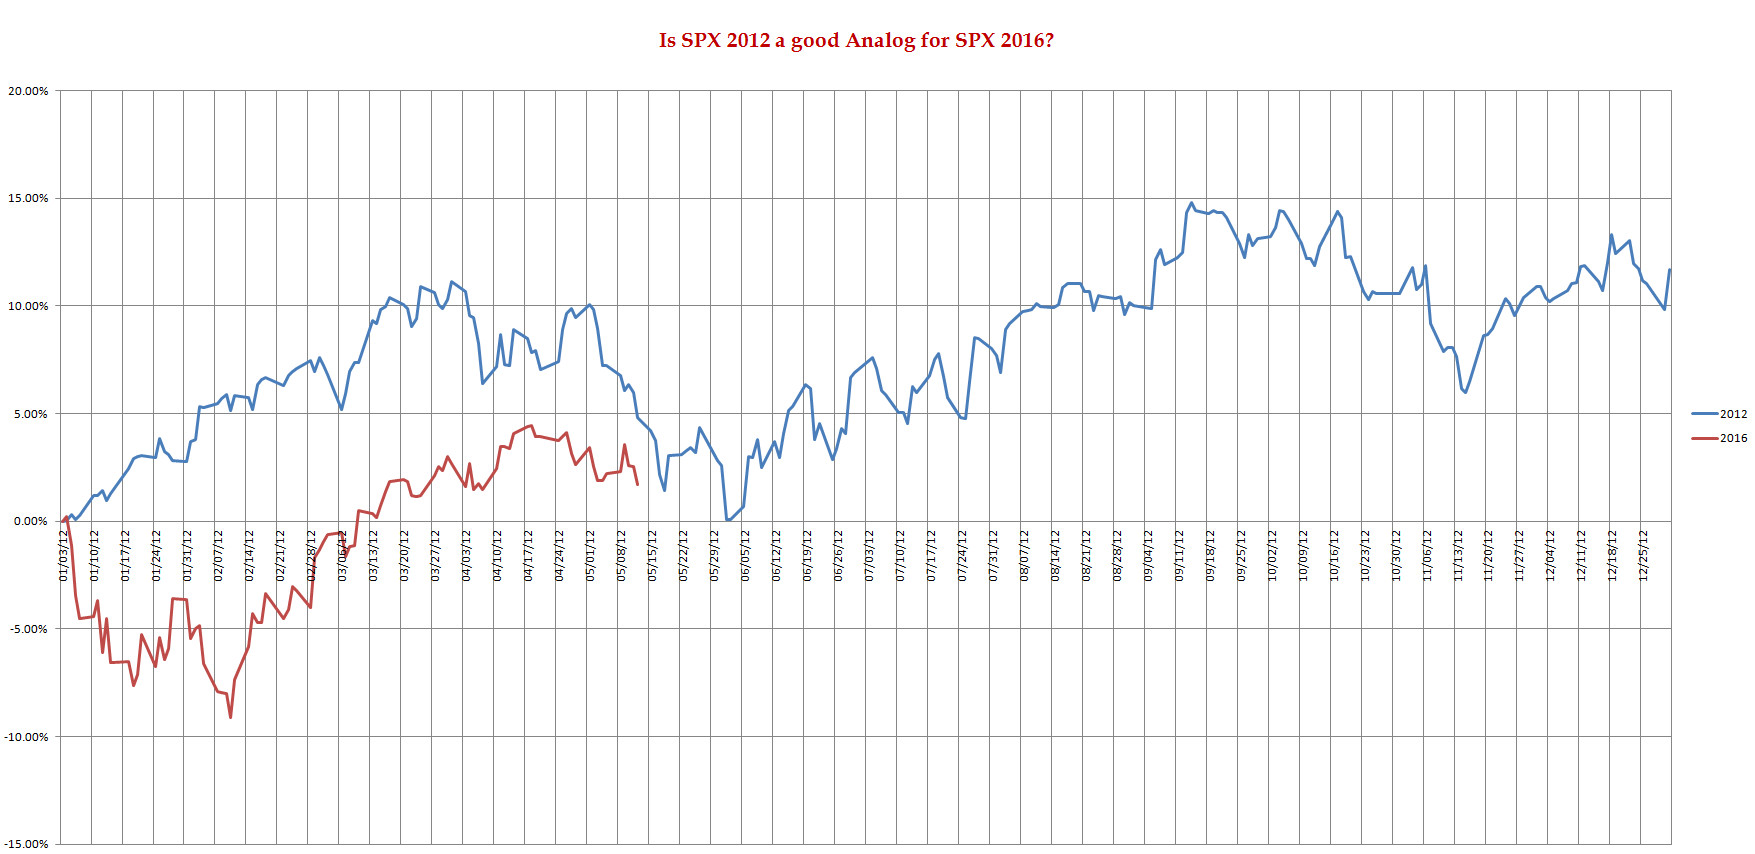
SPX 2012 Analog for SPX 2016
Based on this Analog, it looks to us that we may have already seen the reversal in early-May. Here is the challange: we have a few analogs and moves are, so far too small, percentage wise. To pick which one BEST represents the Market this year, it is a very tough call right now.
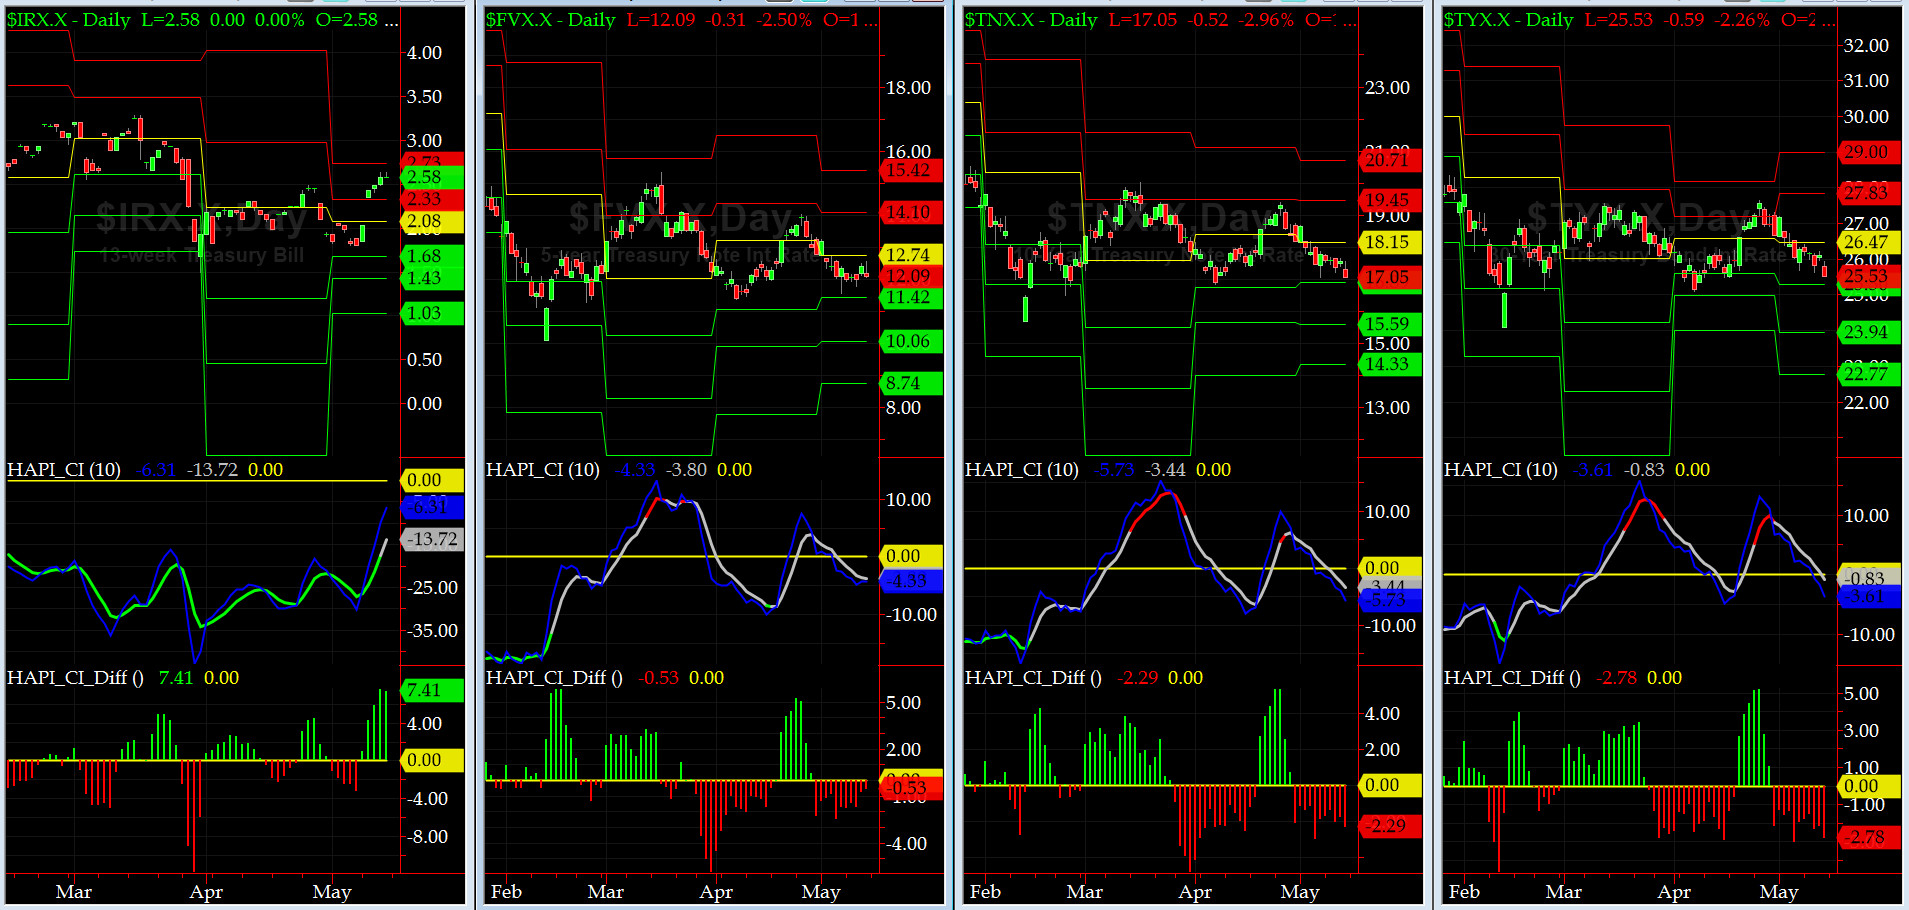
US Treasury T-Notes & T-Bonds Yields Chart
This past week, the front-end of US Treasury Yield Curve jumped over its Monthly Pivot while the mid to long-end dropped below its Monthly Pivots, overall seeing not much excitement in the Treasury Markets.
Fari Hamzei
|


 Proactive Market Timing