|
Saturday, May 21, 2016 2030ET
Market Timing Charts, Analysis & Commentary for Issue #143
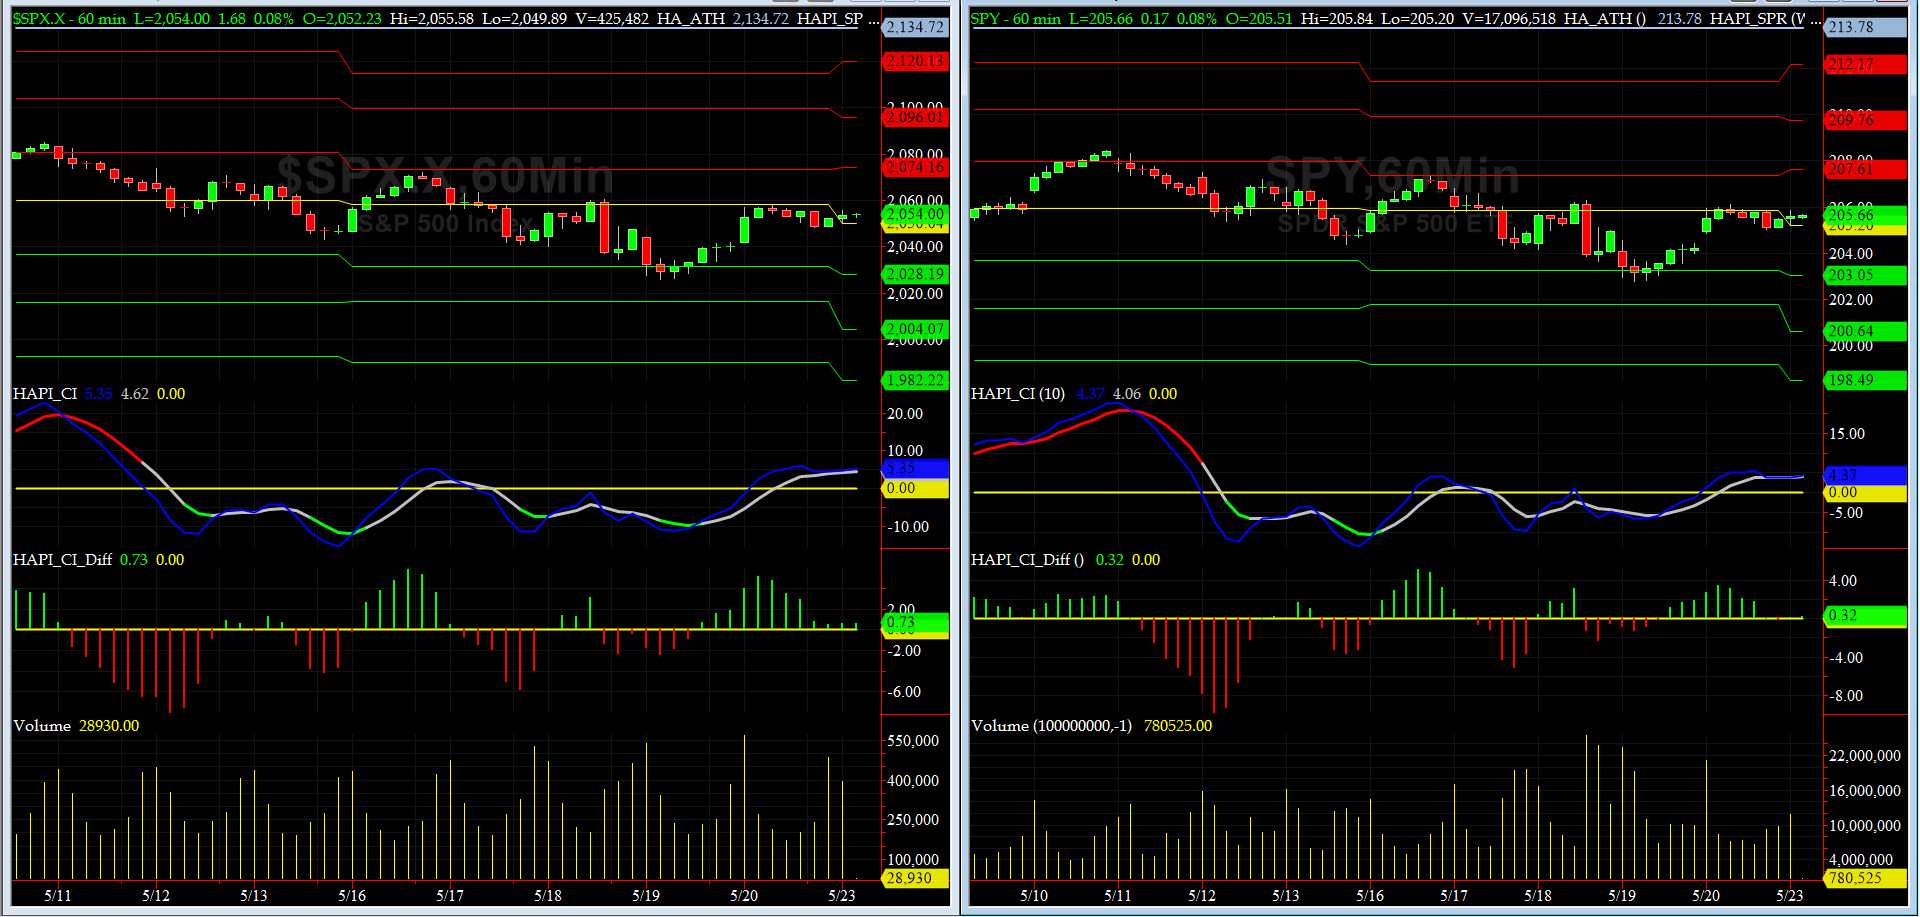
Timer Charts of S&P-500 Cash Index (SPX) + NASDAQ-100 Cash Index (NDX)
Most recent S&P-500 Cash Index (SPX): 2052.32 up +5.39 (up +0.26%) for the week ending on Friday, May 20th, 2016, which closed just below its 50-bar MA & zero sigma.
SPX ALL TIME INTRADAY HIGH = 2134.72 (reached on Wednesday, May 20th, 2015)
SPX ALL TIME CLOSING HIGH = 2130.82 (reached on Thursday, May 21st, 2015)
Current DAILY +2 Sigma SPX = 2097 with WEEKLY +2 Sigma = 2145
Current DAILY 0 Sigma (20 day MA) SPX = 2065 with WEEKLY 0 Sigma = 1994
Current DAILY -2 Sigma SPX = 2032 with WEEKLY -2 Sigma = 1844
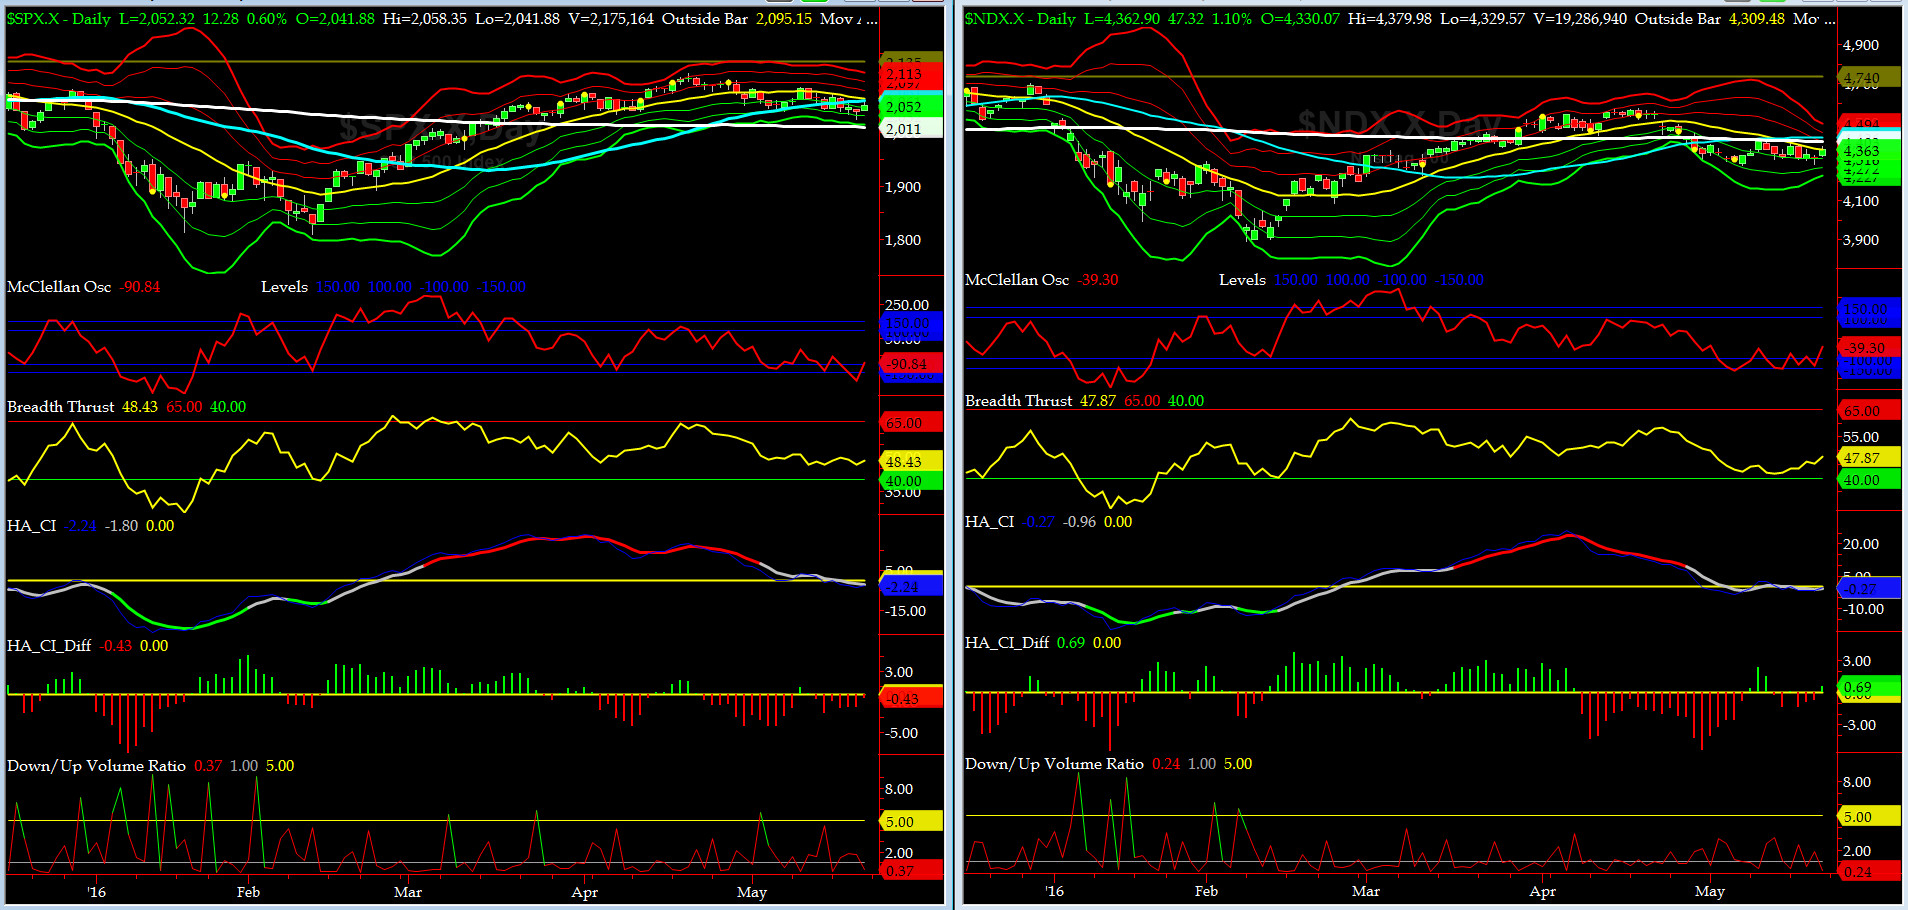
NYSE McClellan Oscillator = -91 (-150 is start of the O/S area; around -275 to -300 area or lower, we go into the �launch-pad� mode, over +150, we are in O/B area)
NYSE Breadth Thrust = 48.4 (40 is considered as oversold and 65 as overbought)
With crushed vols, SPX is the darling of the ROMANs (Sausage Makers) for all but 1 to 2 hrs of each trading day. If you look at our archives, you will notice the WEEKLY SPX Sigma Levels have hardly changed in the last 7 weeks!!
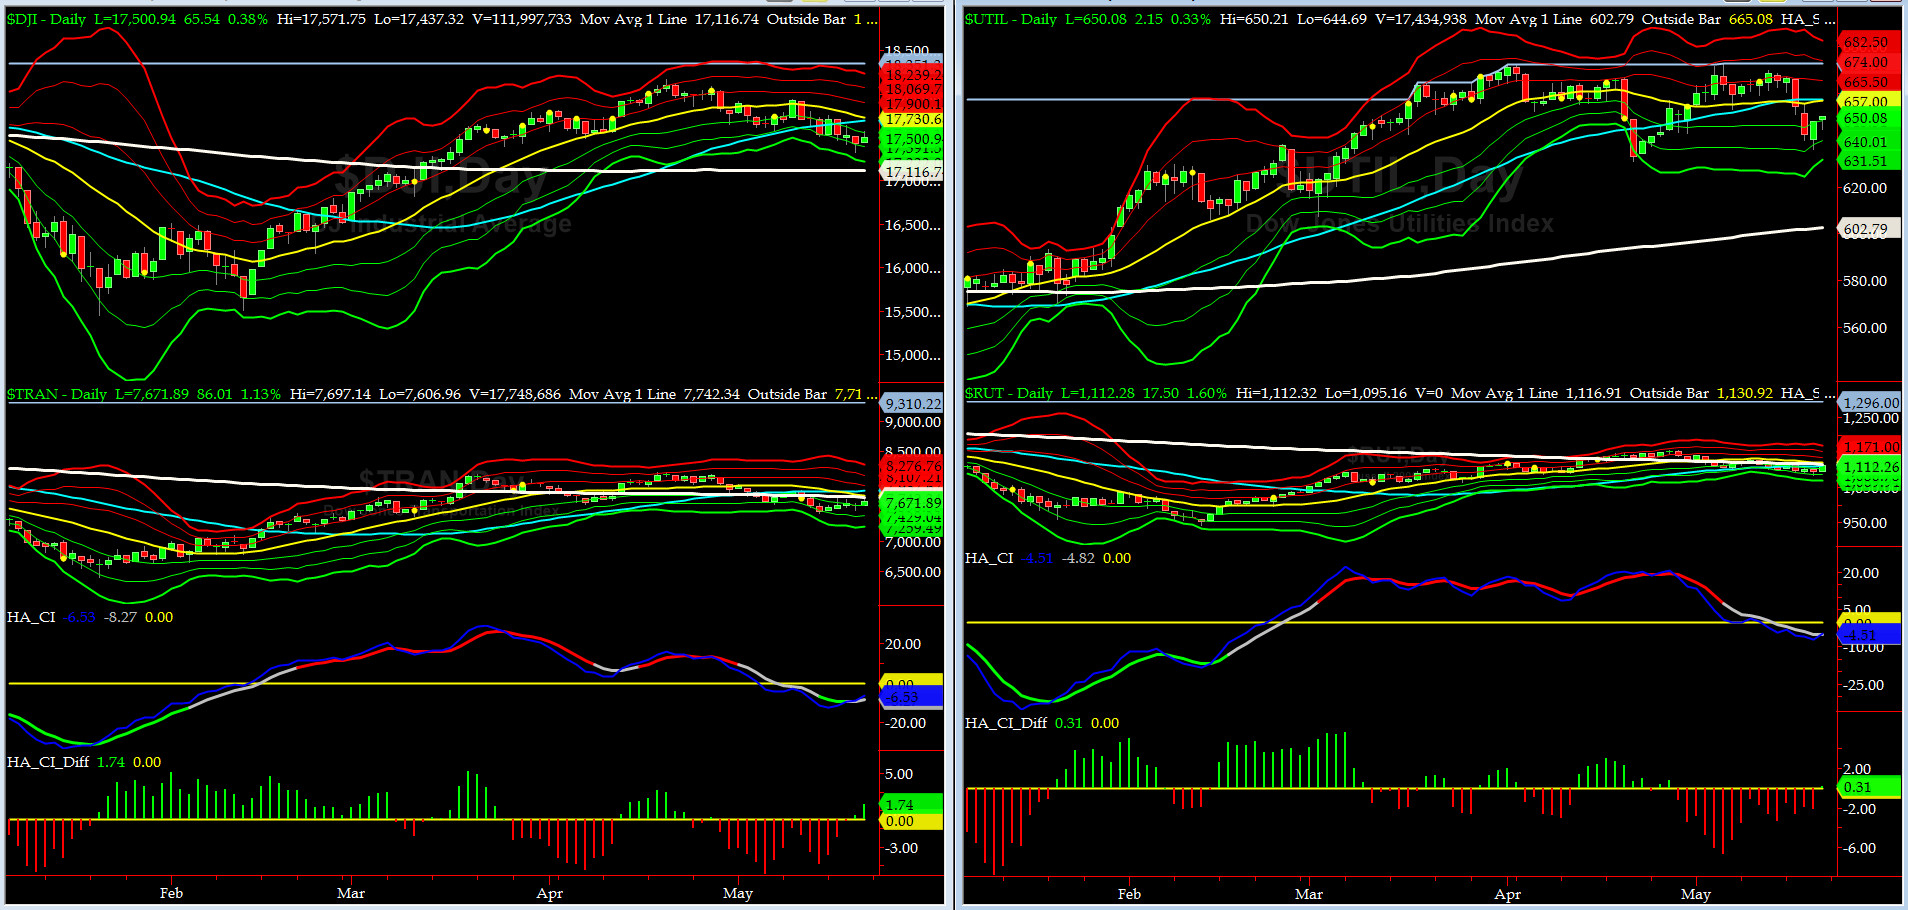
Canaries [in the Coal Mine] Chart for DJ TRAN & RUT Indices
200-Day MA DJ TRAN = 7742 or 0.9% above DJ TRAN (max observed in last 5 yrs = 20.2%, min = -20.3%)
200-Day MA RUT = 1127 or 0.4% above RUT (max observed in last 5 yrs = 21.3%, min = -22.6%)
DJ Transports (proxy for economic conditions 6 to 9 months hence) reversed and rose a tad but still below its 200 day MA.
Russell 2000 Small Caps (proxy for RISK ON/OFF) is about to cross both its 50 & 200 bar MAs.

DeTrenders Charts for SPX, NDX, TRAN & RUT Indices
50-Day MA SPX = 2054 or -0.4% above SPX (max observed in last 5 yrs = +8.6%, min = -9.3%)
200-Day MA SPX = 2012 or +1.7% below SPX (max observed in last 5 yrs = 15.2%, min = -14%)
This week, SIX of our Eight DeTrenders are NEGTIVE now, but most DTs should go up further once SPX heads up to challange 2100.
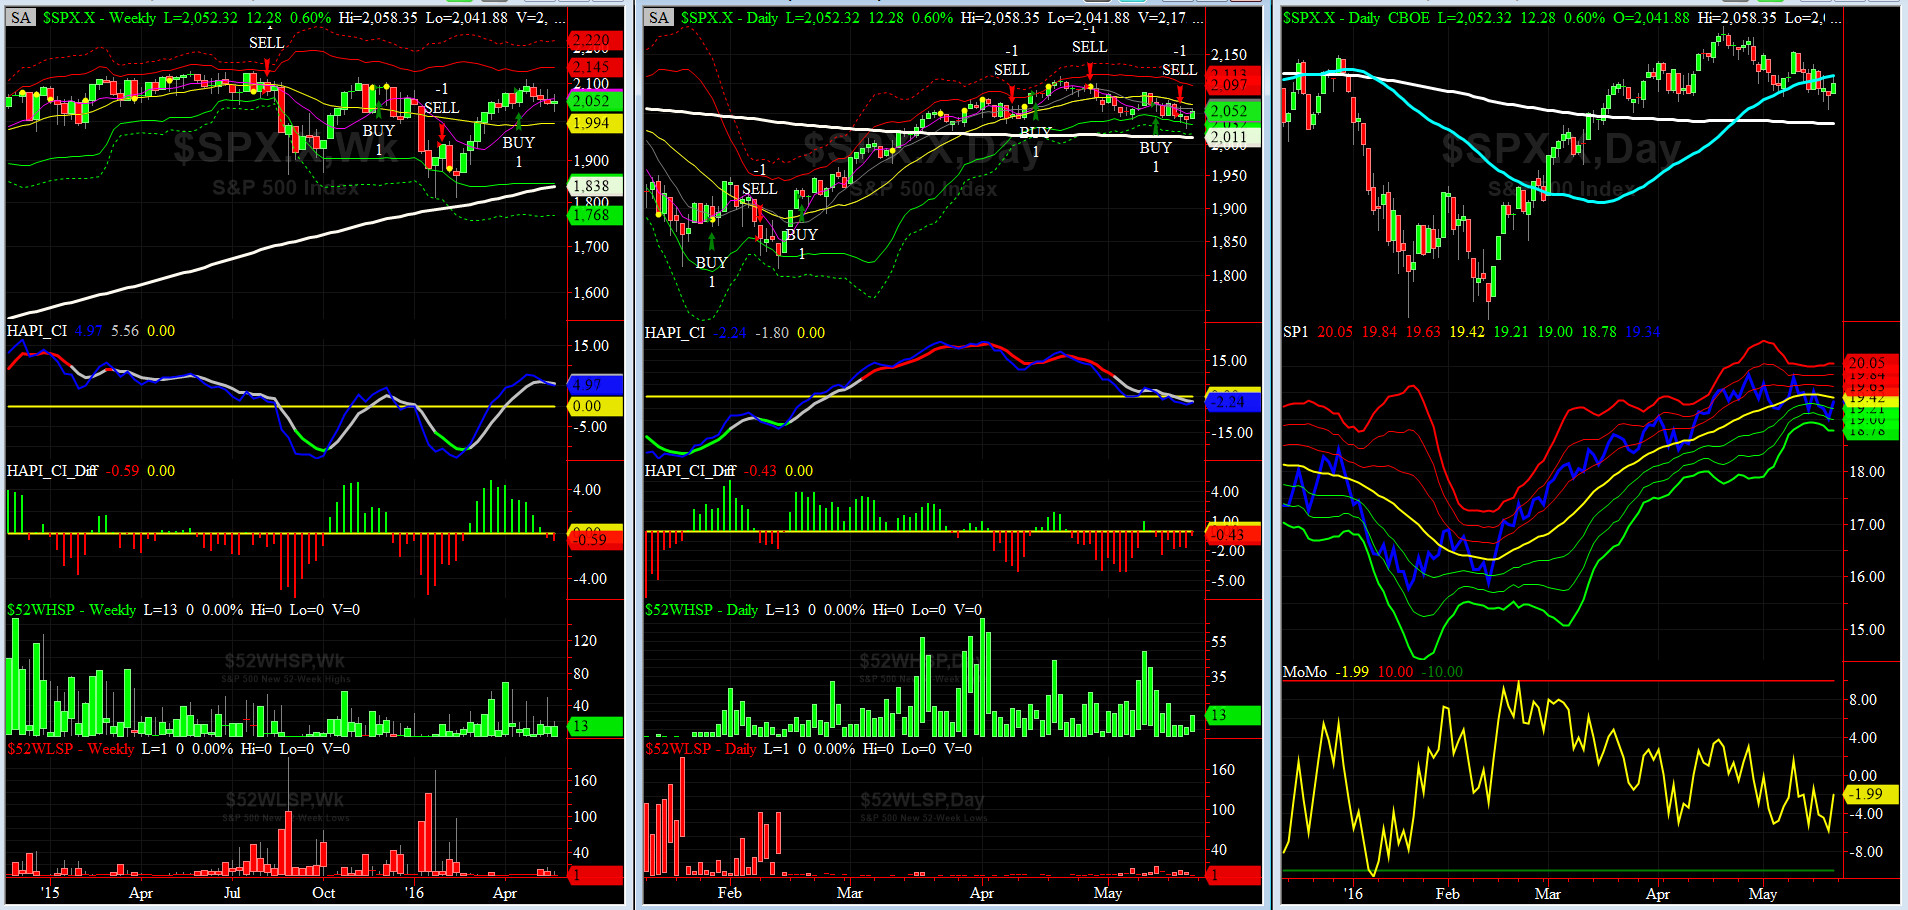
HA_SP1_momo Chart
WEEKLY Timing Model = on a BUY Signal since Friday 4/15/16 CLOSE
DAILY Timing Model = on a SELL Signal since Wednesday 5/18/16 CLOSE
Max SPX 52wk-highs reading last week = 20 (over 120-140, the local maxima is in)
Max SPX 52wk-Lows reading last week = 8 (over 40-60, the local minima is in)
HA_SP1 = at about its 0 sigma channels
HA_Momo = -2(reversals most likely occur above +10 or below -10)
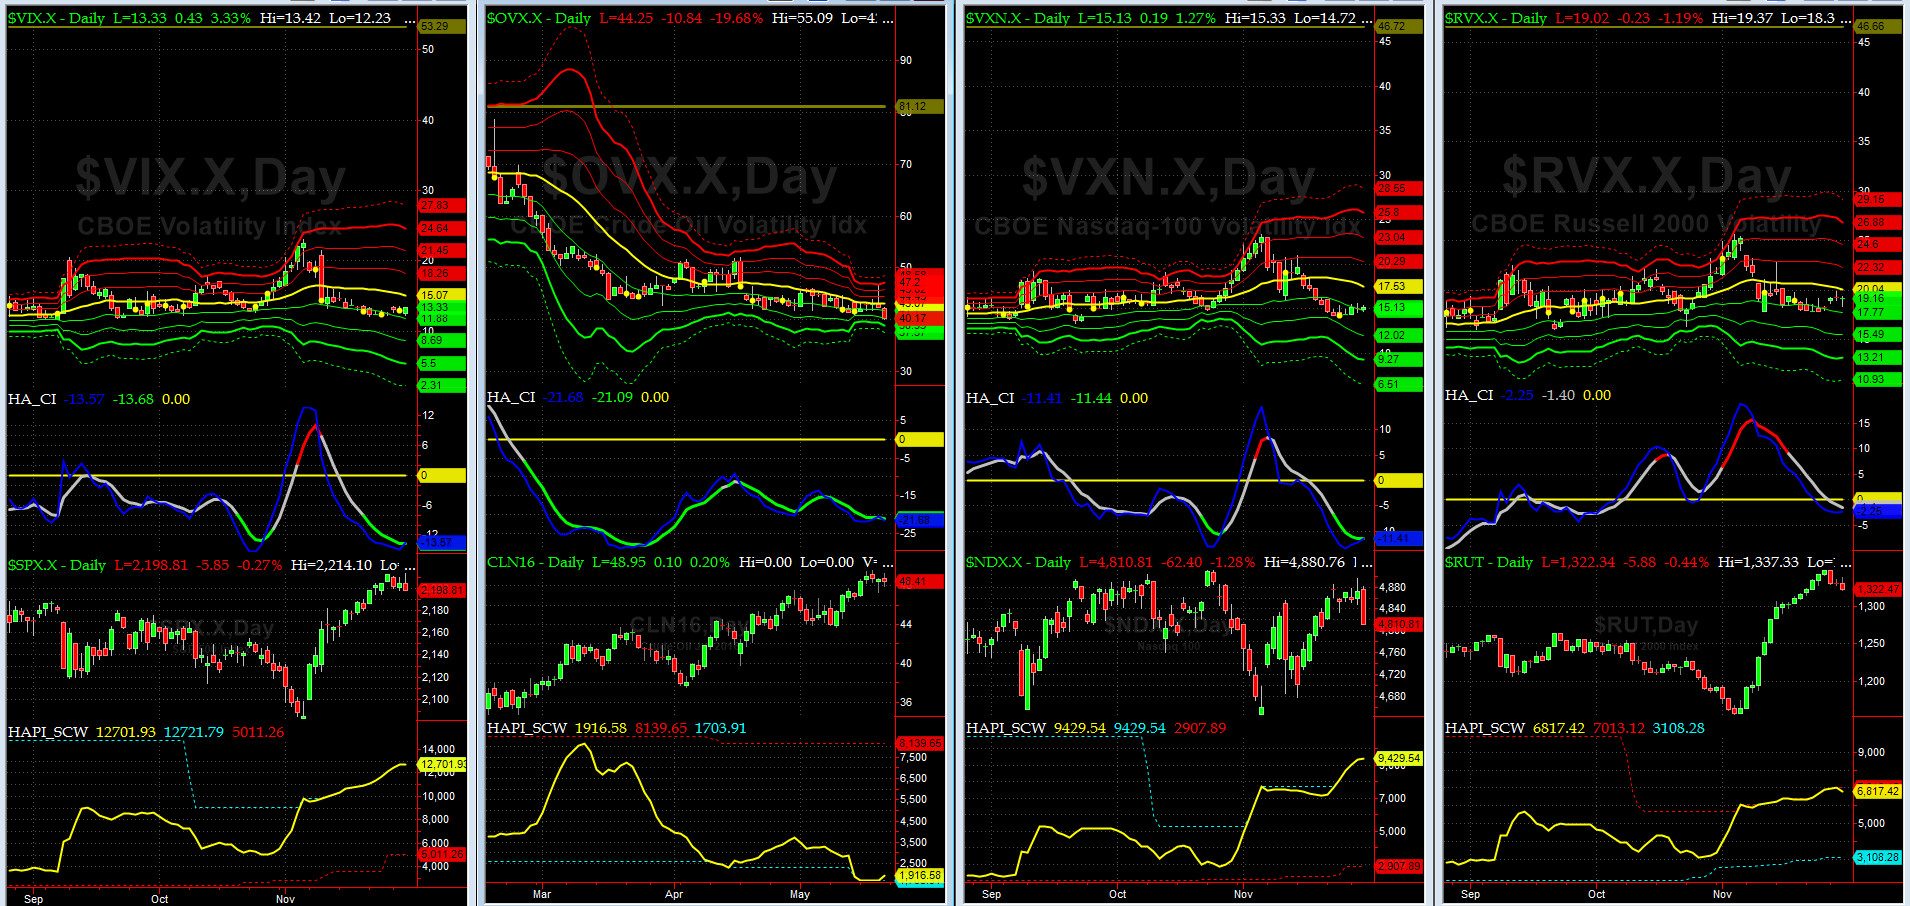
Vol of the Vols Chart
VIX = 15.2 is now at +1 sigma (remember it�s the VIX�s vol pattern (its sigma channels) that matters, and not the level of VIX itself (this is per Dr. Robert Whaley, a great mentor and the inventor of original VIX, now called VXO. VIX usually peaks around a test of its +4 sigma).
Our beloved Fear Index is CRUSHED here (look how parallel its sigma channels are)!!!
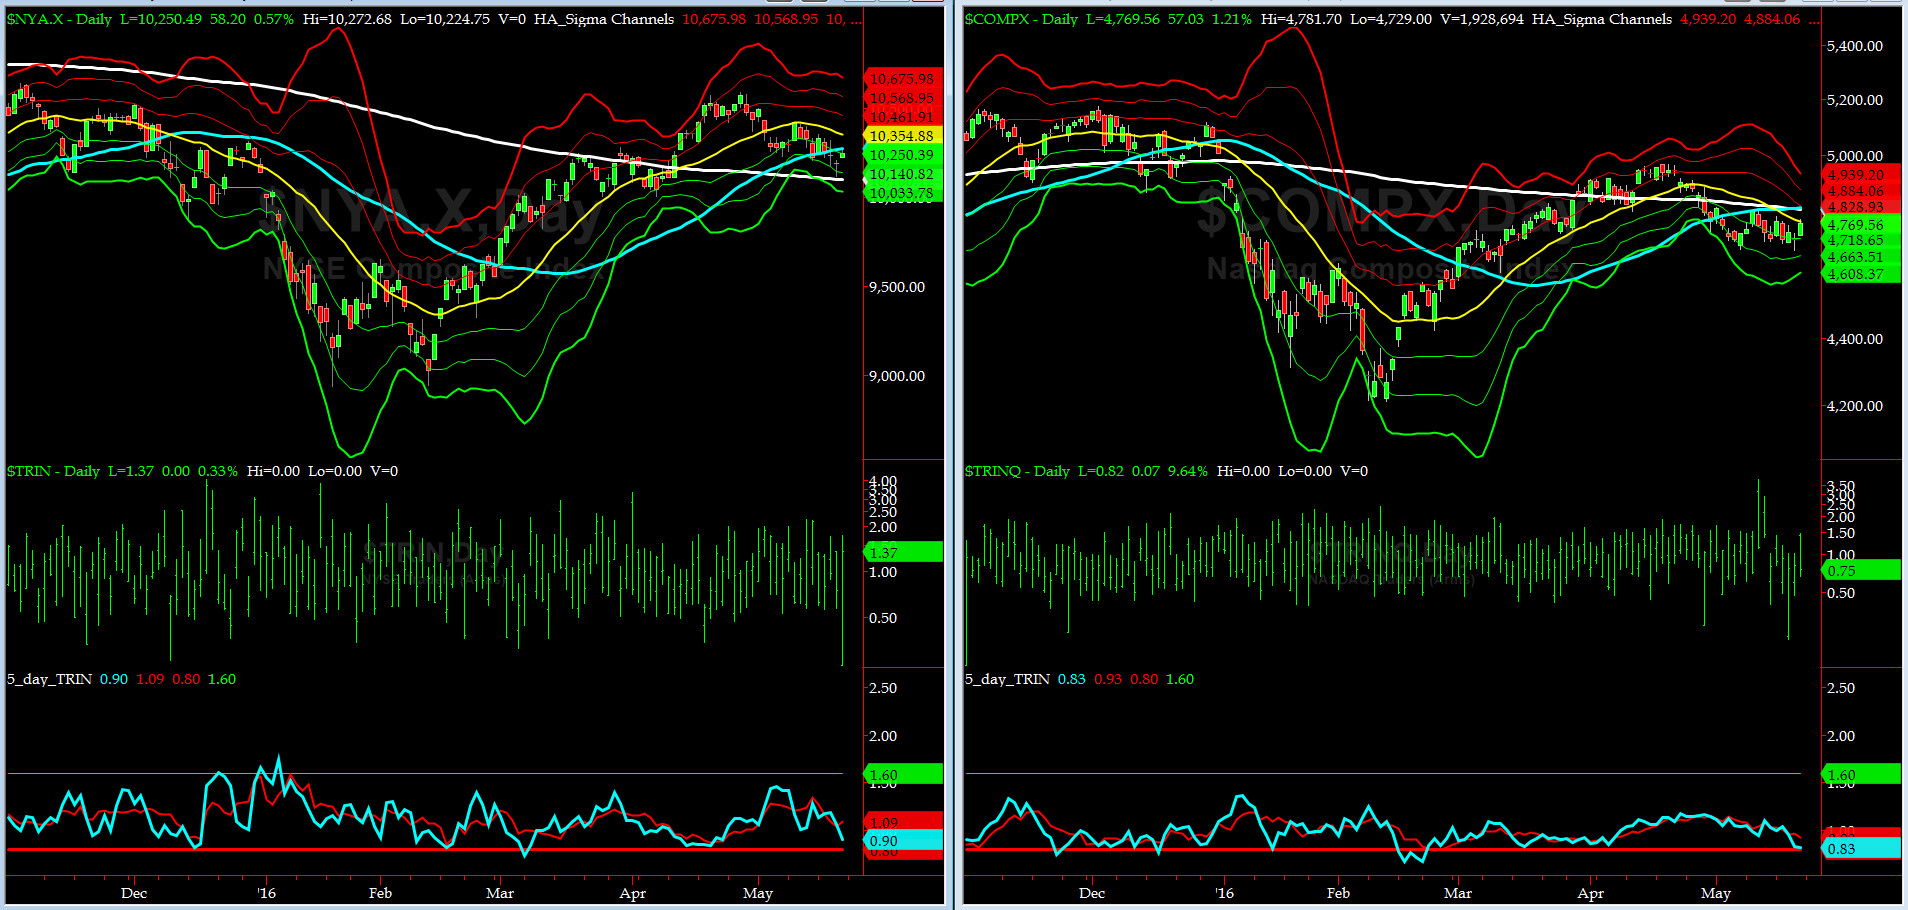
5-day TRIN & TRINQ Charts
Both 5-day TRINs are nearing SELL signals. That's very interesting......
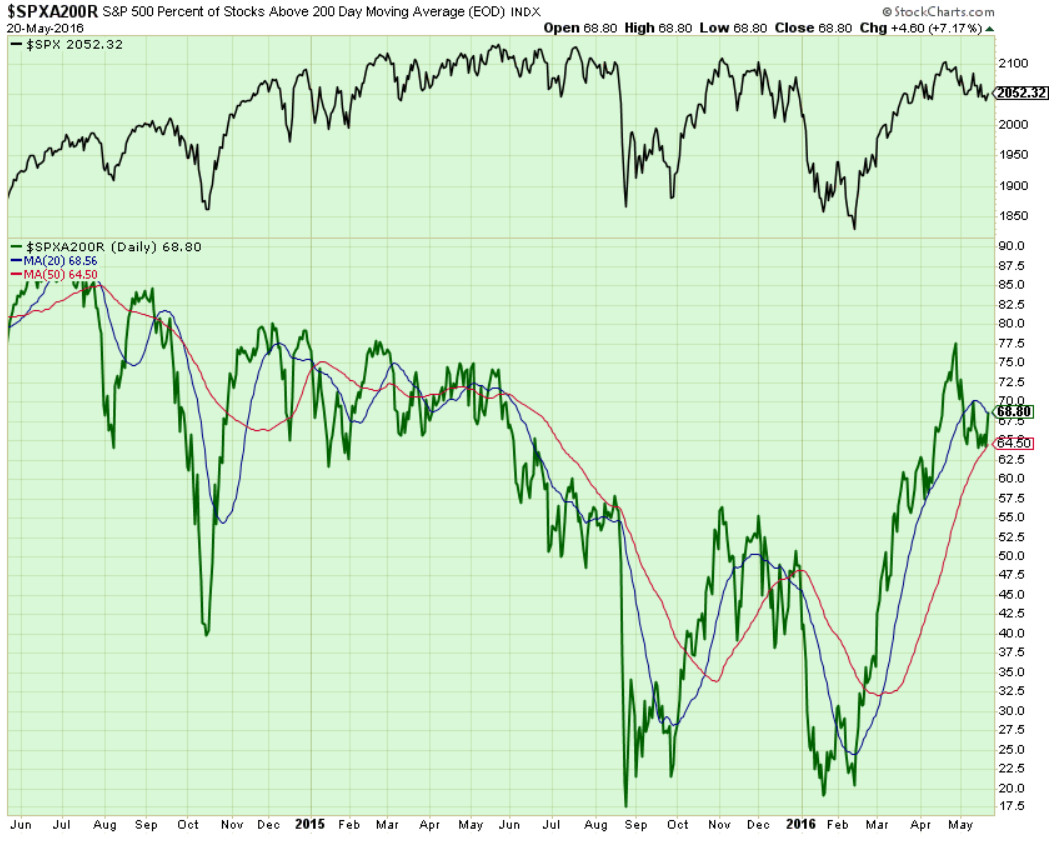
Components of SPX above their respective 200day MA Chart
As discussed here last week, this scoring indicator found support this week [at 64%] and then bounced to 68%. What is next? We should look for 75% to 78%, ioho.

SPX SKEW (Tail Risk) Chart
SPX SKEW (Tail Risk) = 125.6 and still around its 0 sigma (normal = 120-125, range 100-150)
All Quiet on the Mid-Western Front? Yes......So, All of Our Problems Are Solved? The Donald thinks he can solve them, in 100 days or less, once he is in the White House. LOL.
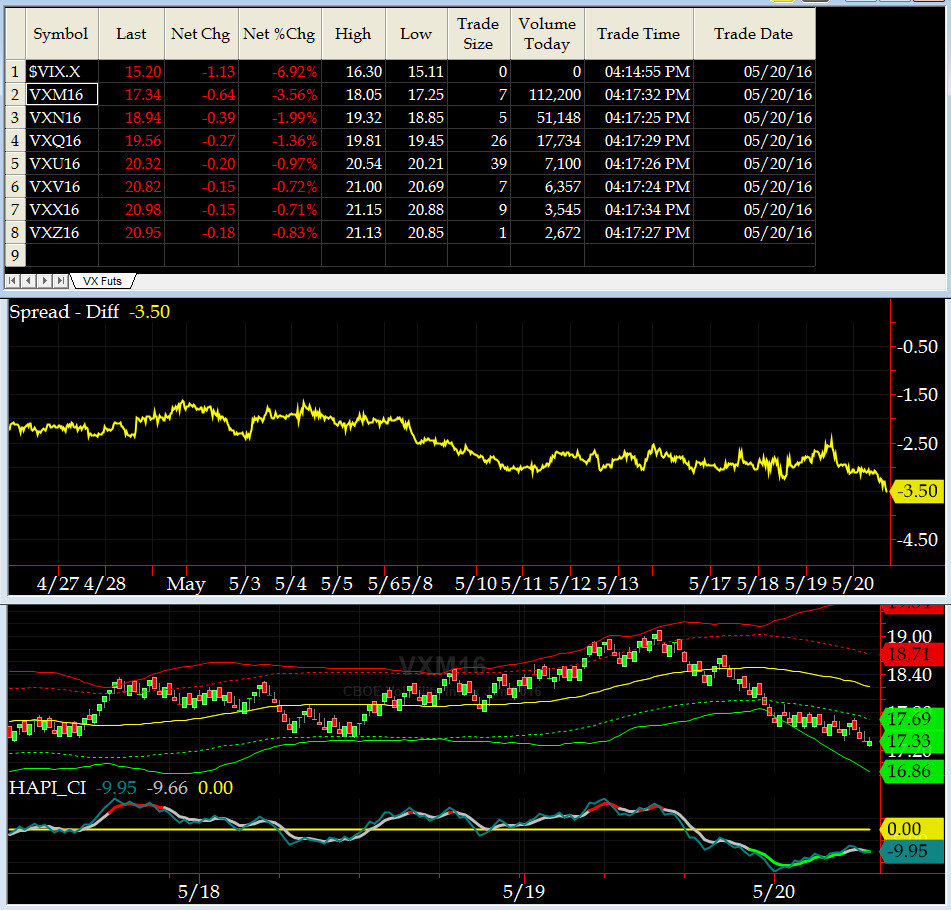
3-month VIX Futures Spread(VX) Chart
Our 3-month VIX Futures Spread (LONG JUN16 & SHORT SEP16) closed at -3.5 on Friday. VX Futs are fast approaching a local minima.

HA_SP2 Chart
HA_SP2 = 48.2 (Buy signal <= 25, Sell Signal >= 75)
At ~48, this prop indicator is neutral zone but heading up, for now after putting in a nice bullish divergence.
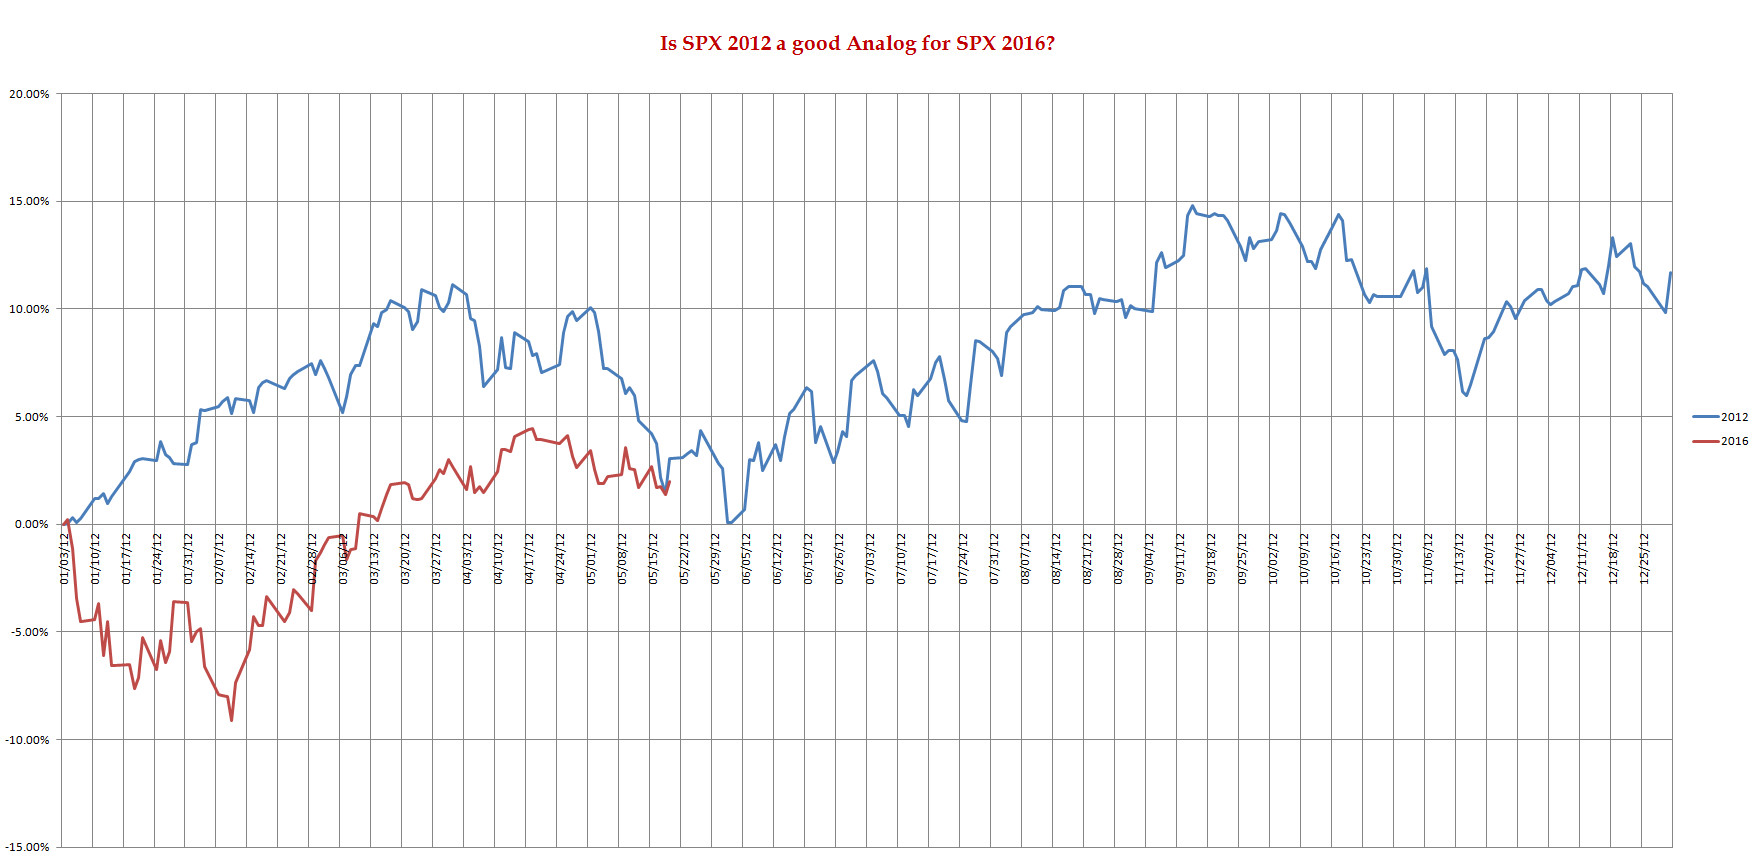
SPX 2012 Analog for SPX 2016
Based on this Analog, it looks to us that we may have already seen the reversal in early-May. Here is the challange: we have a few analogs and moves are, so far too small, percentage wise. To pick which one BEST represents the Market this year, it is a very tough call right now.
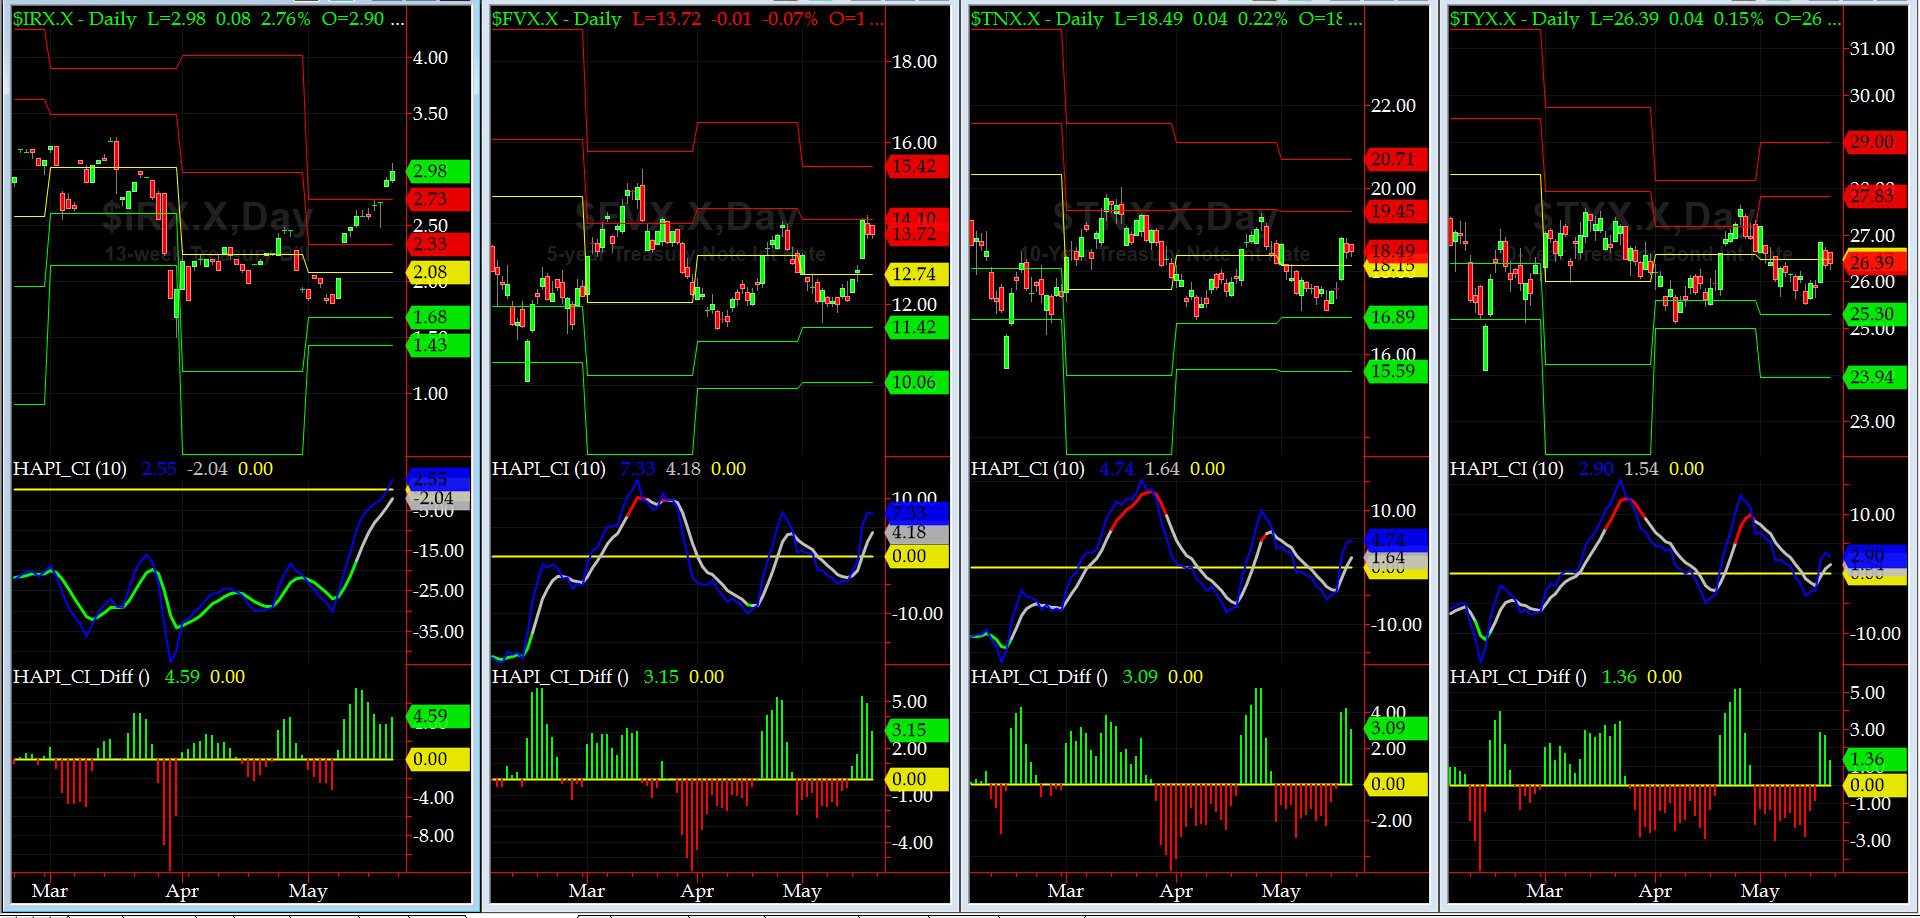
US Treasury T-Notes & T-Bonds Yields Chart
This past week, US Treasury Yield Curve was on a long march and jumped by, as much as, one full SPR level.
Fari Hamzei
|


 Proactive Market Timing