|
Monday, May 30, 2016 1230ET
Market Timing Charts, Analysis & Commentary for Issue #144
Timer Charts of S&P-500 Cash Index (SPX) + NASDAQ-100 Cash Index (NDX)
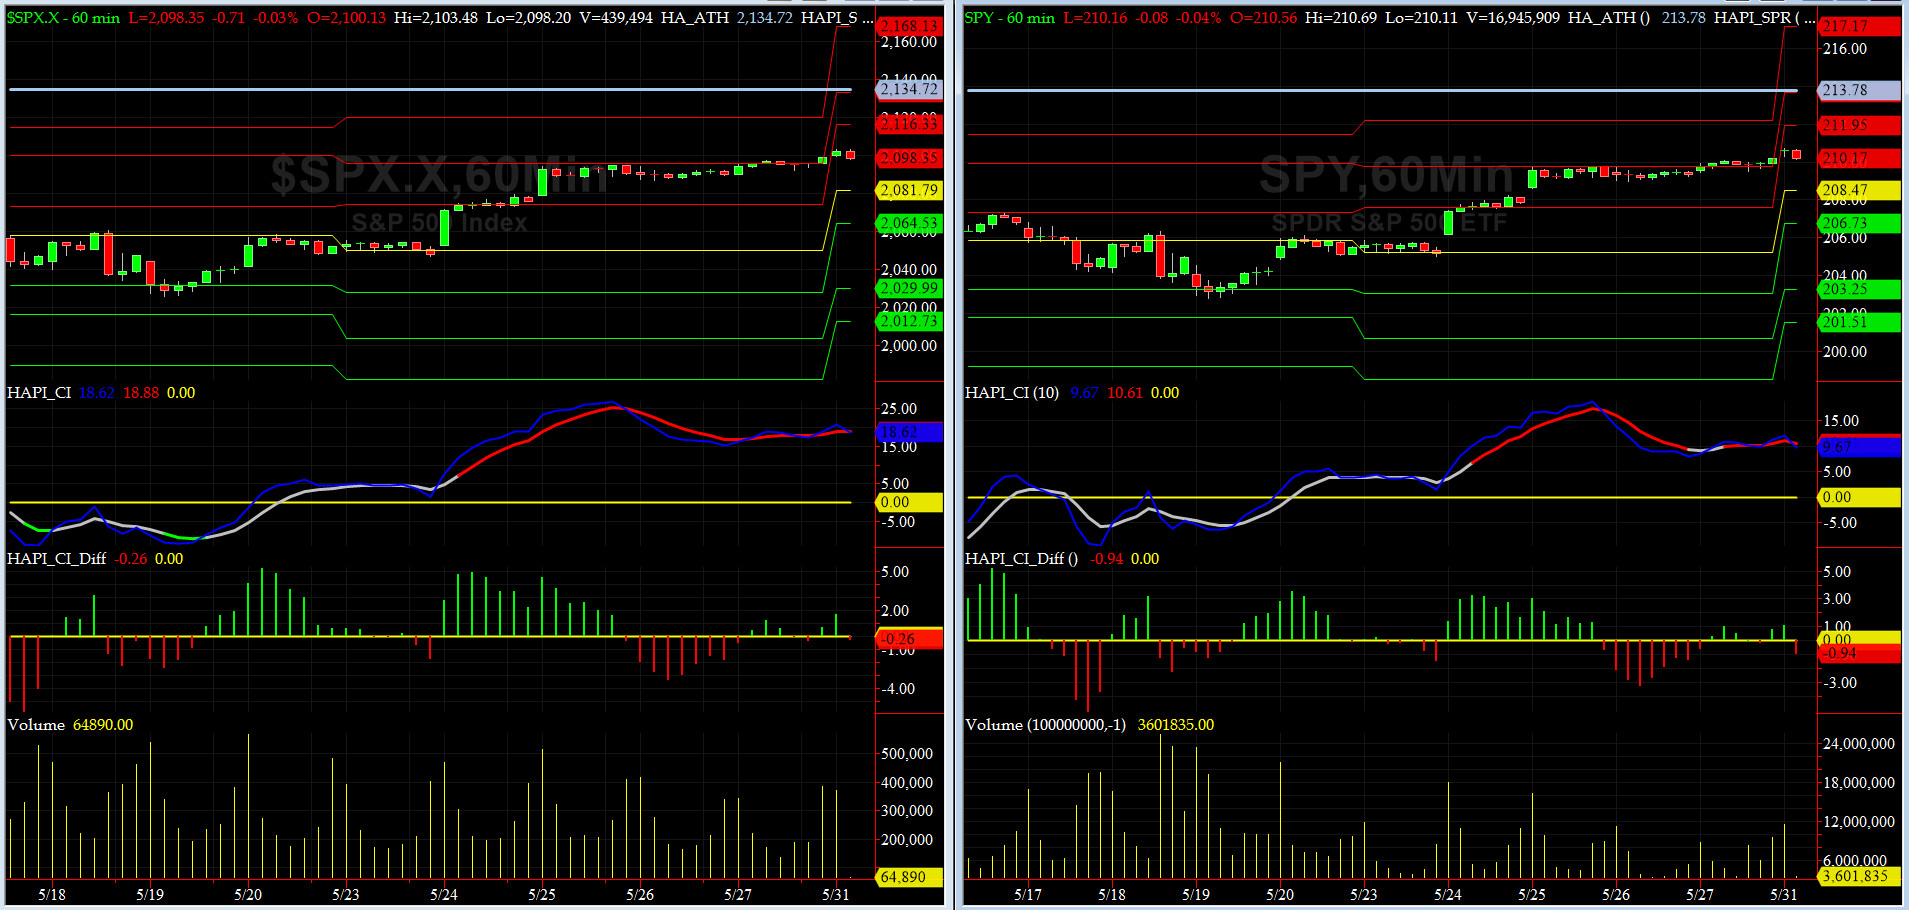
Most recent S&P-500 Cash Index (SPX): 2099.06 up +46.74 (up +2.3%) for the week ending on Friday, May 27th, 2016, which closed above its +2 sigma.
SPX ALL TIME INTRADAY HIGH = 2134.72 (reached on Wednesday, May 20th, 2015)
SPX ALL TIME CLOSING HIGH = 2130.82 (reached on Thursday, May 21st, 2015)
Current DAILY +2 Sigma SPX = 2098 with WEEKLY +2 Sigma = 2156
Current DAILY 0 Sigma (20 day MA) SPX = 2064 with WEEKLY 0 Sigma = 2003
Current DAILY -2 Sigma SPX = 2030 with WEEKLY -2 Sigma = 1850
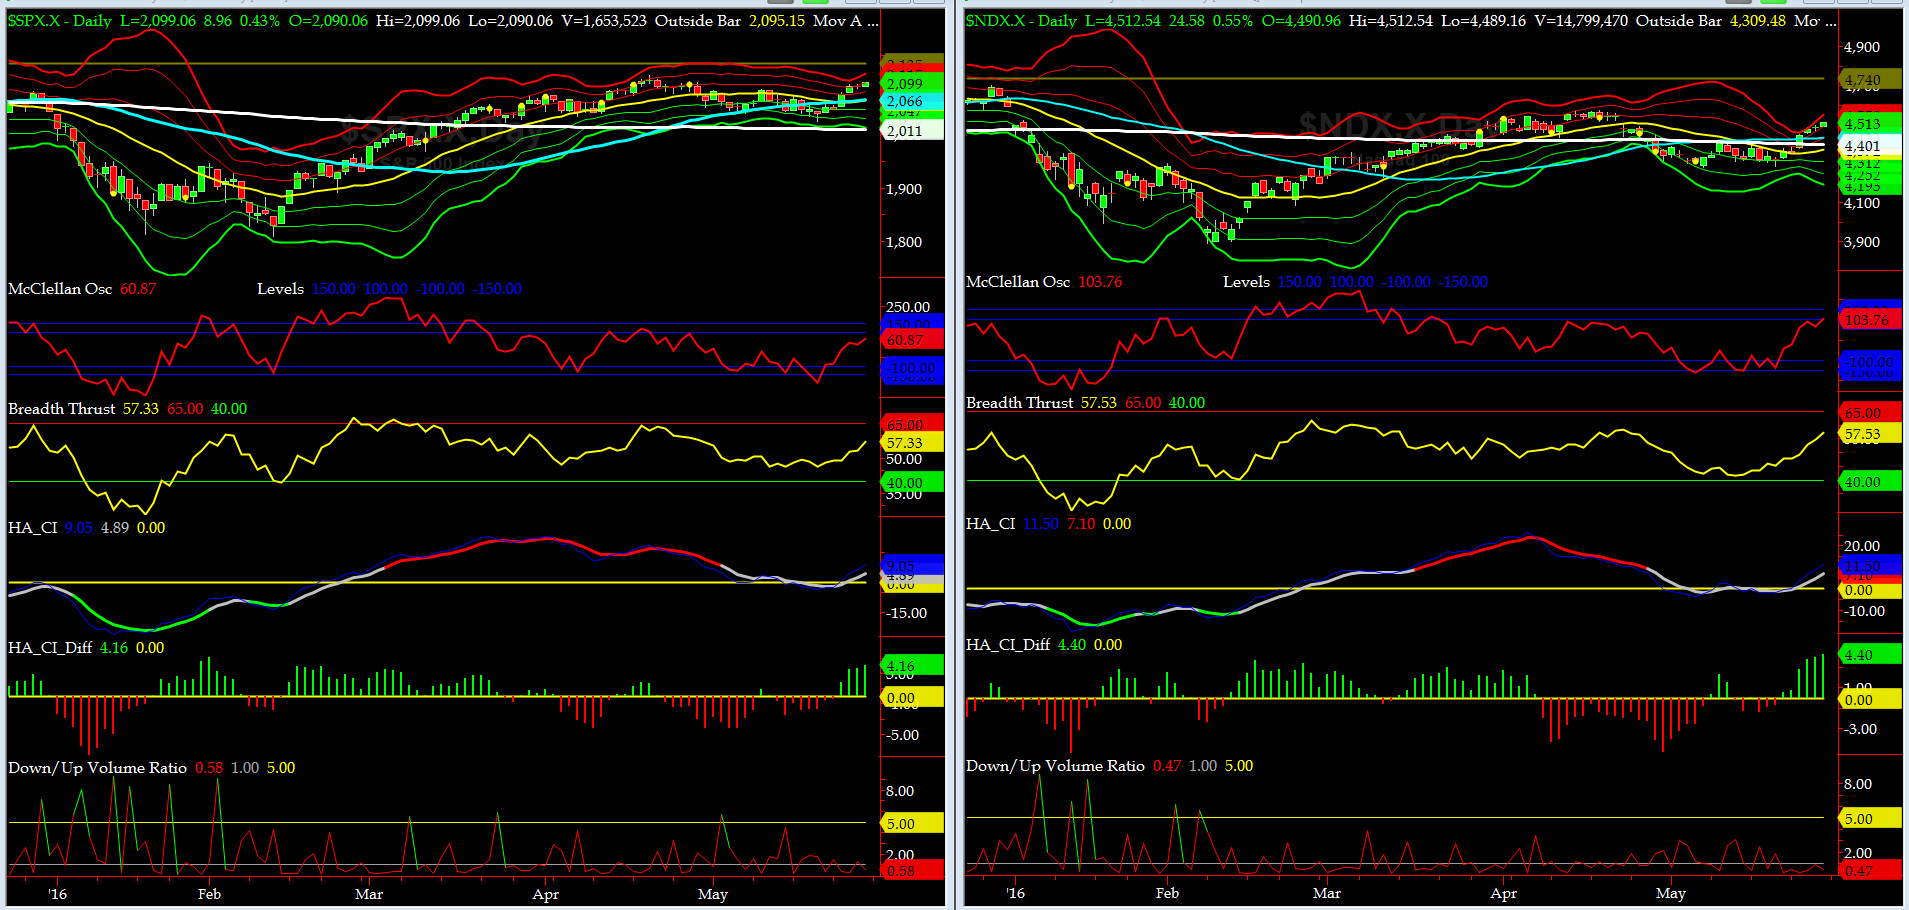
NYSE McClellan Oscillator = +61 (-150 is start of the O/S area; around -275 to -300 area or lower, we go into the �launch-pad� mode, over +150, we are in O/B area)
NYSE Breadth Thrust = 57.33 (40 is considered as oversold and 65 as overbought)
Well, all good things must come to an end. This week, the Shorts were awakened by the marching S&P-500 Futures overnight and their only way out was to scramble for the hills (cover now and short higher). Well, that was the fuel the Longs needed for this raging wild fire. With Daily SPX Cash Index at +2 sigma, we now enter a new phase. More on this, later.....

Canaries [in the Coal Mine] Chart for DJ TRAN & RUT Indices
200-Day MA DJ TRAN = 7727 or 0.6% below DJ TRAN (max observed in last 5 yrs = 20.2%, min = -20.3%)
200-Day MA RUT = 1115 or 3.2% below RUT (max observed in last 5 yrs = 21.3%, min = -22.6%)
DJ Transports (proxy for economic conditions 6 to 9 months hence) crossed its 200day but needs to close above its 50-day also, and then, a channel breakout should be in the works.
Russell 2000 Small Caps (proxy for RISK ON/OFF) having decisively raced past its 50-day and 200-day MAs, now emphatically tells us that the RISK IS ON......... watch for 1155-1160 area.

DeTrenders Charts for SPX, NDX, TRAN & RUT Indices
50-Day MA SPX = 2066 or 1.6% below SPX (max observed in last 5 yrs = +8.6%, min = -9.3%)
200-Day MA SPX = 2011 or 4.4% below SPX (max observed in last 5 yrs = 15.2%, min = -14%)
This week, SEVEN of our Eight DeTrenders are POSITIVE now, all accomplished in just a one week with help of strong econ data + positive comments from the Temple (Fed).
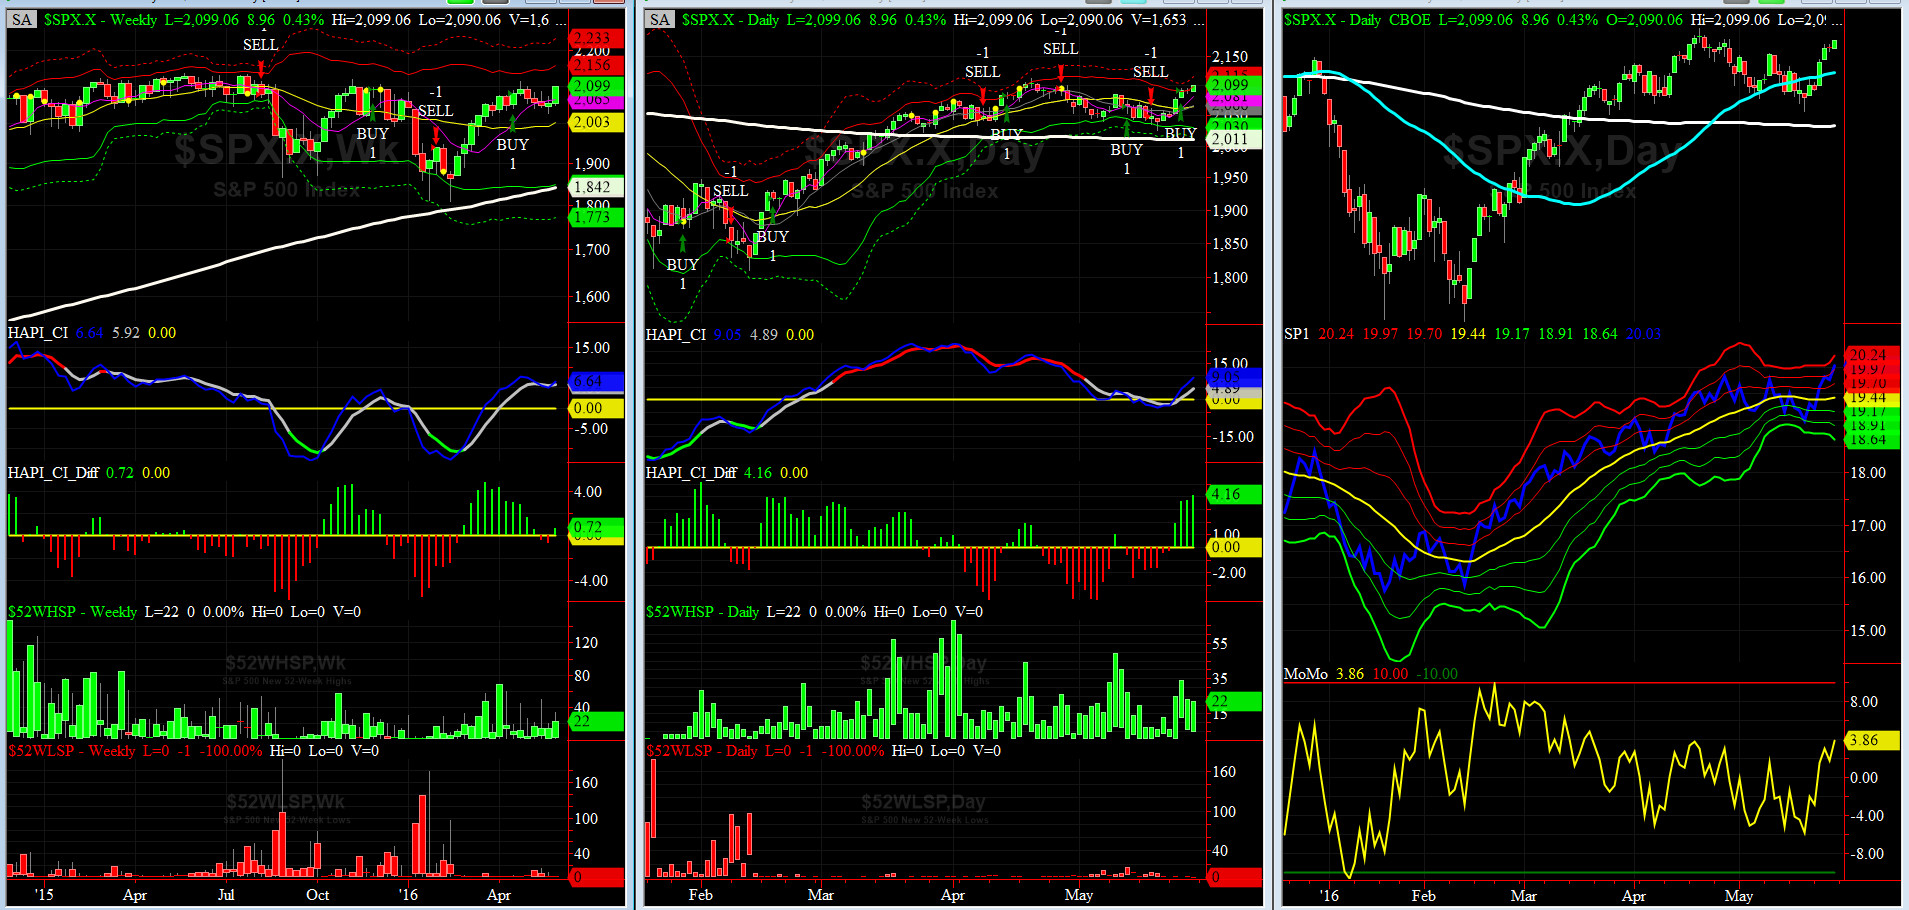
HA_SP1_momo Chart
WEEKLY Timing Model = on a BUY Signal since Friday 4/15/16 CLOSE
DAILY Timing Model = on a BUY Signal since Wednesday 5/25/16 CLOSE
Max SPX 52wk-highs reading last week = 34 (over 120-140, the local maxima is in)
Max SPX 52wk-Lows reading last week = 1 (over 40-60, the local minima is in)
HA_SP1 = at about its +1.5 sigma channels
HA_Momo = +3.9(reversals most likely occur above +10 or below -10)
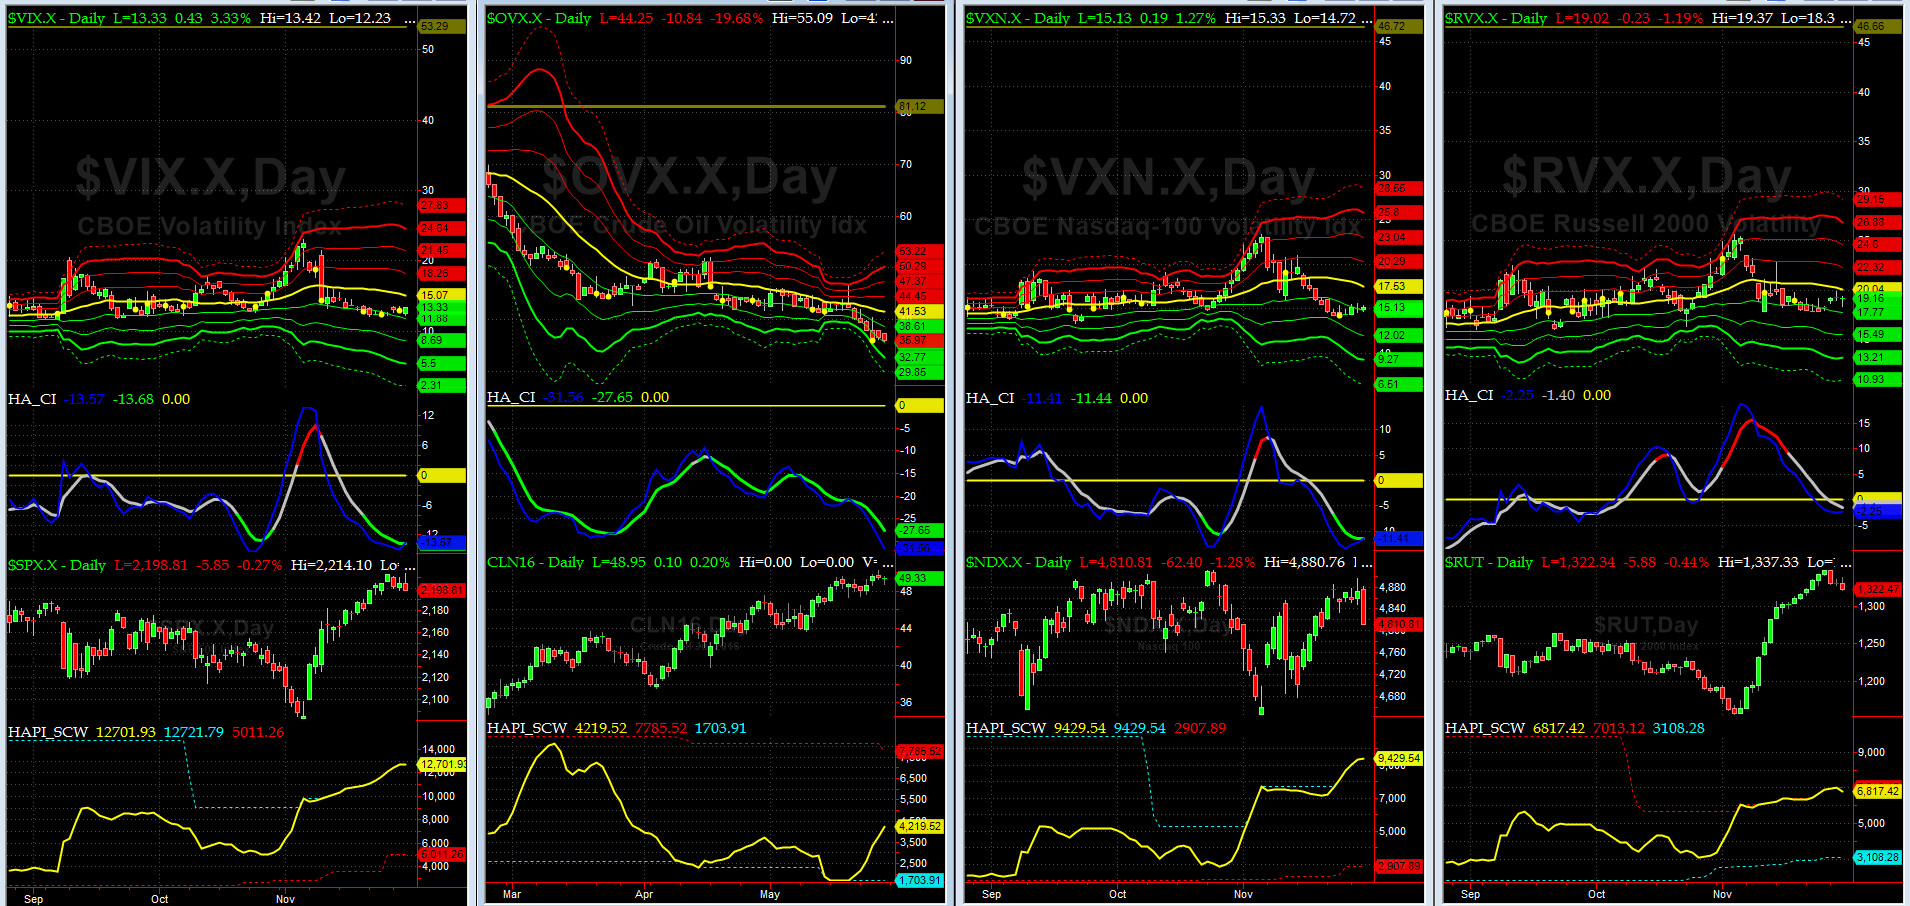
Vol of the Vols Chart
VIX = 13.1 is now at -2 sigma (remember it�s the VIX�s vol pattern (its sigma channels) that matters, and not the level of VIX itself (this is per Dr. Robert Whaley, a great mentor and the inventor of original VIX, now called VXO. VIX usually peaks around a test of its +4 sigma).
It must be noted that the week before last, we saw a huge number of VIX call buyers on the tape and as I rhetorically asked in the chatrooms: what are these infidels thinking? What a waste of capital, but then again, the job of the markets is to bring in max number of sheep to the slaughterhouse.
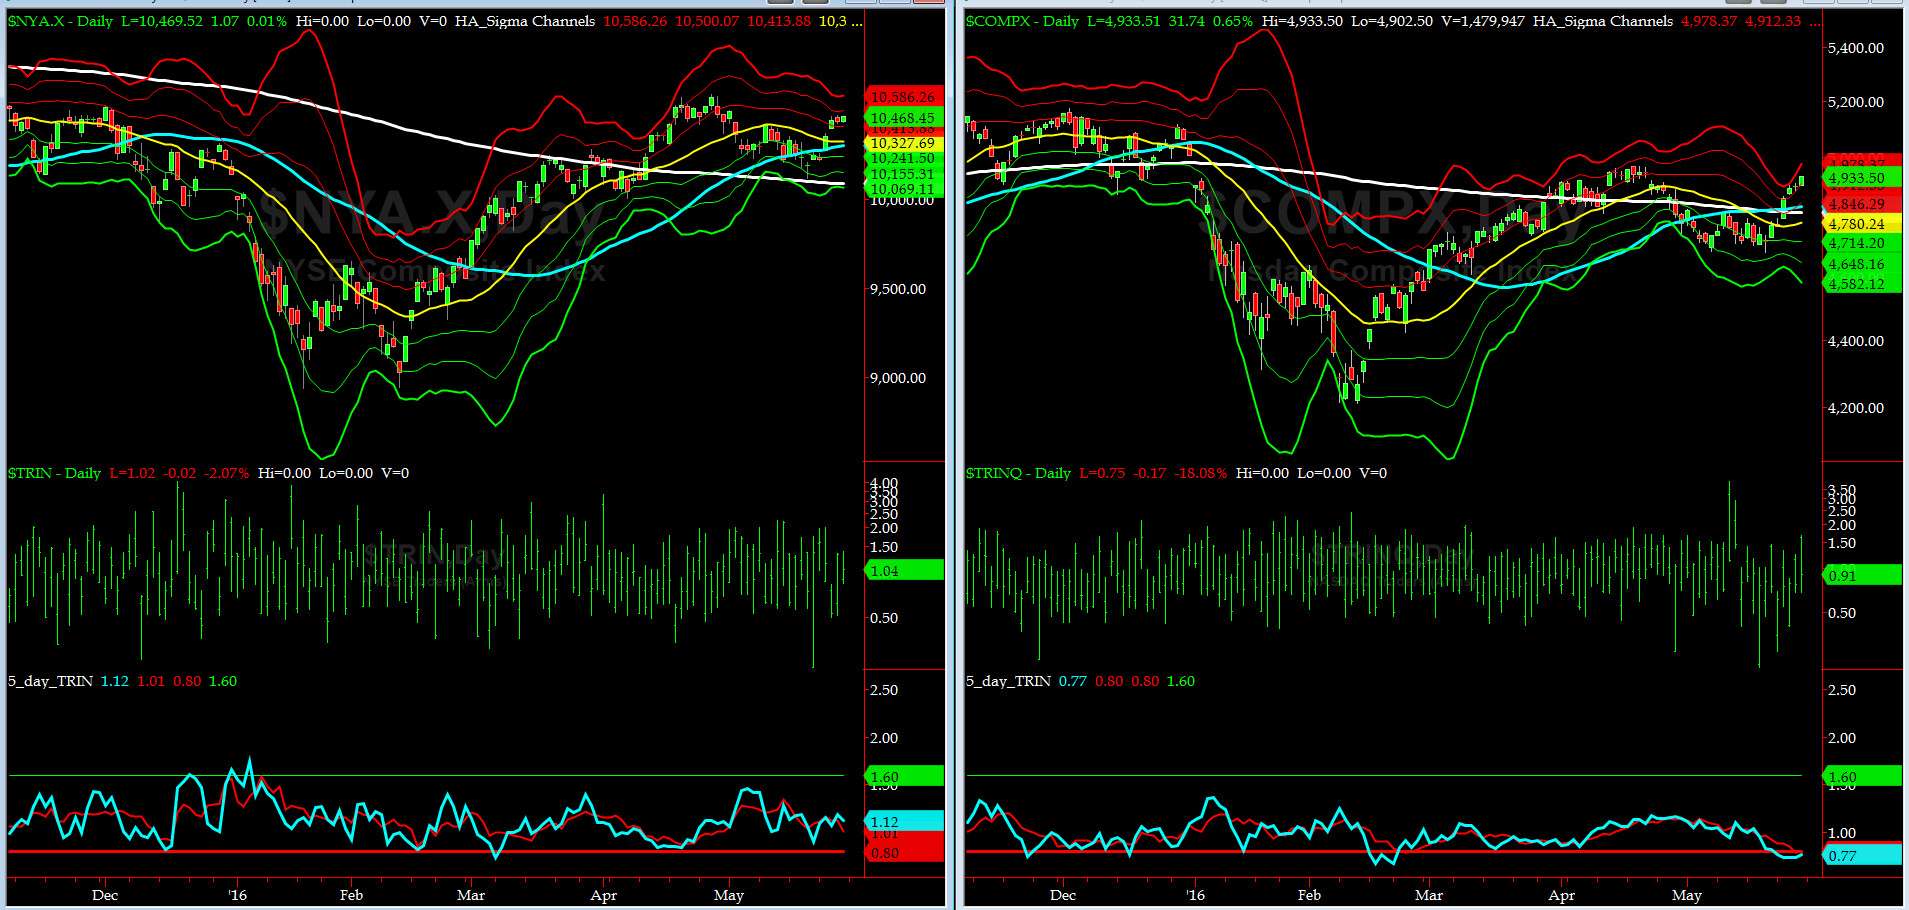
5-day TRIN & TRINQ Charts
That was a False Positive signal (NAZZ is at a Sell) the 5-day TRINQ gave last week.......
5-day TRIN for NYSE is Neutral here for now....
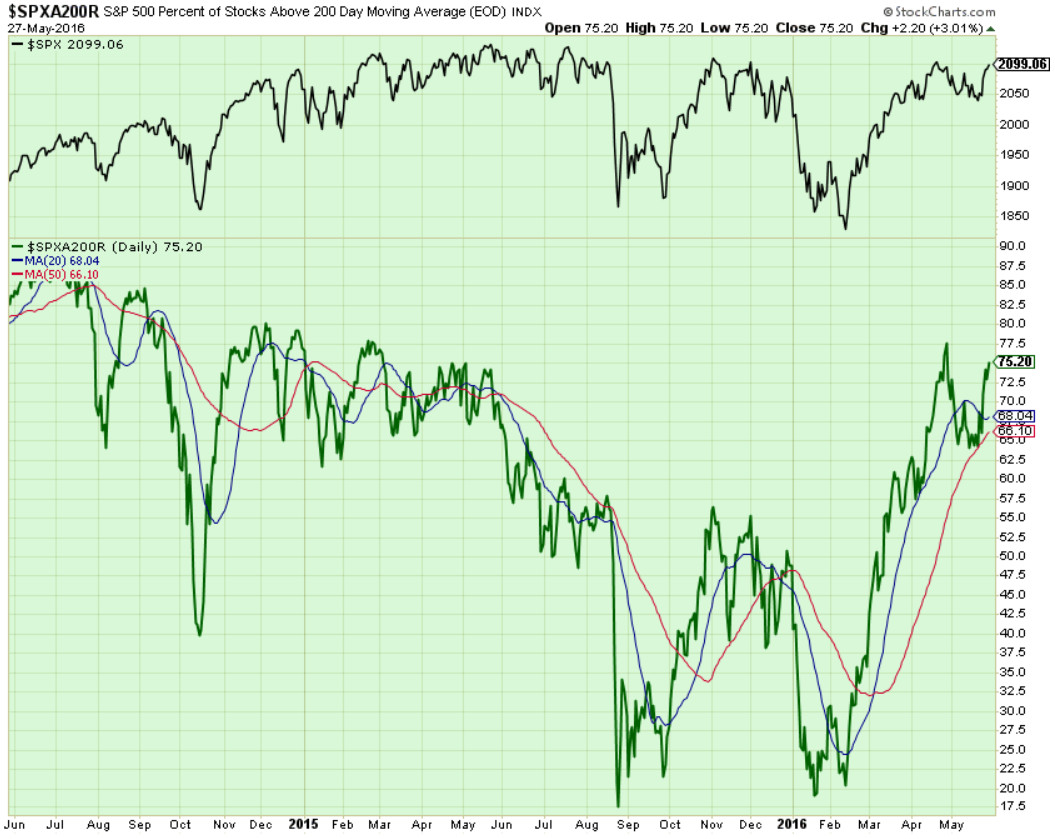
Components of SPX above their respective 200day MA Chart
As discussed here last week, this scoring indicator tested 75%. What is next? We should look for a breakout past 80% mark, most likely after a pause first, ioho.
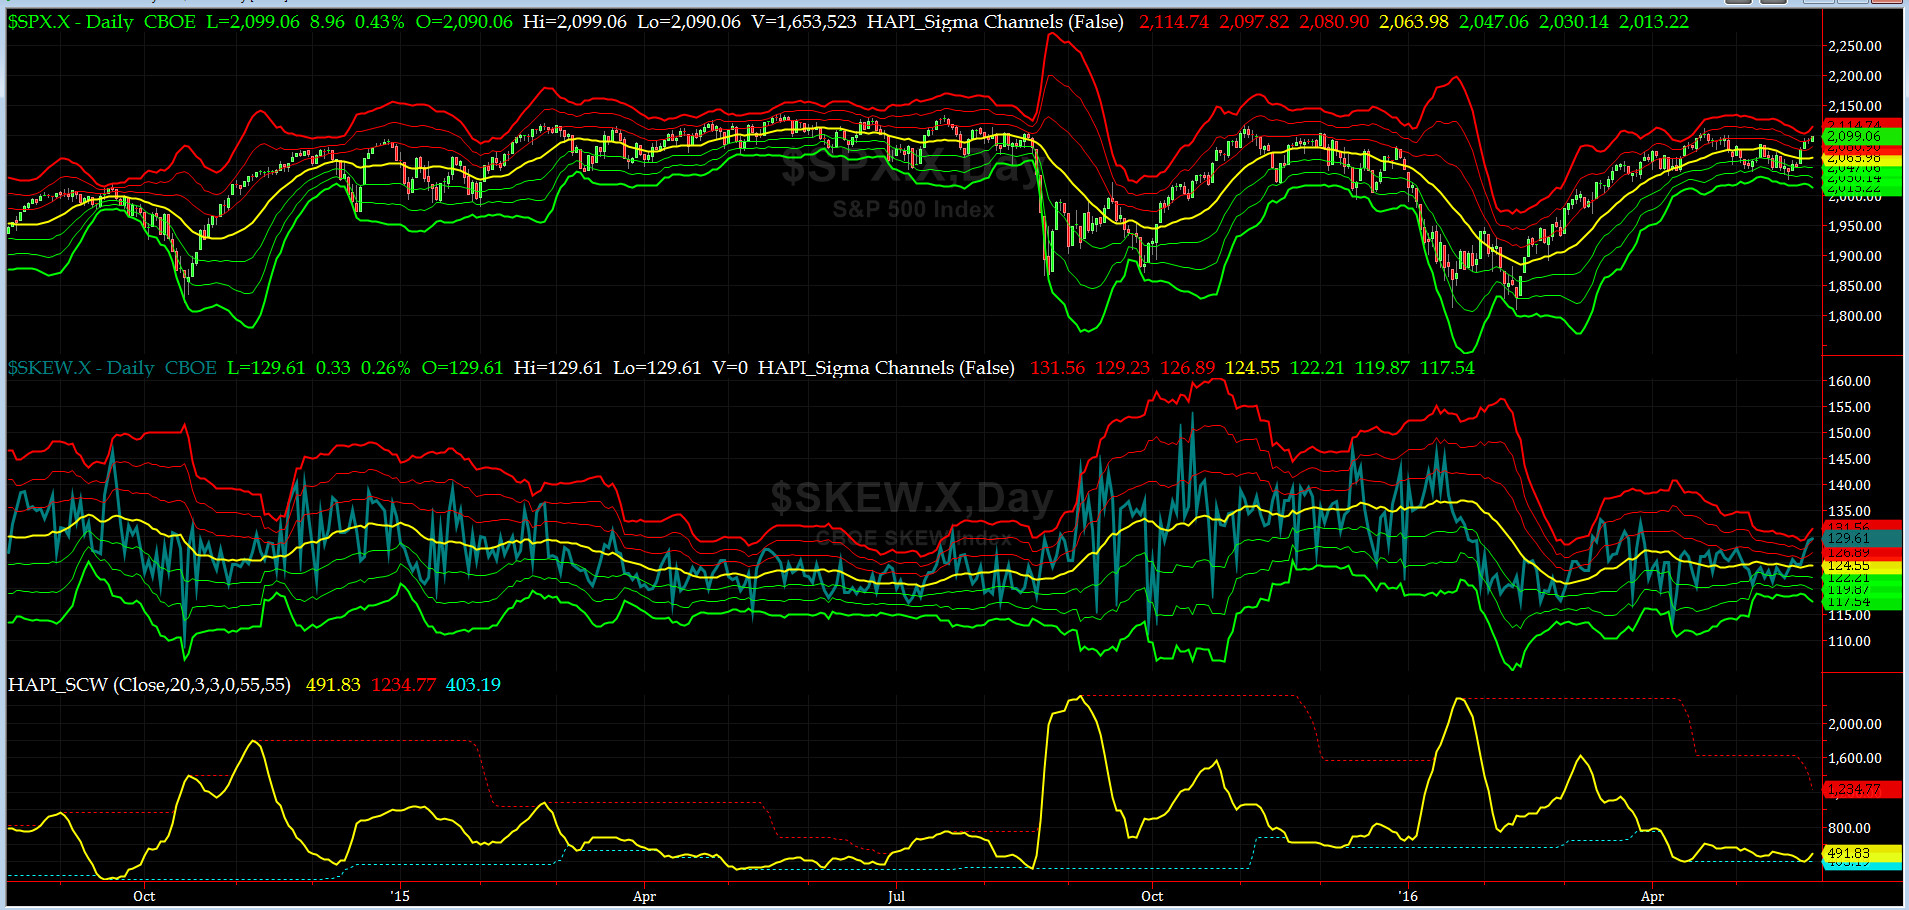
SPX SKEW (Tail Risk) Chart
SPX SKEW (Tail Risk) = 129.6 and nearing its +2 sigma (normal = 120-125, range 100-150)
All Quiet on the Mid-Western Front? For now yes but may be not for too long. Keep any eye on SKEW (comes out about an hour after SPX Options stop trading)

3-month VIX Futures Spread(VX) Chart
Our 4-month VIX Futures Spread (LONG JUN16 & SHORT OCT16) closed at -4.35 on Friday. Market continues to be near a local maxima.
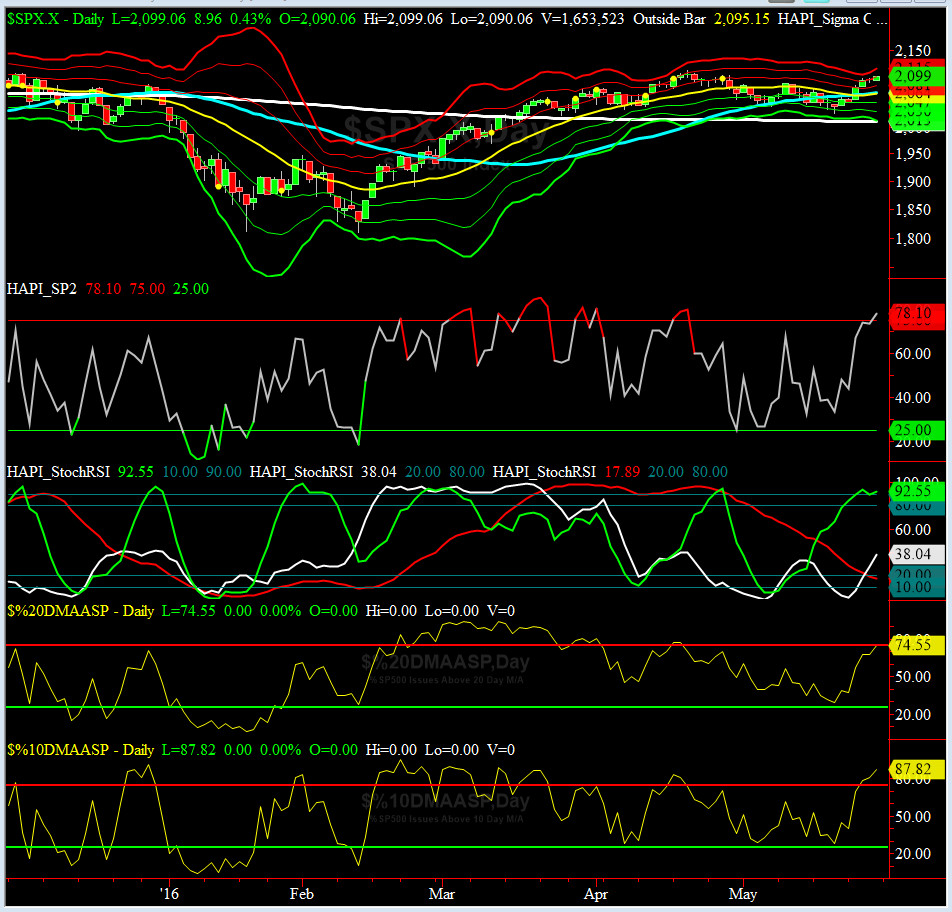
HA_SP2 Chart
HA_SP2 = 78.1 (Buy signal <= 25, Sell Signal >= 75)
At ~78, this prop indicator is in OverBought zone. LONGS should take some profits.
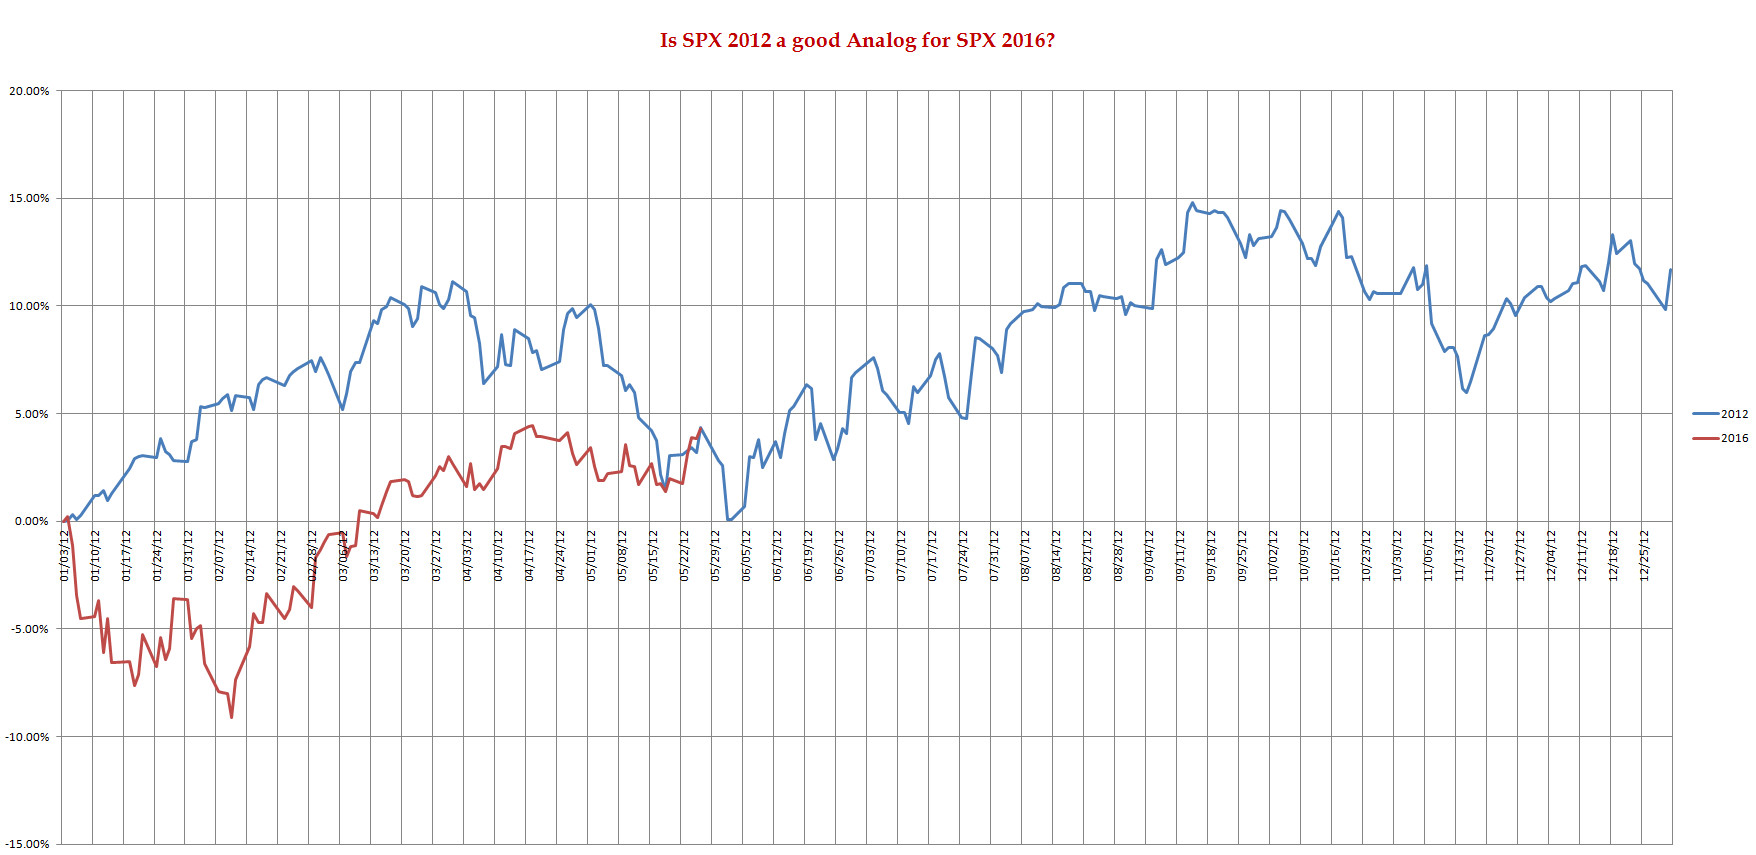
SPX 2012 Analog for SPX 2016
We have not found any analog (for 2016) we like so far, but then again, as Rumi reminds us: "Night is Young...."
Having stated that and based on this Analog, it looks to us that we could have a pause before another march up. What is puzzling to us about this analog (and partially based on our review of corporate credit landscape (both investment grade and junk, specially from the energy patch), we expect a challenging summer in equities).
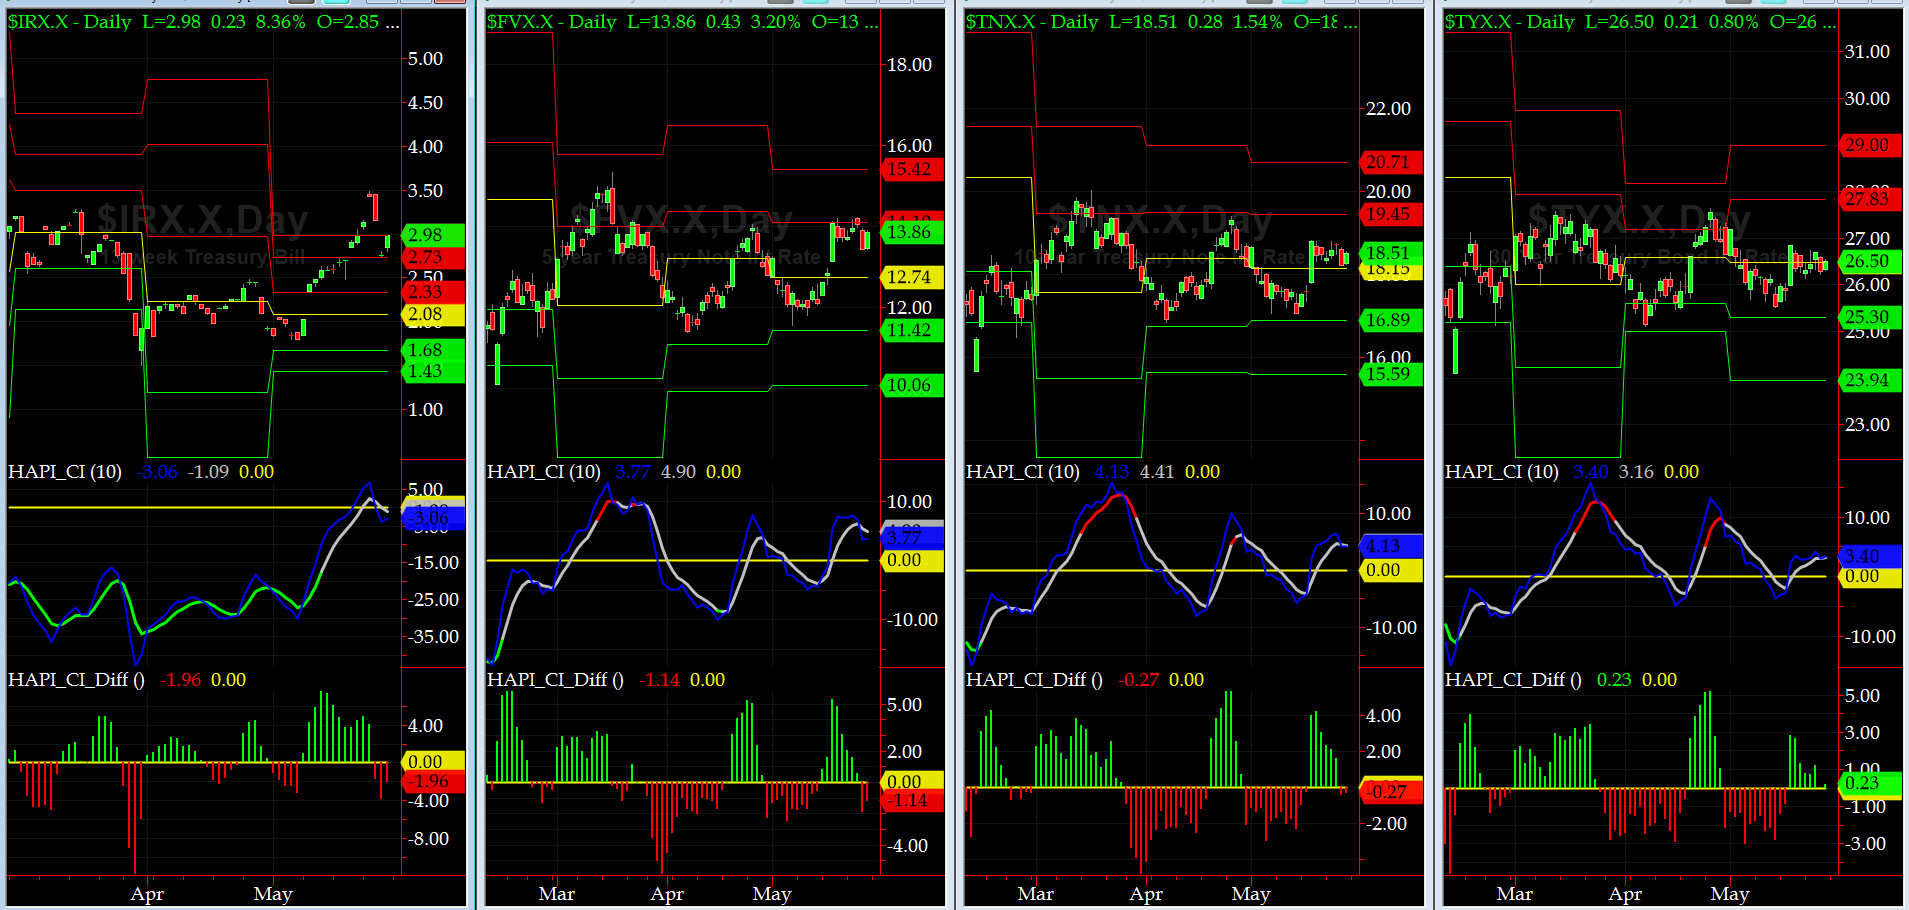
US Treasury T-Notes & T-Bonds Yields Chart
This past week, US Treasury Yield Curve got whacked as Treasury PRICES marched slightly higher. No signal here imho.
Fari Hamzei
|


 Proactive Market Timing