|
Sunday, July 10, 2016 1330ET
Market Timing Charts, Analysis & Commentary for Issue #150
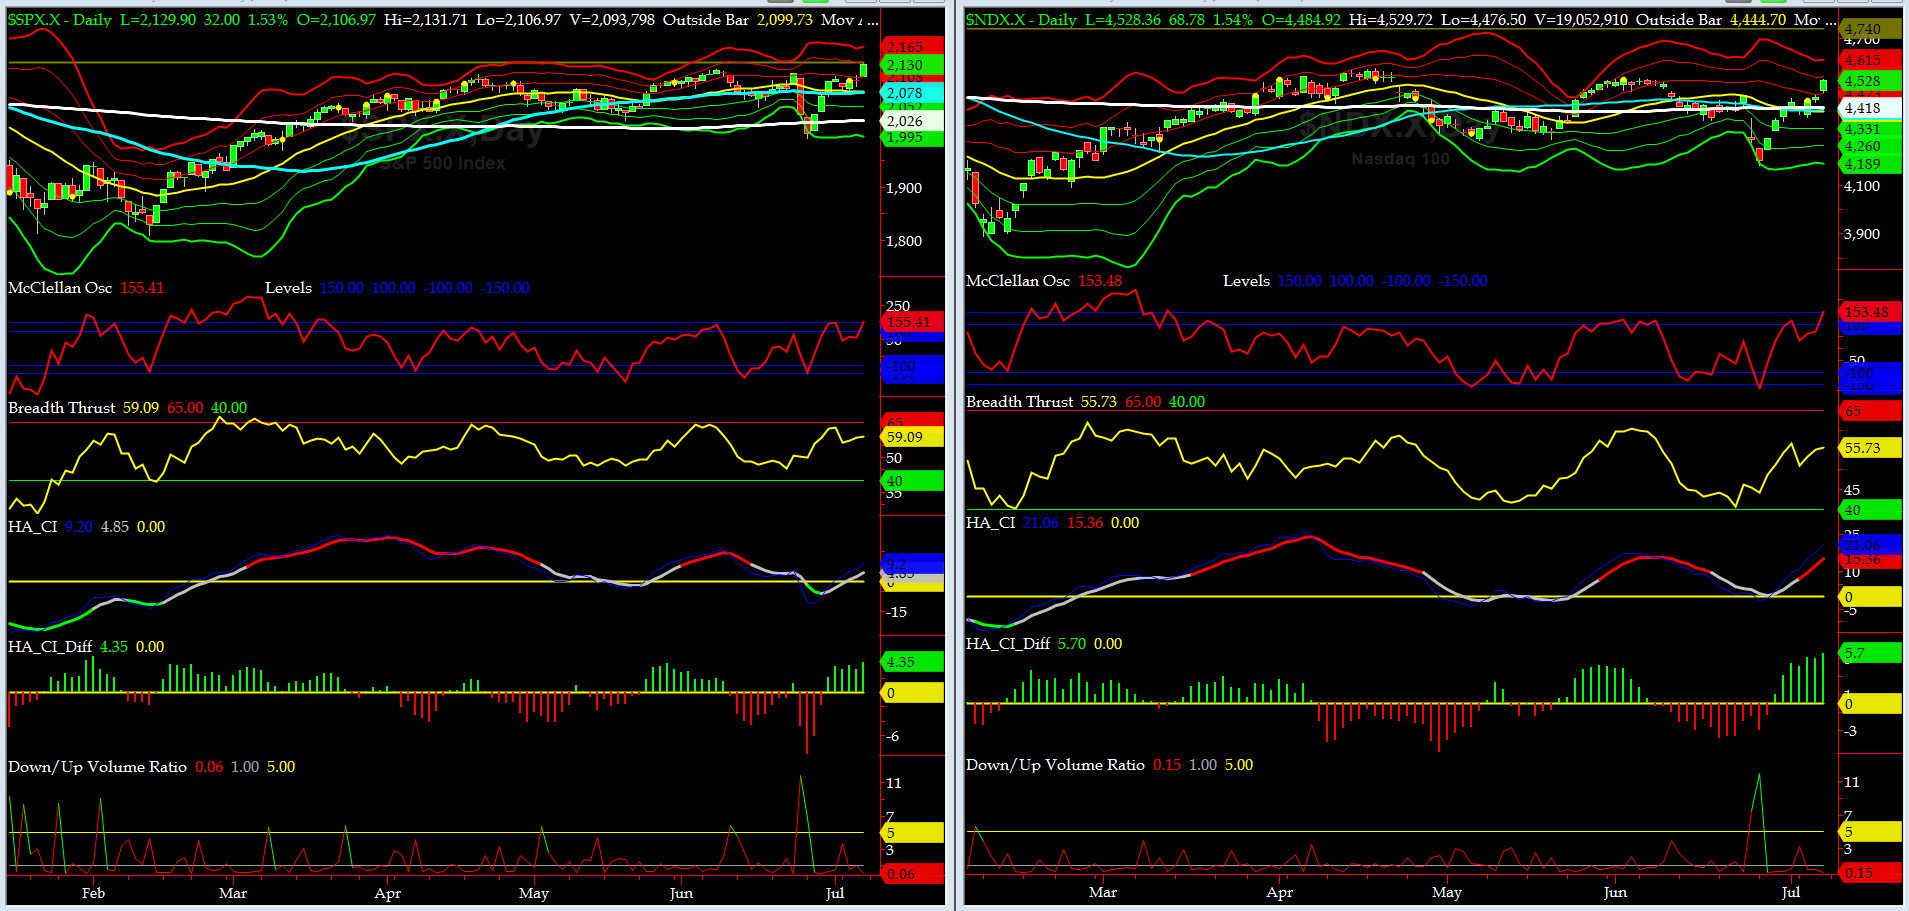
Timer Charts of S&P-500 Cash Index (SPX) + NASDAQ-100 Cash Index (NDX)
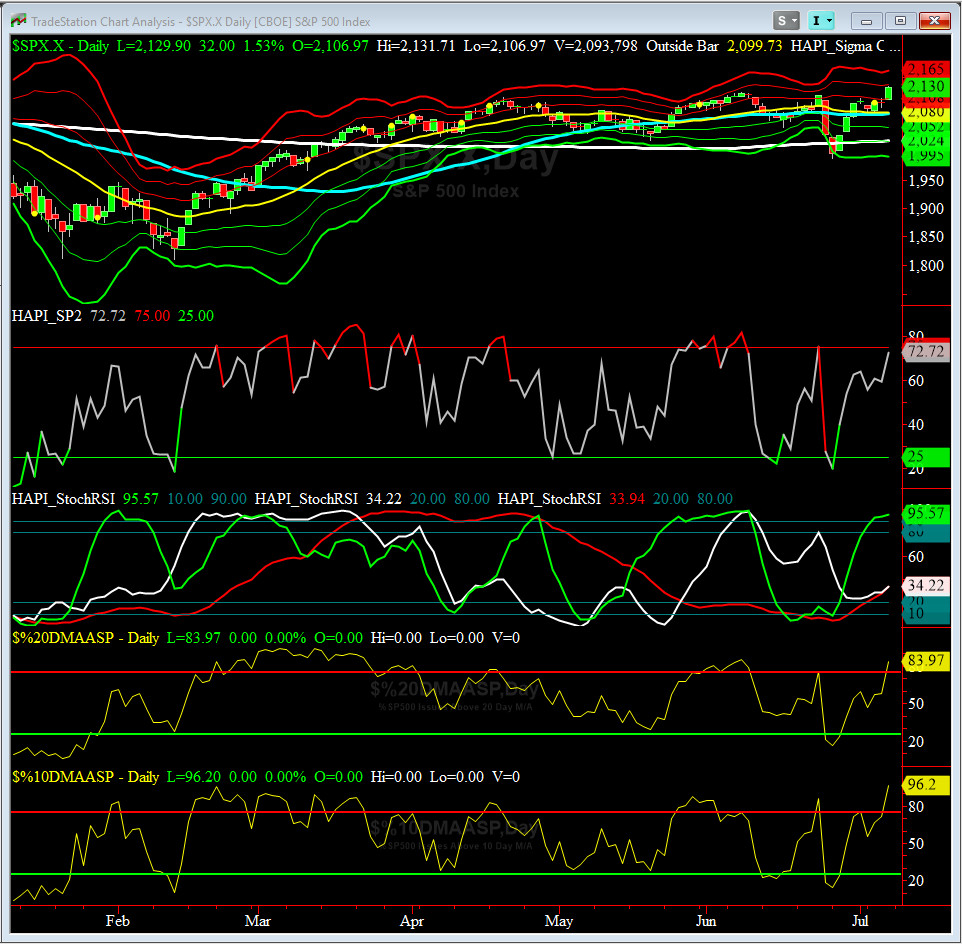
Most recent S&P-500 Cash Index (SPX): 2129.90 up +26.95 (up +1.28%) for the week ending on Friday, July 8th, 2016, which closed near its +2 sigma.
SPX ALL TIME INTRADAY HIGH = 2134.72 (reached on Wednesday, May 20, 2015)
SPX ALL TIME CLOSING HIGH = 2130.82 (reached on Thursday, May 21, 2015)
Current DAILY +2 Sigma SPX = 2137 with WEEKLY +2 Sigma = 2140
Current DAILY 0 Sigma (20 day MA) SPX = 2080 with WEEKLY 0 Sigma = 2060
Current DAILY -2 Sigma SPX = 2024 with WEEKLY -2 Sigma = 1980
NYSE McClellan Oscillator = +155 (-150 is start of the O/S area; around -275 to -300 area or lower, we go into the “launch-pad” mode, over +150, we are in O/B area)
NYSE Breadth Thrust = 59 (40 is considered as oversold and 65 as overbought)
SPX is gunning for its Intraday & Closing ATHs put in some 14 months ago.......
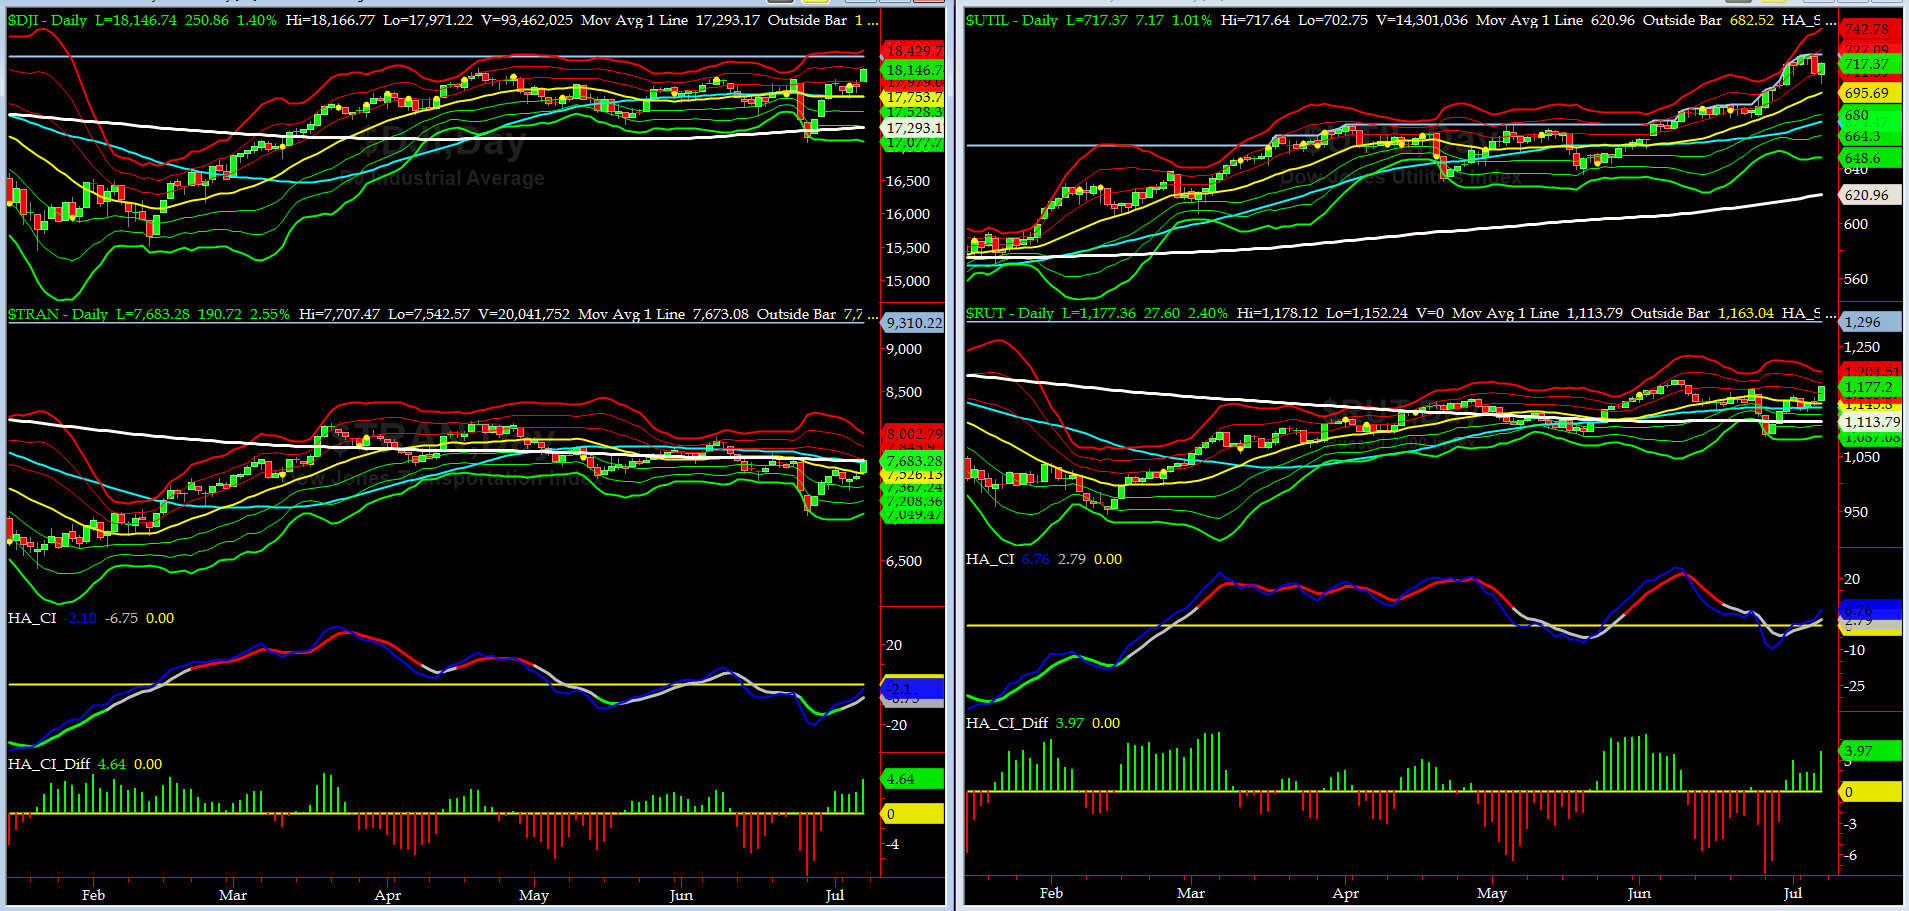
Canaries [in the Coal Mine] Chart for DJ TRAN & RUT Indices
200-Day MA DJ TRAN = 7673 or 0.1% below DJ TRAN (max observed in last 5 yrs = 20.2%, min = -20.3%)
200-Day MA RUT = 1113 or 5.7% below RUT (max observed in last 5 yrs = 21.3%, min = -22.6%)
DJ Transports (proxy for economic conditions 6 to 9 months hence) chart pattern is looking a lot better since we discussed here last. It closed at its +1 sigma on Friday.
Russell 2000 Small Caps (proxy for RISK ON/OFF) rallied sharply in the last 2 weeks. RISK-ON is baaaaaaak.
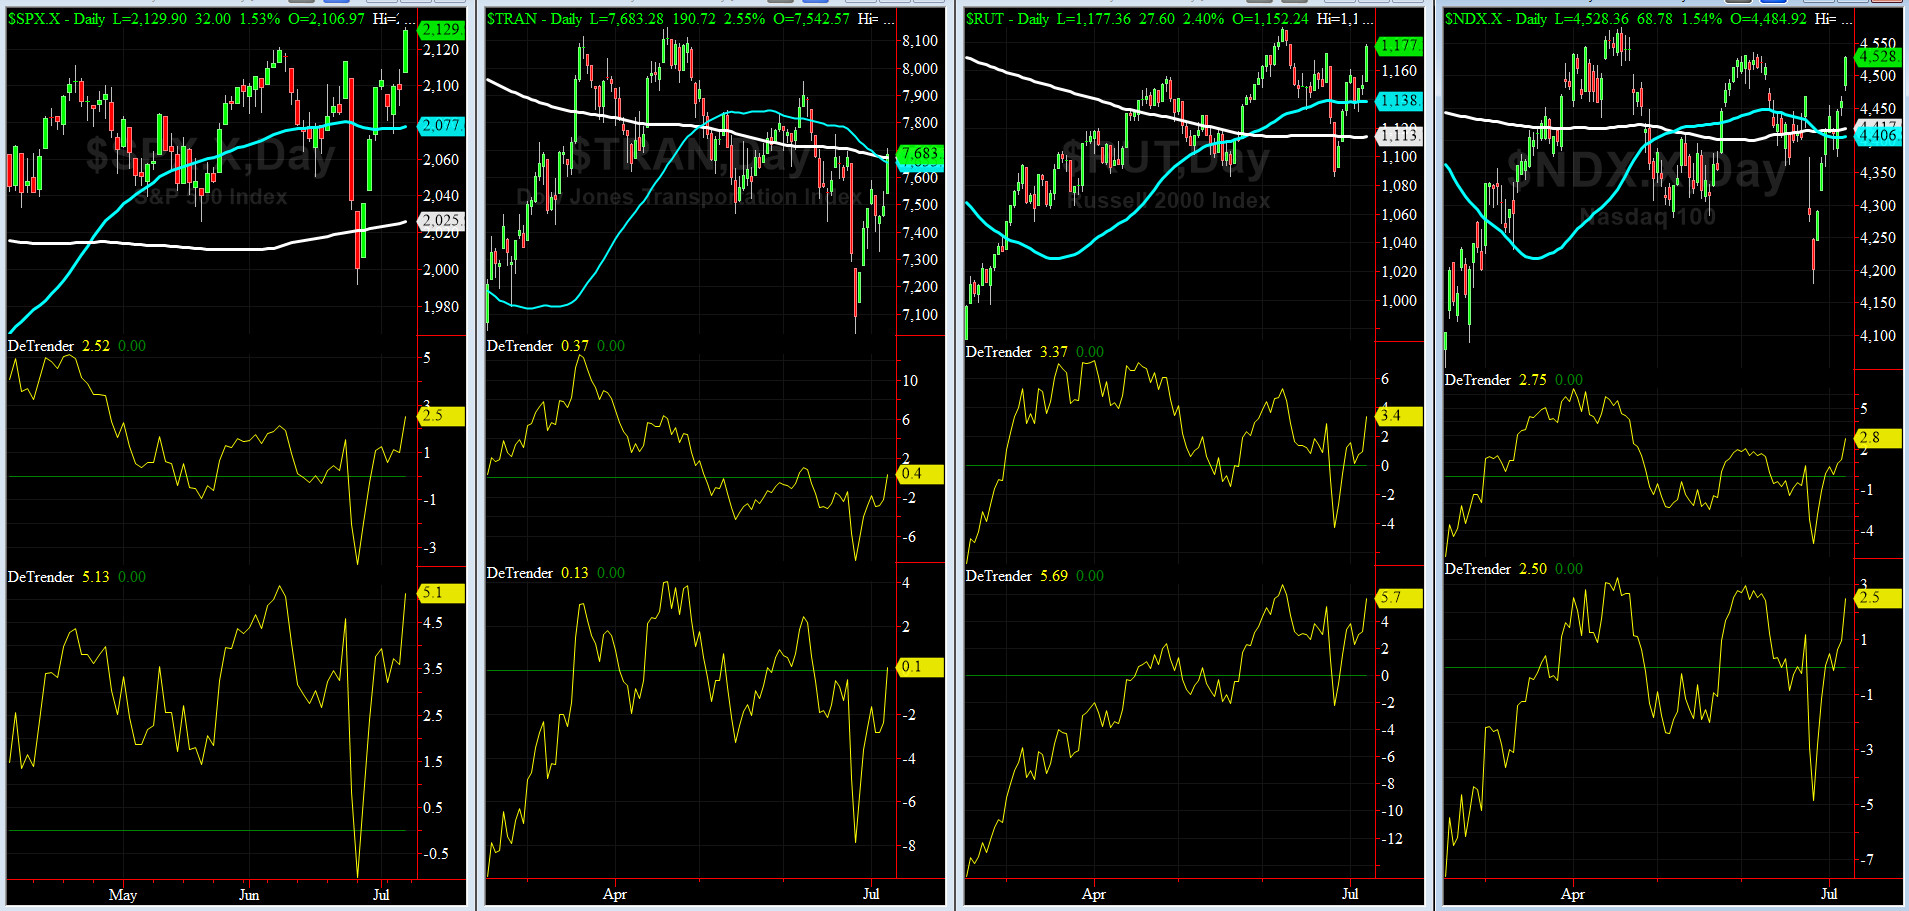
DeTrenders Charts for SPX, NDX, TRAN & RUT Indices
50-Day MA SPX = 2077 or 2.5% below SPX (max observed in last 5 yrs = +8.6%, min = -9.3%)
200-Day MA SPX = 2025 or 5.1% below SPX (max observed in last 5 yrs = 15.2%, min = -14%)
This week ALL of our Eight DeTrenders are POSITIVE. DeTrenders for TRAN & RUT continue to get our attention.
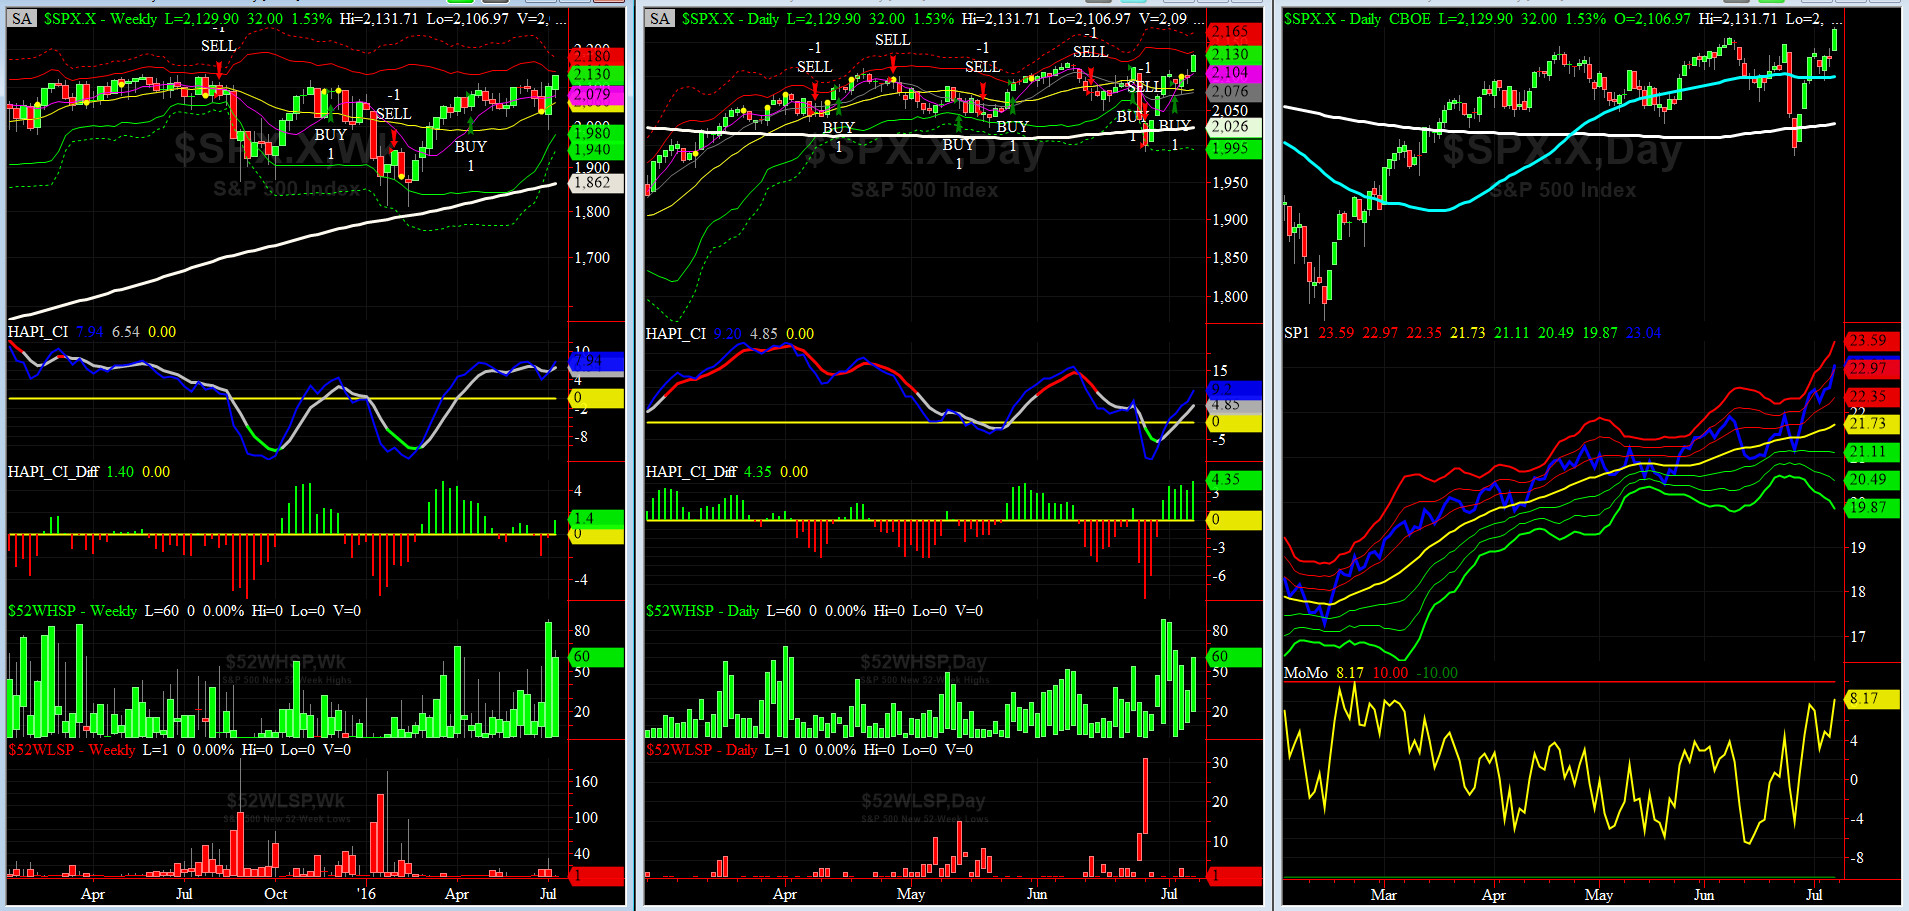
HA_SP1_Momo Chart
WEEKLY Timing Model = on a BUY Signal since Friday 4/15/16 CLOSE
DAILY Timing Model = on a BUY Signal since Tuesday 7/5/16 CLOSE
Max SPX 52wk-highs reading last week = 65 (over 120-140, the local maxima is in)
Max SPX 52wk-Lows reading last week = 3 (over 40-60, the local minima is in)
HA_SP1 = at its +2 sigma channels
HA_Momo = +8.2 (reversals most likely occur above +10 or below -10)
Worth noting: our coveted HA_Momo is getting near its overbought territory.
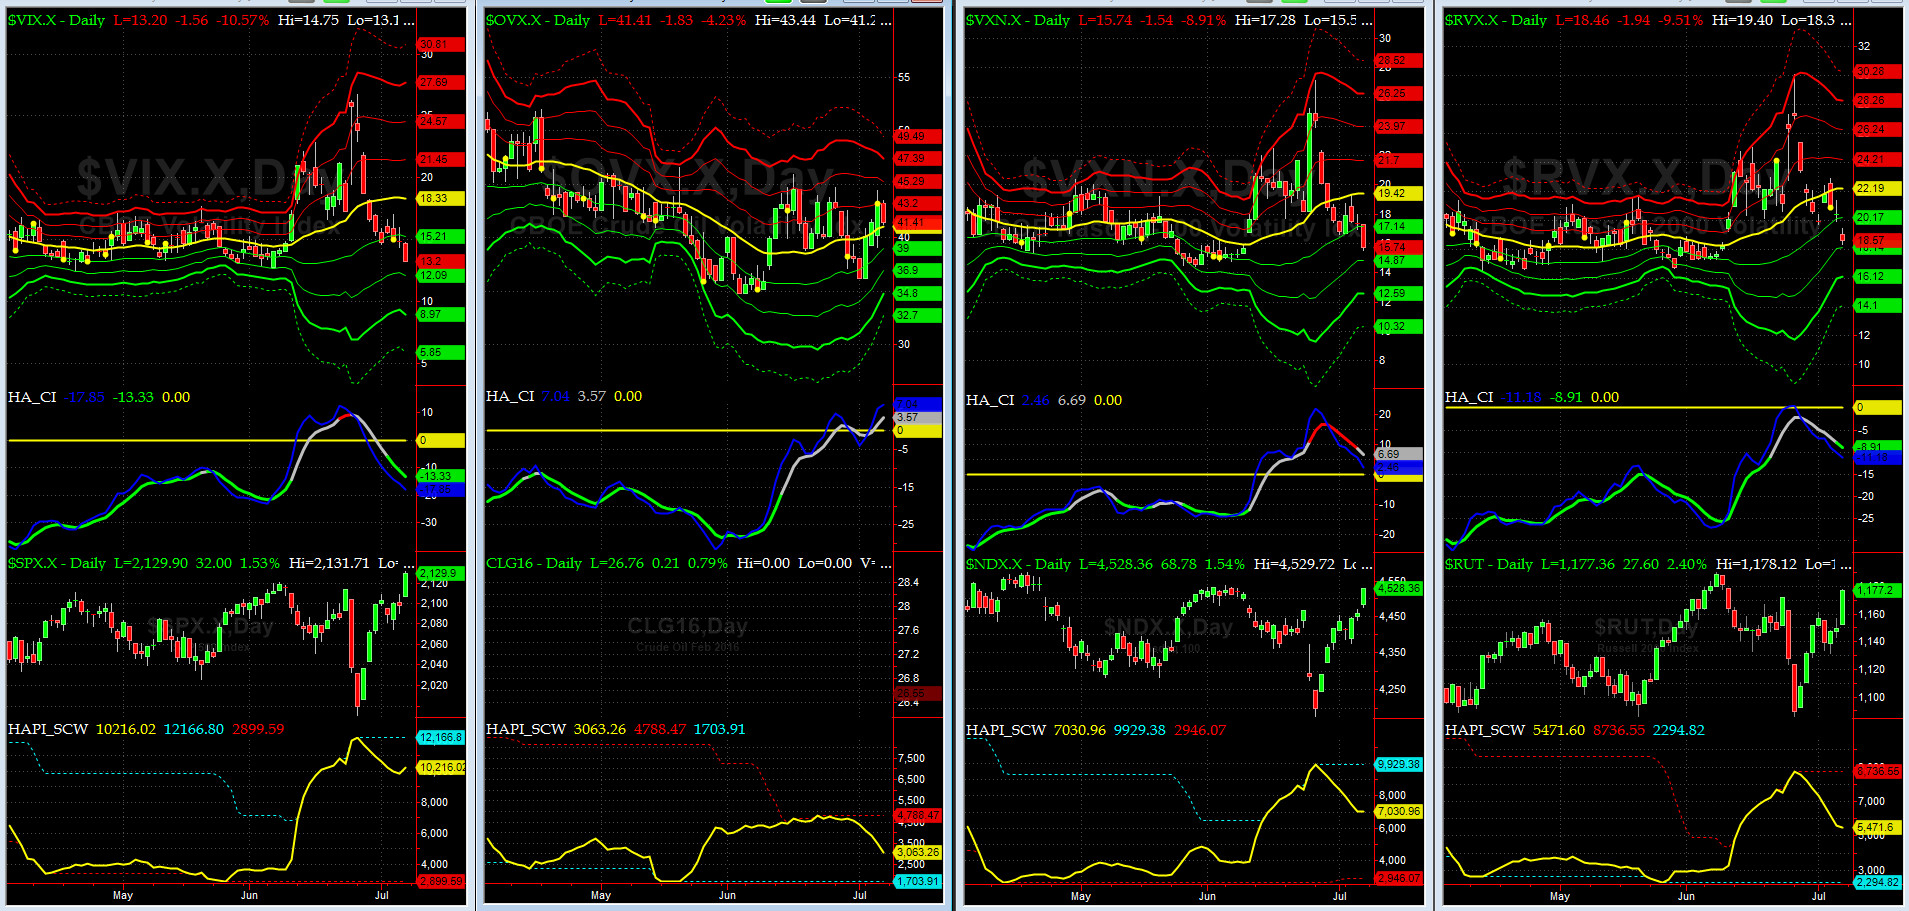
Vol of the Vols Chart
VIX = 13.2 is now nearing -2 sigma (remember it’s the VIX’s vol pattern (its sigma channels) that matters, and not the level of VIX itself (this is per Dr. Robert Whaley, a great mentor and the inventor of original VIX, now called VXO). VIX usually peaks around a test of its +4 sigma).
As discussed here two weeks ago, VIX pulled back and it was much faster than most expected, including but not limited to, yours truly & @Capt_Tiko!!
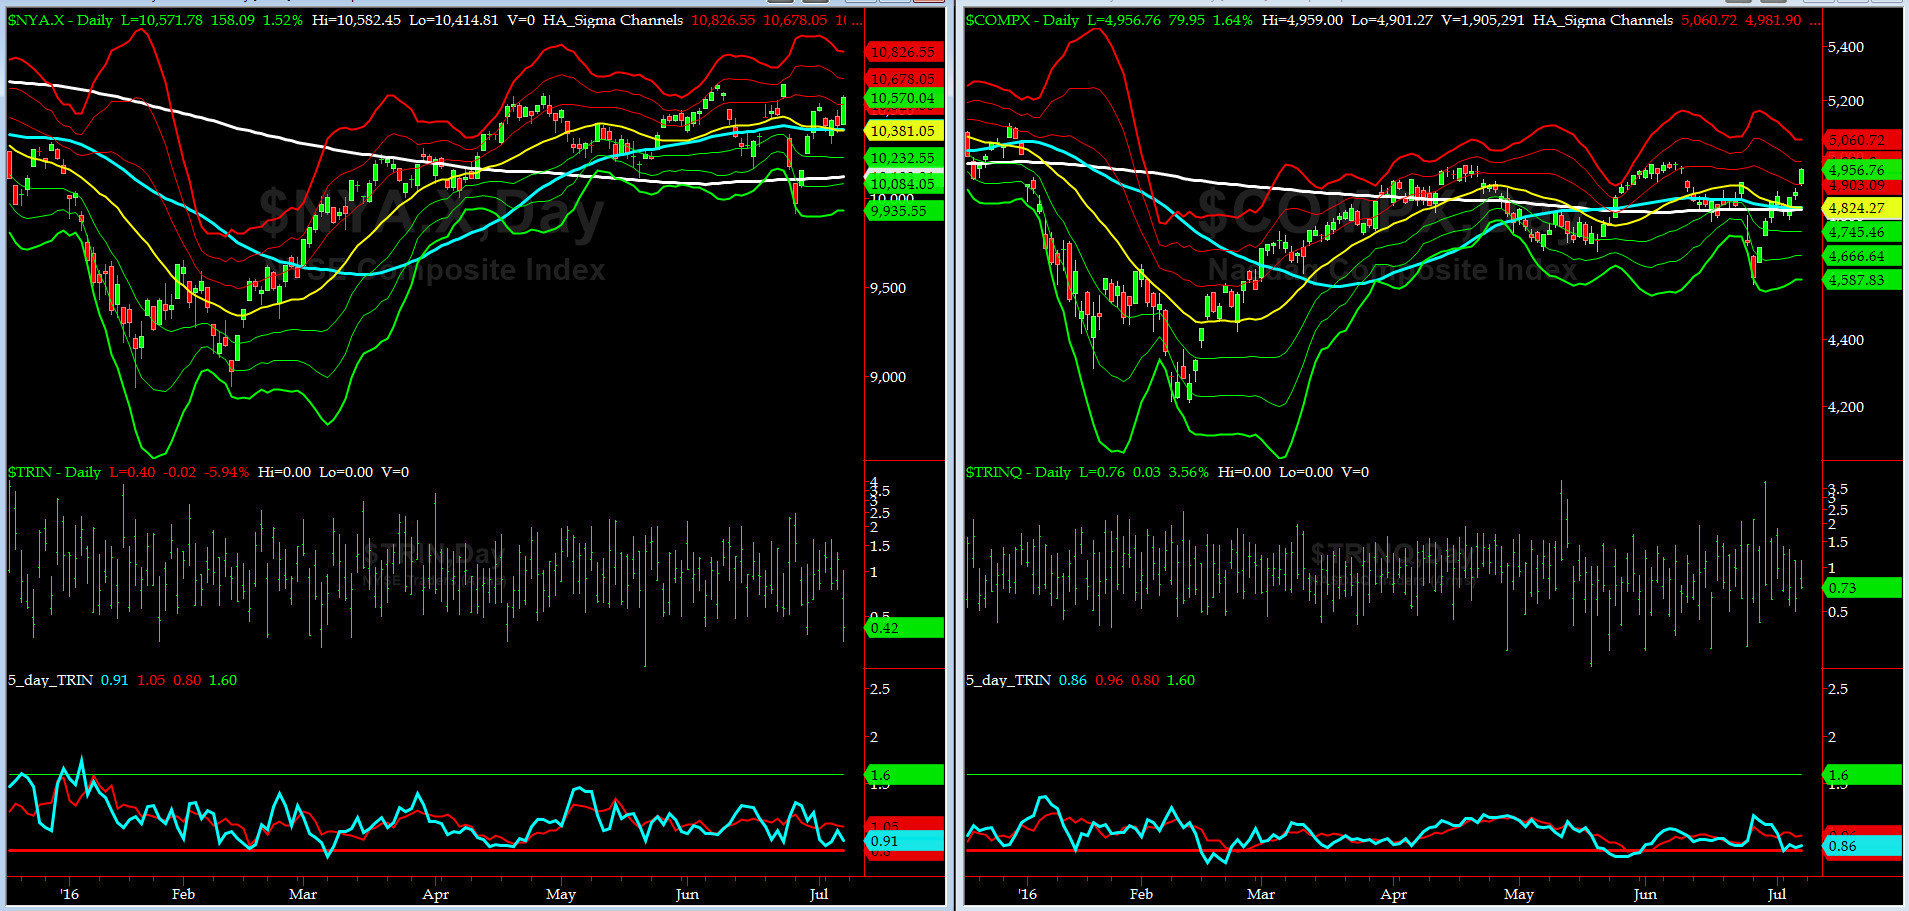
5-day TRIN & TRINQ Charts
SELL SIGNALs on BOTH charts here........
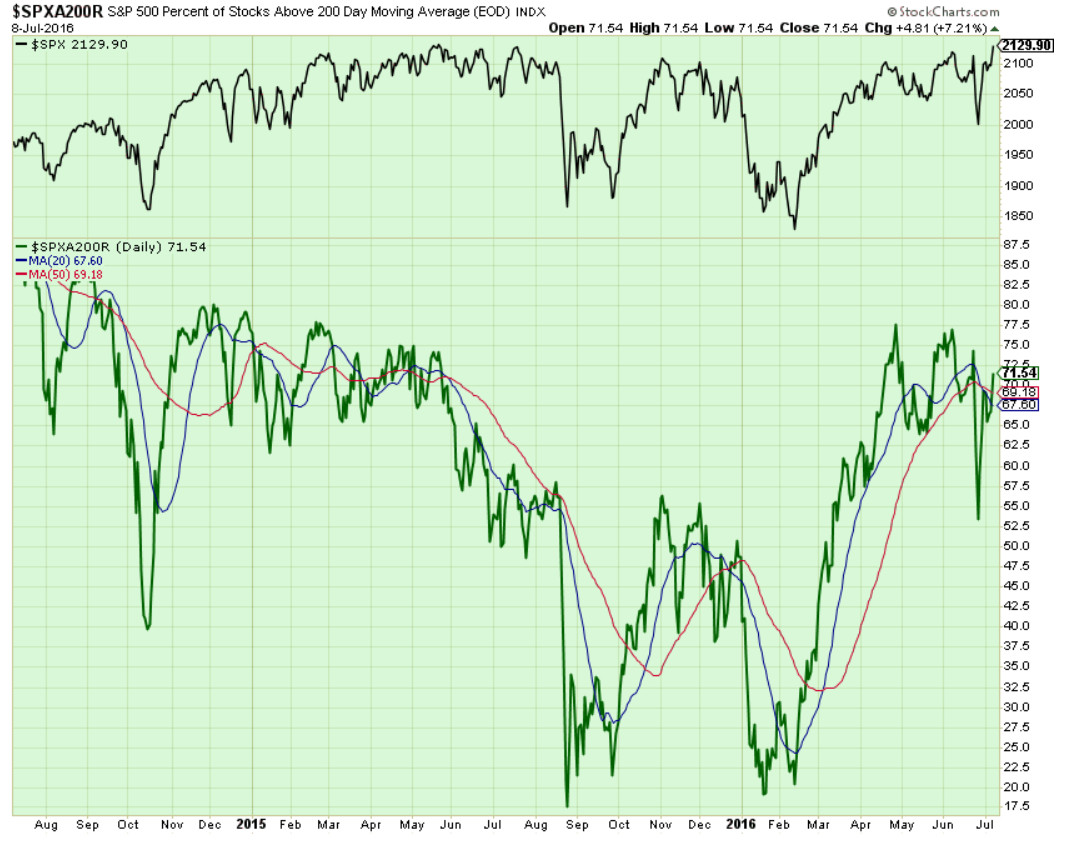
Components of SPX above their respective 200day MA Chart
This scoring indicator is back up to 71% now. Note the bearish divergences (since April & May Highs).... GOT TUNA?
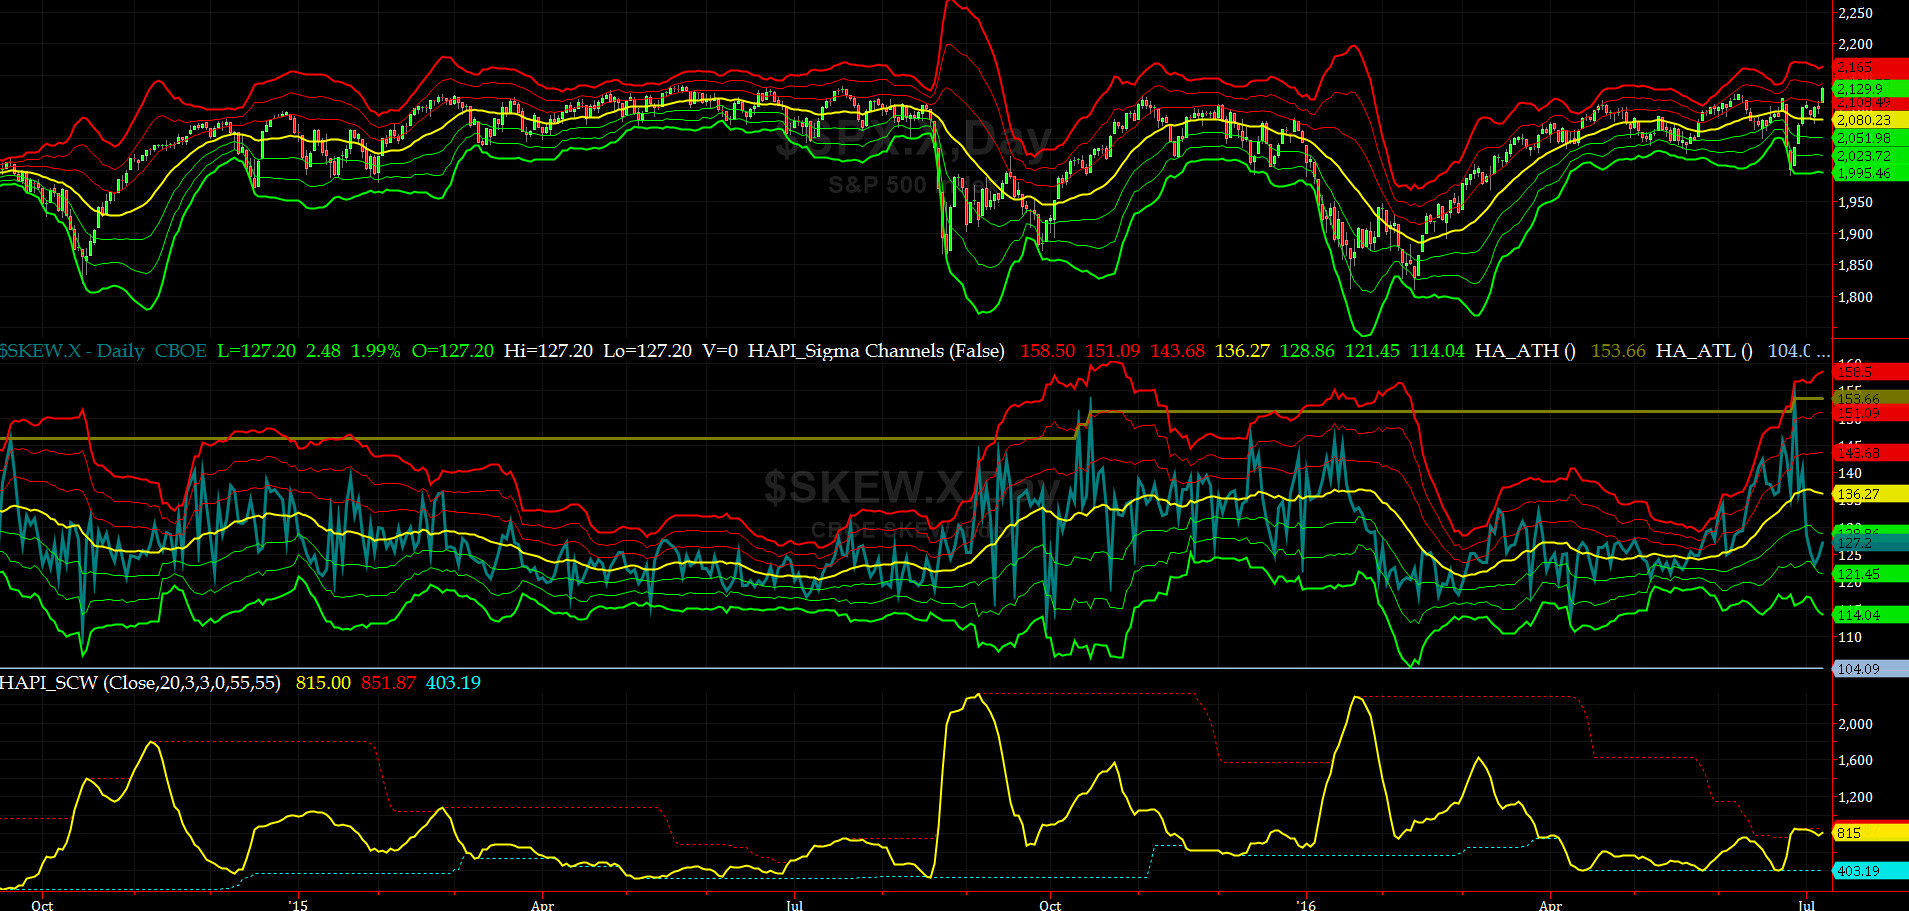
SPX SKEW (Tail Risk) Chart
SPX SKEW (Tail Risk) = rose to 153 (over its design limit of 150) and touched its +3 sigma on June 28th (normal = 120-125, range 100-150)
Last Friday, it closed at 127 after falling like lead in water to 123 in 5 sessions !!
All Quiet on the Mid-Western Front? Smart Money thinks so. This PDI thinks otherwise, but then again, what do we know!! In these cases, we shall yield to @Capt_Tiko and his great wisdom (He luvs #Rumi)
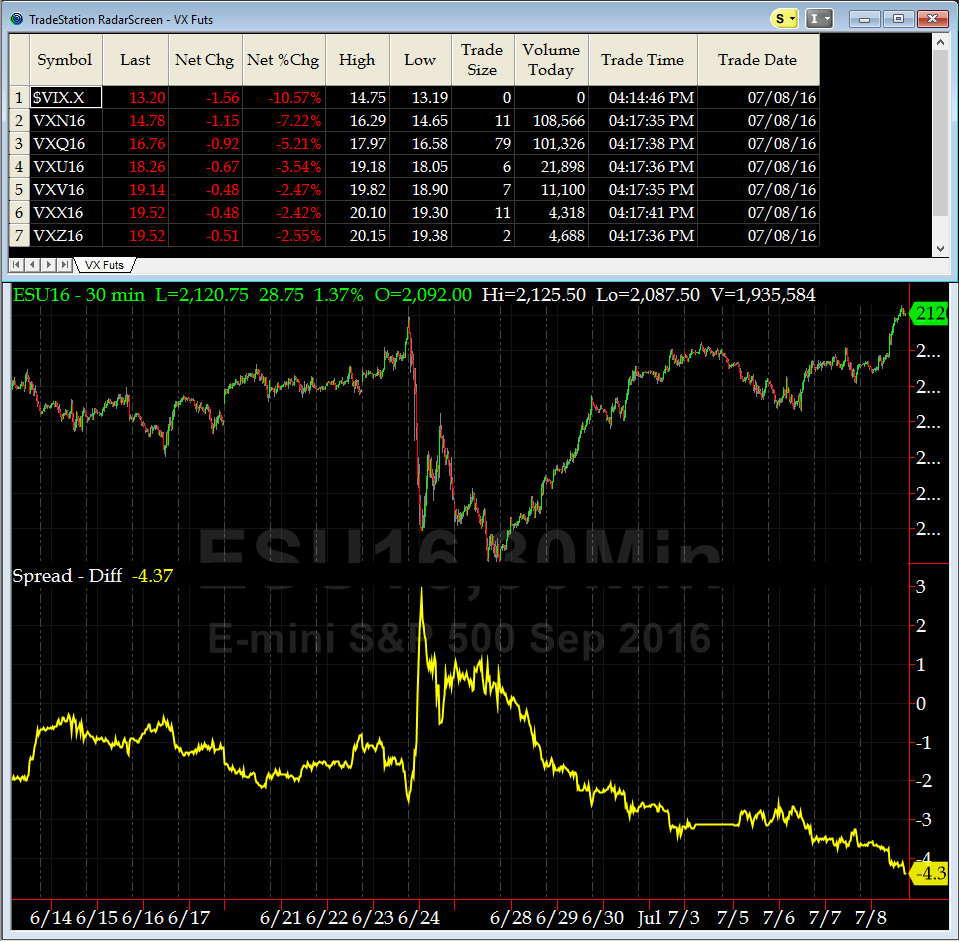
3-month VIX Futures Spread(VX) Chart
Notice starting this week, we shall be using the enhanced chart ( VX spread vs ES)
Our 3-month VIX Futures Spread (LONG JUL16 & SHORT OCT16) closed at -4.33 on Friday. As you can tell, this indicator says we are extremely overbought.
HA_SP2 Chart
HA_SP2 = 72 (Buy signal <= 25, Sell Signal >= 75)
This indicator also says we are very near Overbought territory.
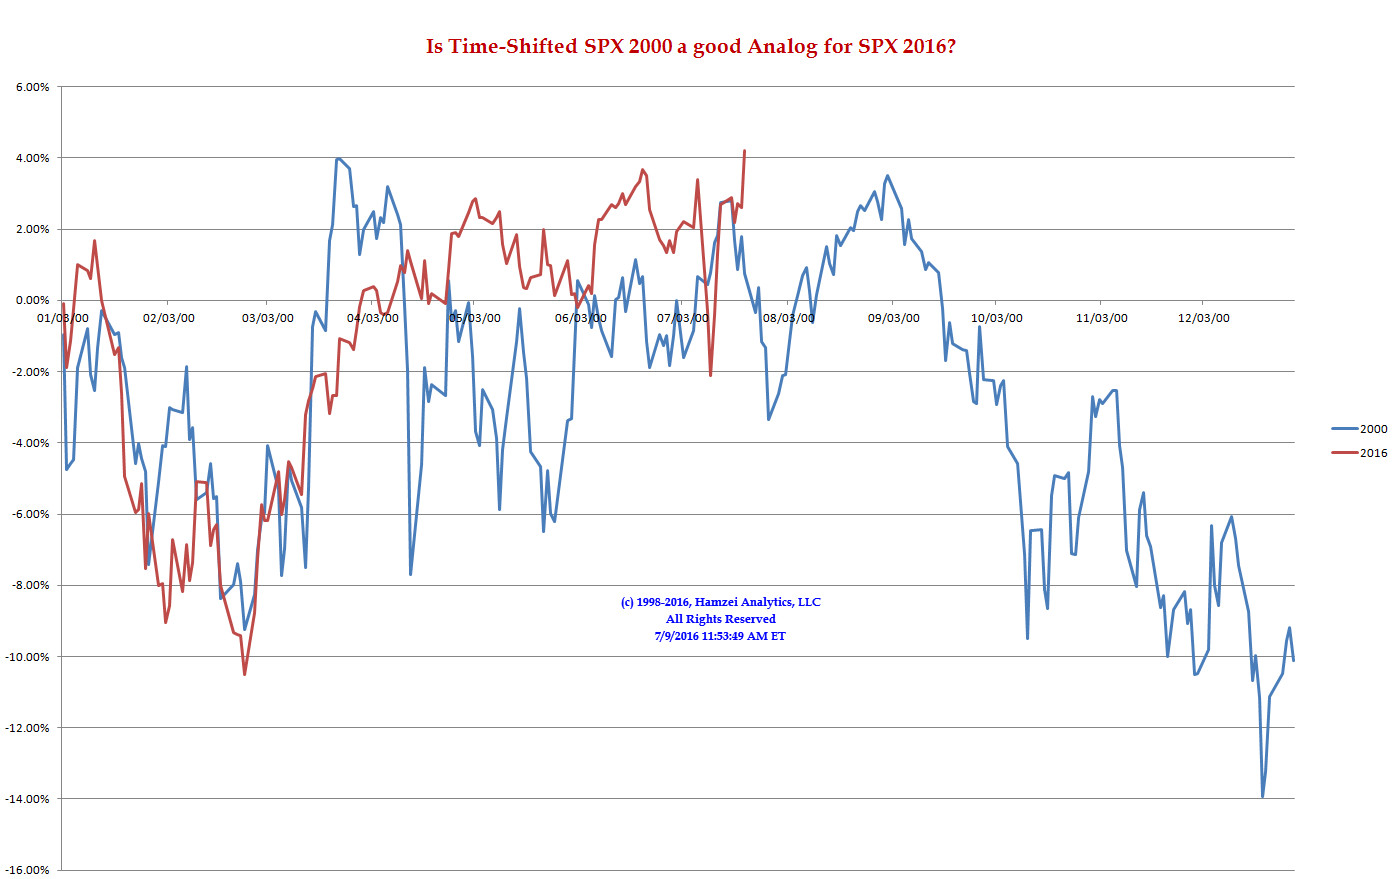
SPX 2000 Analog for SPX 2016
Simply Speechless
We never liked a market that does not follow our instructions, reminds us of #Bibi.
LOL
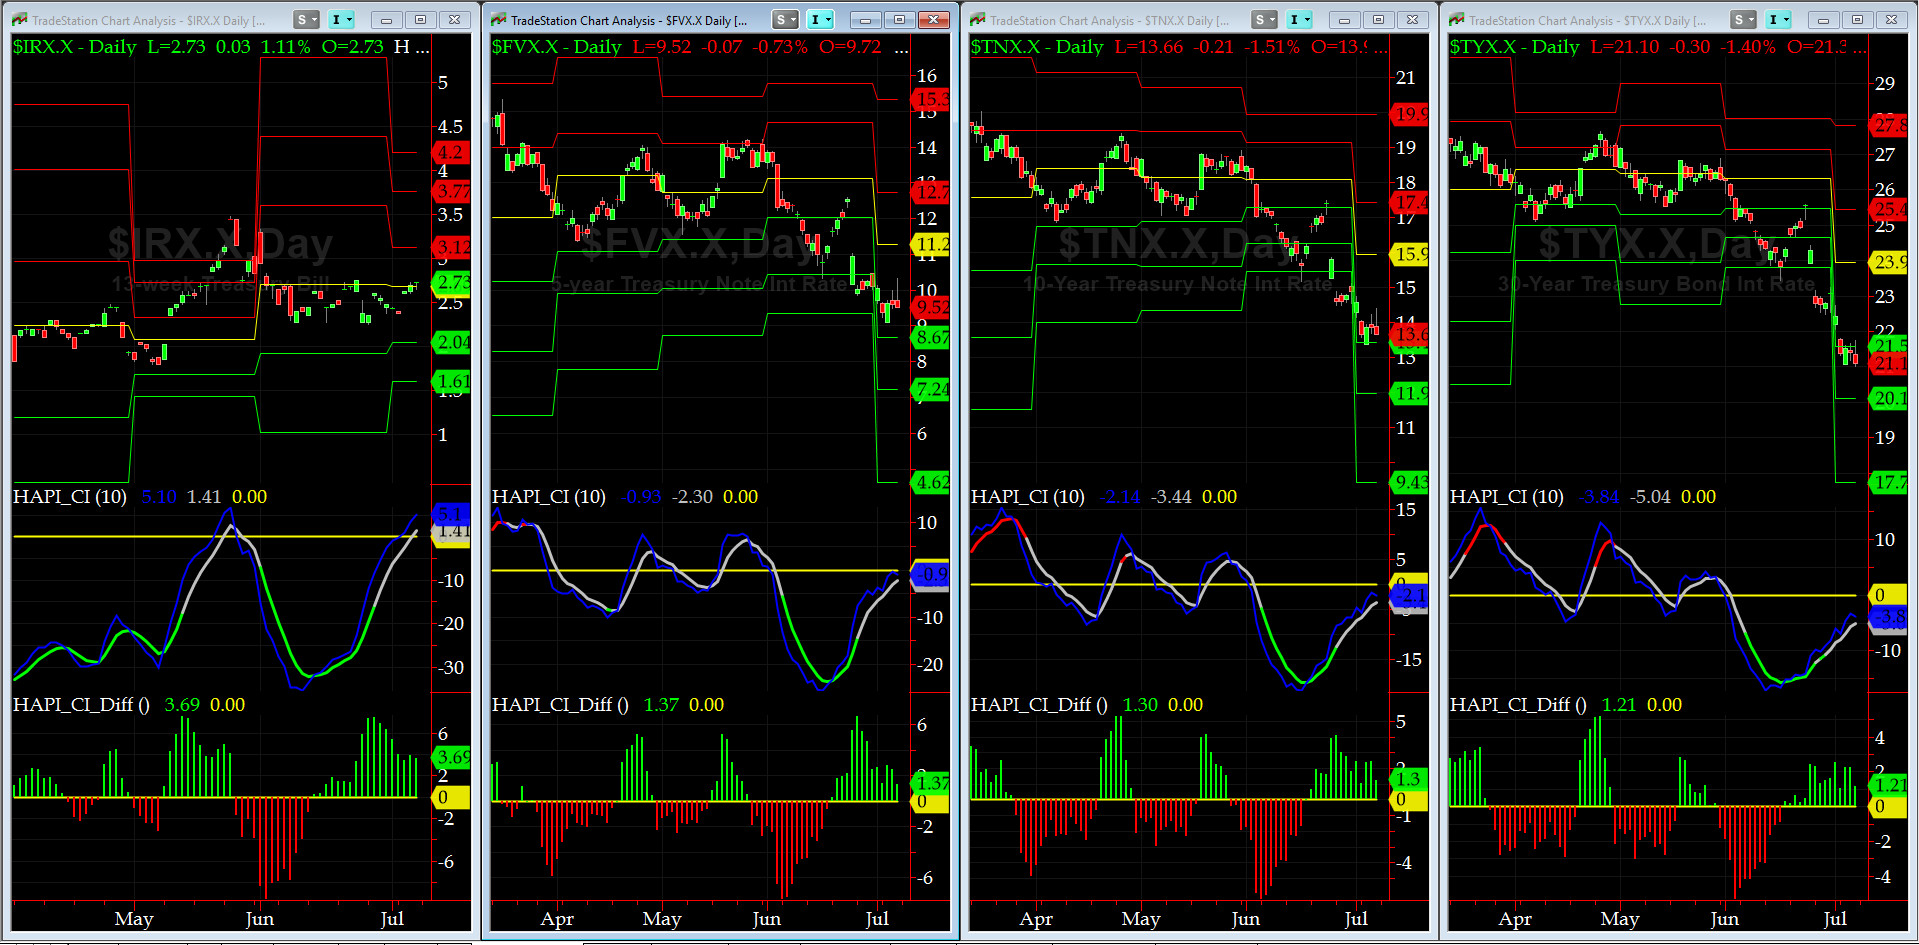
US Treasury T-Notes & T-Bonds Yields Chart
Relatively quiet week in the US Treasury Complex post Brexit. (Flight to Quality continues unabated.
Fari Hamzei
|


 Proactive Market Timing


