|
Sunday, July 24, 2016, 1100ET
Market Timing Charts, Analysis & Commentary for Issue #152

Timer Charts of S&P-500 Cash Index (SPX) & NASDAQ-100 Cash Index (NDX)
Most recent S&P-500 Cash Index (SPX): 2175.03 up +13.29 (up +0.61%) for the week ending on Friday, July 22nd, 2016, which closed just above its +1 sigma.
SPX ALL TIME INTRADAY HIGH = 2175.63 (reached on Wednesday, July 20, 2016)
SPX ALL TIME CLOSING HIGH = 2175.03 (reached on Friday, July 22, 2016)
Current DAILY +2 Sigma SPX = 2220 with WEEKLY +2 Sigma = 2159
Current DAILY 0 Sigma (20 day MA) SPX = 2019 with WEEKLY 0 Sigma = 2080
Current DAILY -2 Sigma SPX = 2017 with WEEKLY -2 Sigma = 2000
NYSE McClellan Oscillator = +57 (-150 is start of the O/S area; around -275 to -300 area or lower, we go into the �launch-pad� mode, over +150, we are in O/B area)
NYSE Breadth Thrust = 59 (40 is considered as oversold and 65 as overbought)
Second week of all time highs for SPX while the GOP Convention reminded us that All is NOW WELL in the Eastern Front. In the meant-time, the Mid-Western Front was taken over by our highly-decorated Roman Legion.

Canaries [in the Coal Mine] Chart for DJ TRAN & RUT Indices
200-Day MA DJ TRAN = 7677 or 3.8% below DJ TRAN (max observed in last 5 yrs = 20.2%, min = -20.3%)
200-Day MA RUT = 1118 or 8.5% below RUT (max observed in last 5 yrs = 21.3%, min = -22.6%)
DJ Transports (proxy for economic conditions 6 to 9 months hence) eased off for most of last week and closed at its +1 sigma.
Russell 2000 Small Caps (proxy for RISK ON/OFF) was flat-lined last week.
We followed @Capt_Tiko's sage advice last week & watched their CI Diffs as both went negative on Thursday. GOT TUNA?
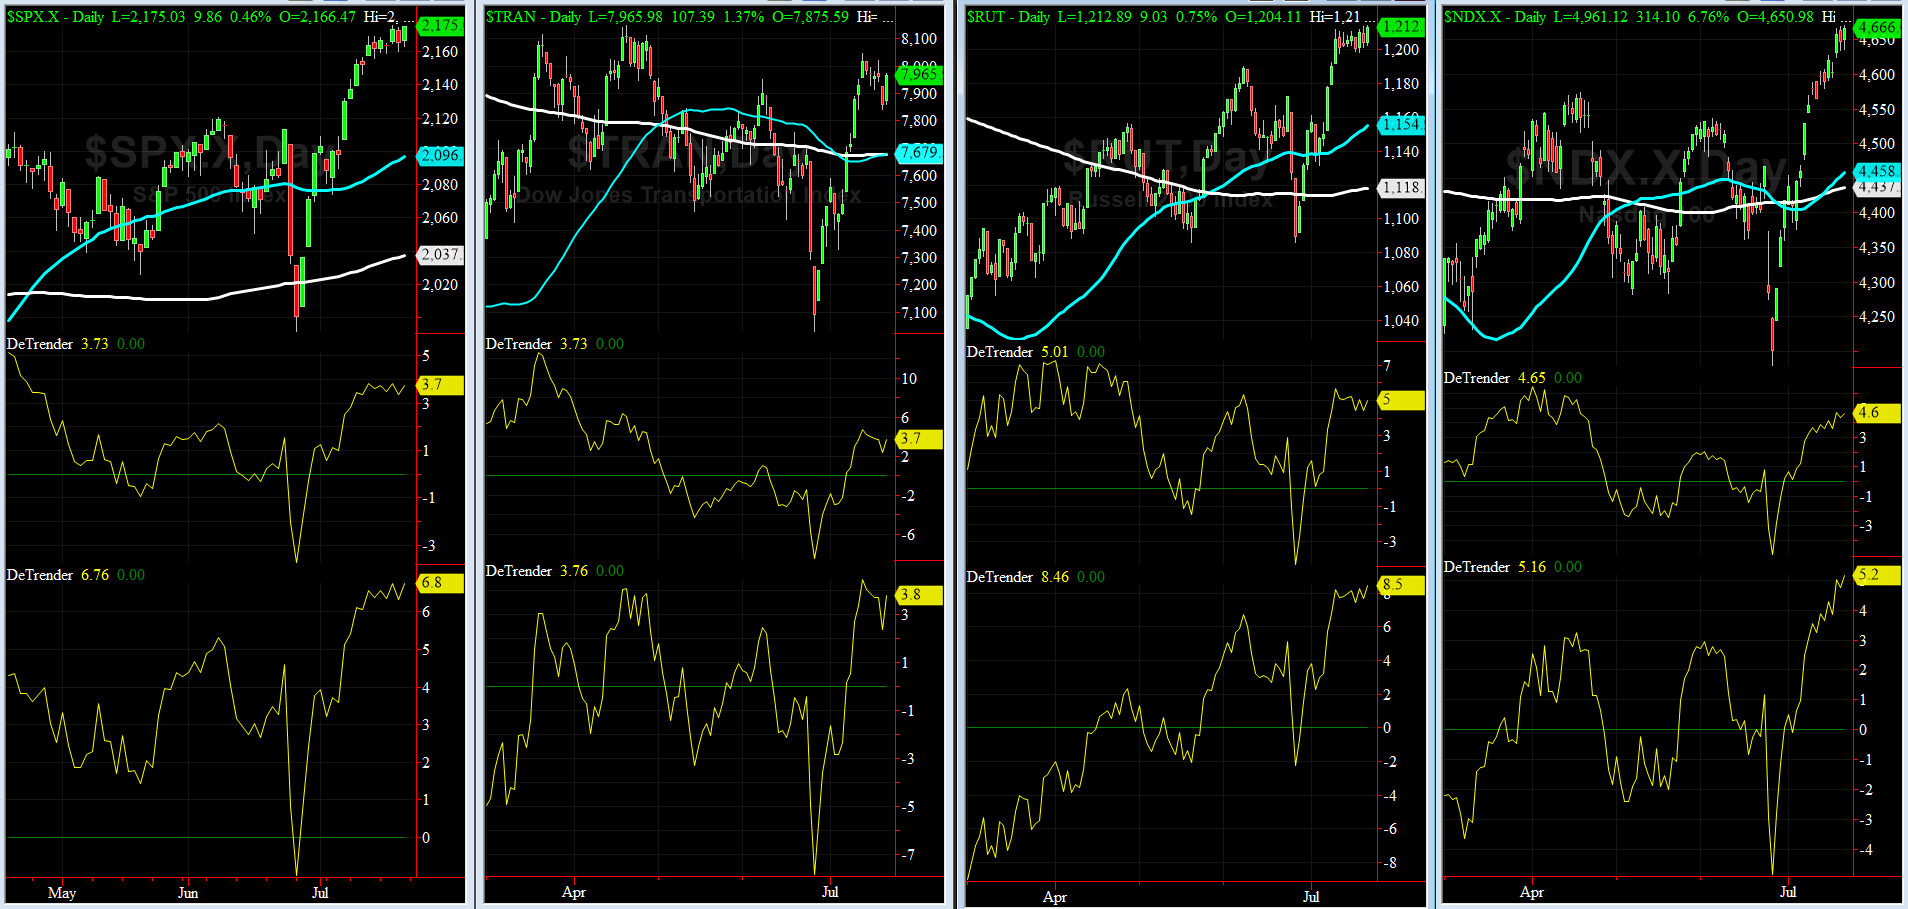
DeTrenders Charts for SPX, NDX, TRAN & RUT Indices
50-Day MA SPX = 2096 or 3.7% below SPX (max observed in last 5 yrs = +8.6%, min = -9.3%)
200-Day MA SPX = 2037 or 6.8% below SPX (max observed in last 5 yrs = 15.2%, min = -14%)
Again, this week ALL of our Eight DeTrenders are POSITIVE.

HA_SP1_Momo Chart
WEEKLY Timing Model = on a BUY Signal since Friday 4/15/16 CLOSE
DAILY Timing Model = on a BUY Signal since Tuesday 7/5/16 CLOSE
Max SPX 52wk-highs reading last week = 40 (over 120-140, the local maxima is in)
Max SPX 52wk-Lows reading last week = 1 (over 40-60, the local minima is in)
HA_SP1 = at its +1 sigma channels
HA_Momo = +2.5 (reversals most likely occur above +10 or below -10)
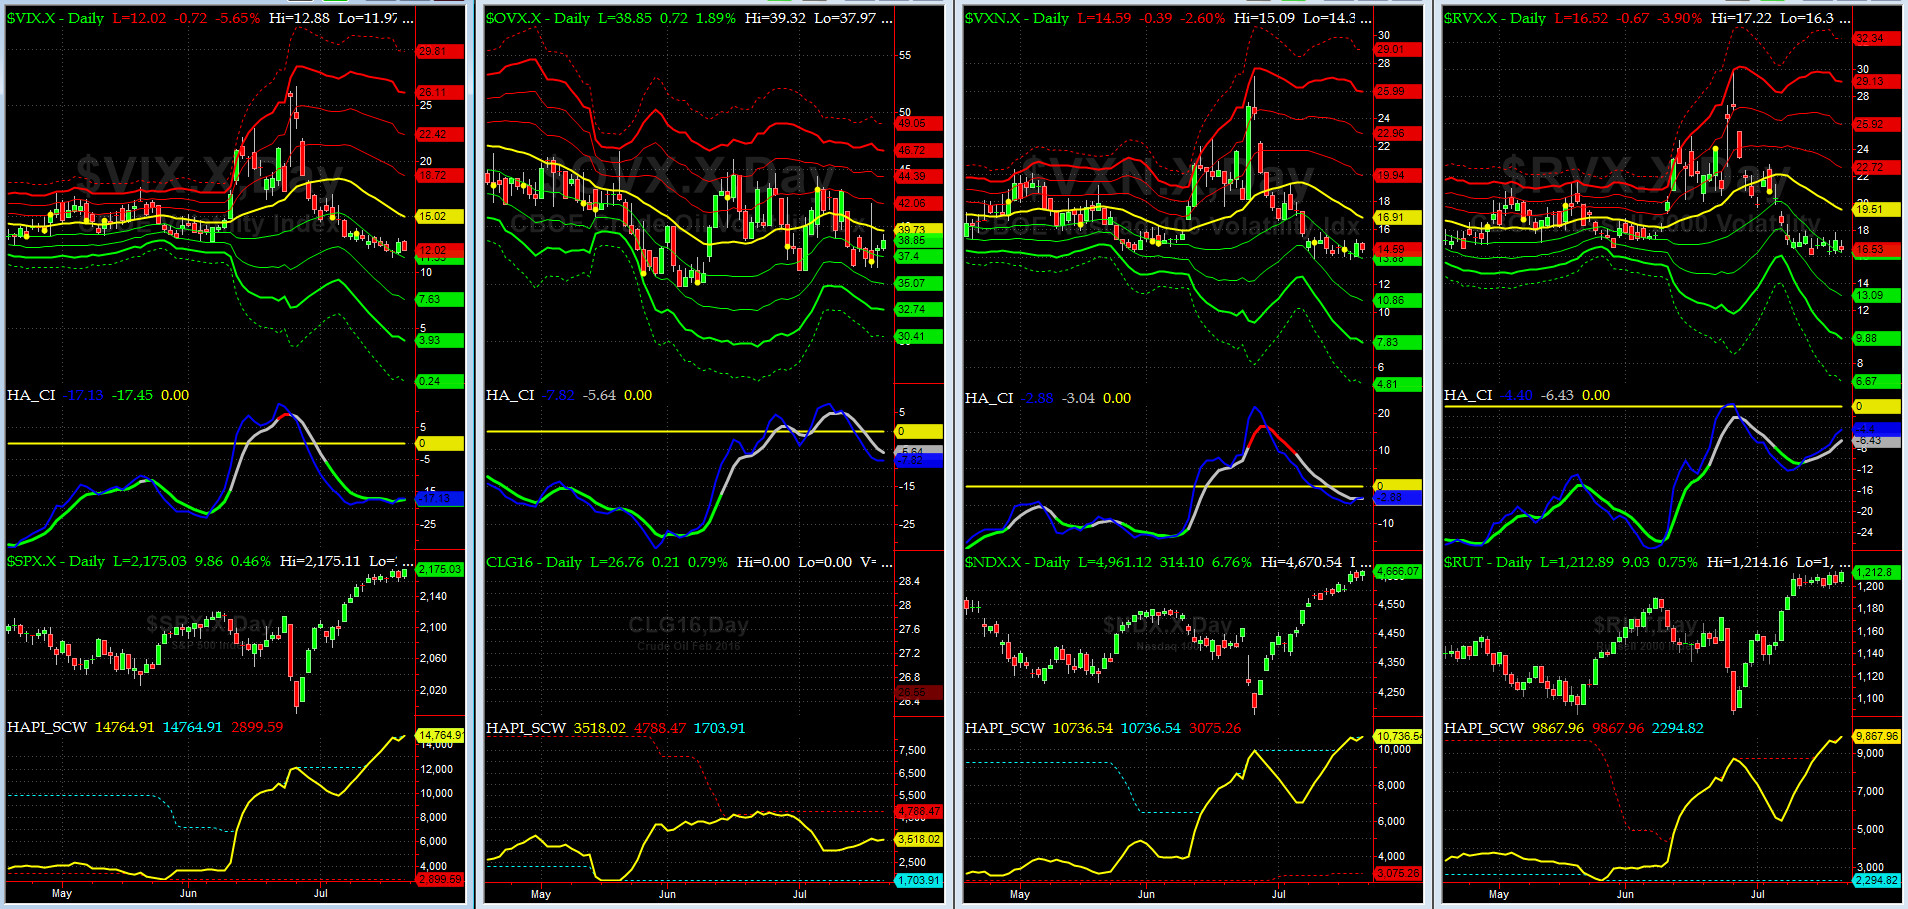
Vol of the Vols Chart
VIX = 12.02 is just above its -1 sigma (remember it�s the VIX�s vol pattern (its sigma channels) that matters, and not the level of VIX itself (this is per Dr. Robert Whaley, a great mentor and the inventor of original VIX, now called VXO). VIX usually peaks around a test of its +4 sigma).
All Vol indices had a fairly quiet week. ROMANs occupied every foxhole.
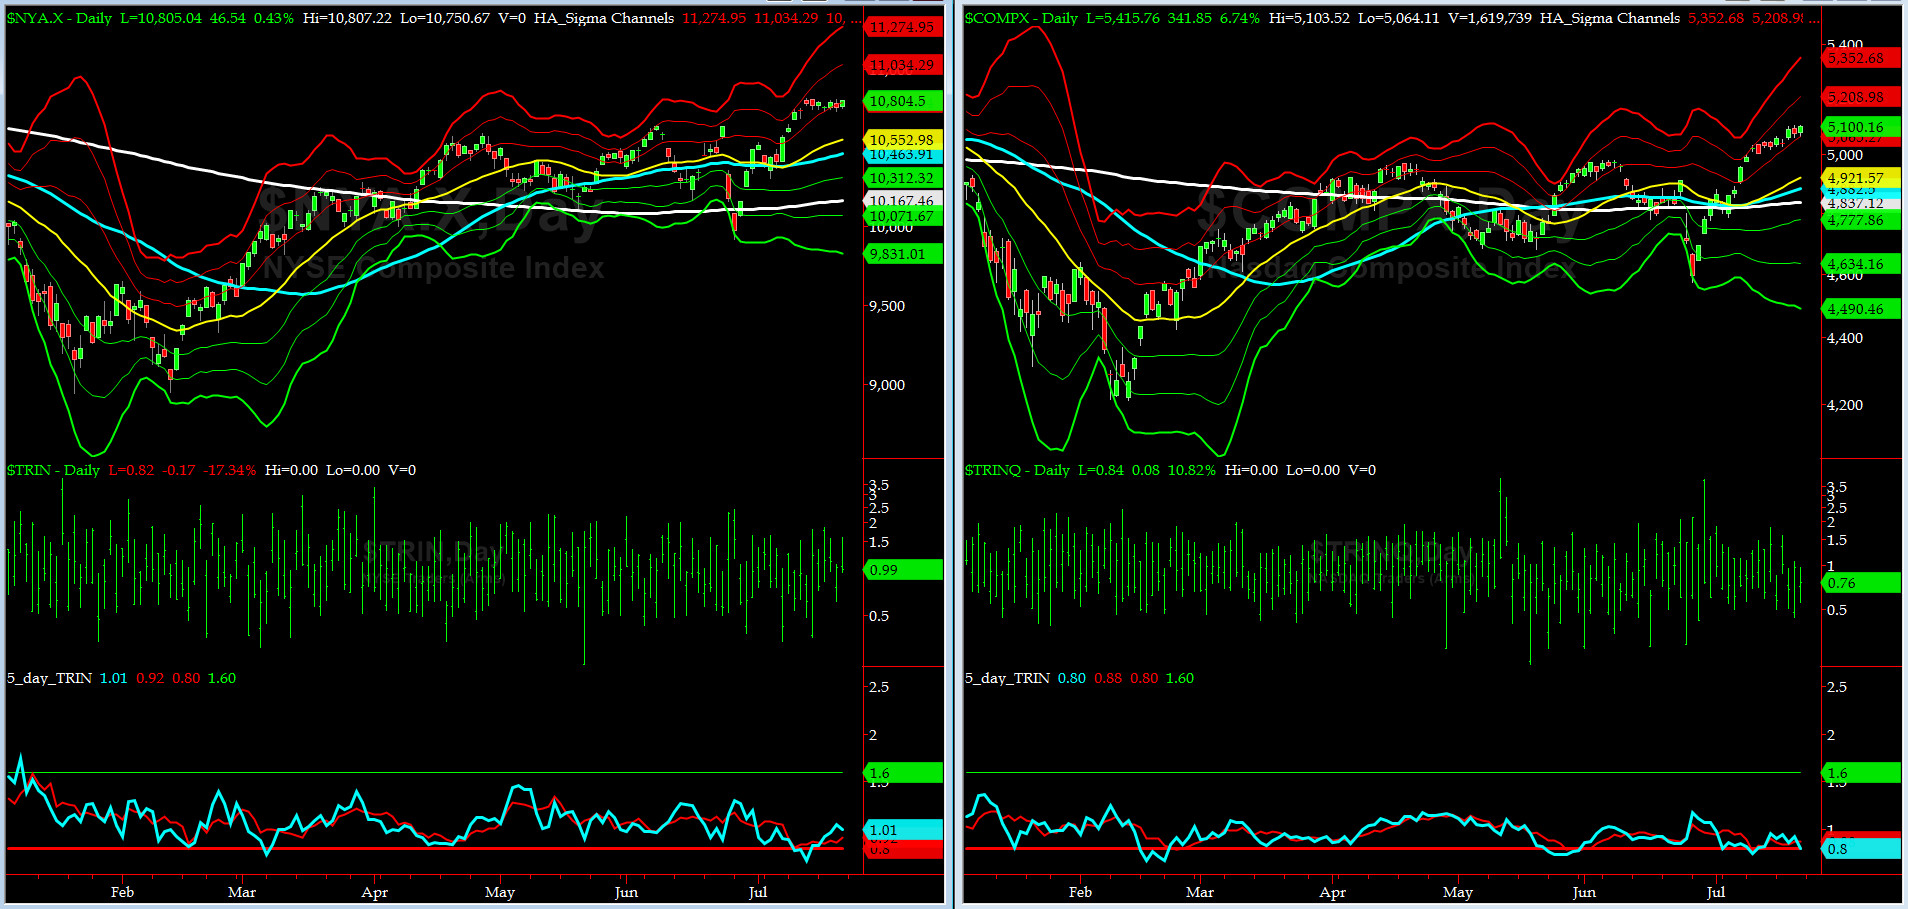
5-day TRIN & TRINQ Charts
BOTH charts continue to be near, or give, SELL SIGNALs here........
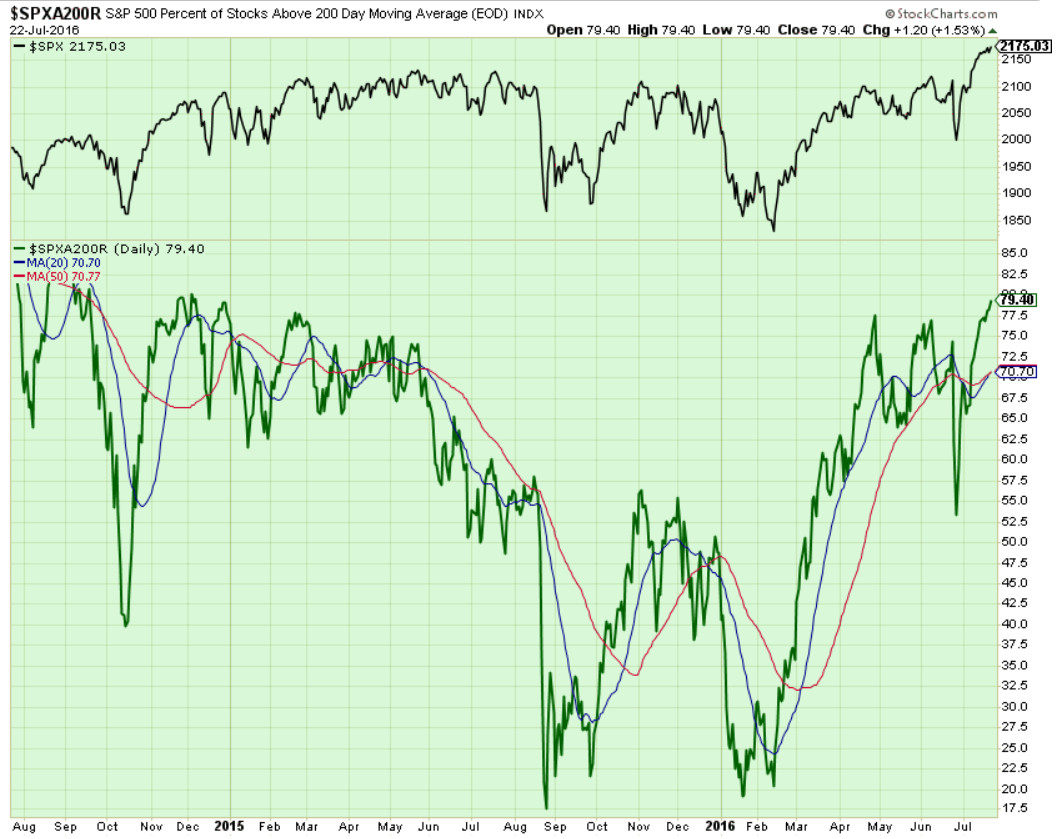
Components of SPX above their respective 200day MA Chart
This scoring indicator is up near 80% now. All bearish divergences have been reset now. What's next? A test of 85% to 90% will be very interesting here, to say the least..
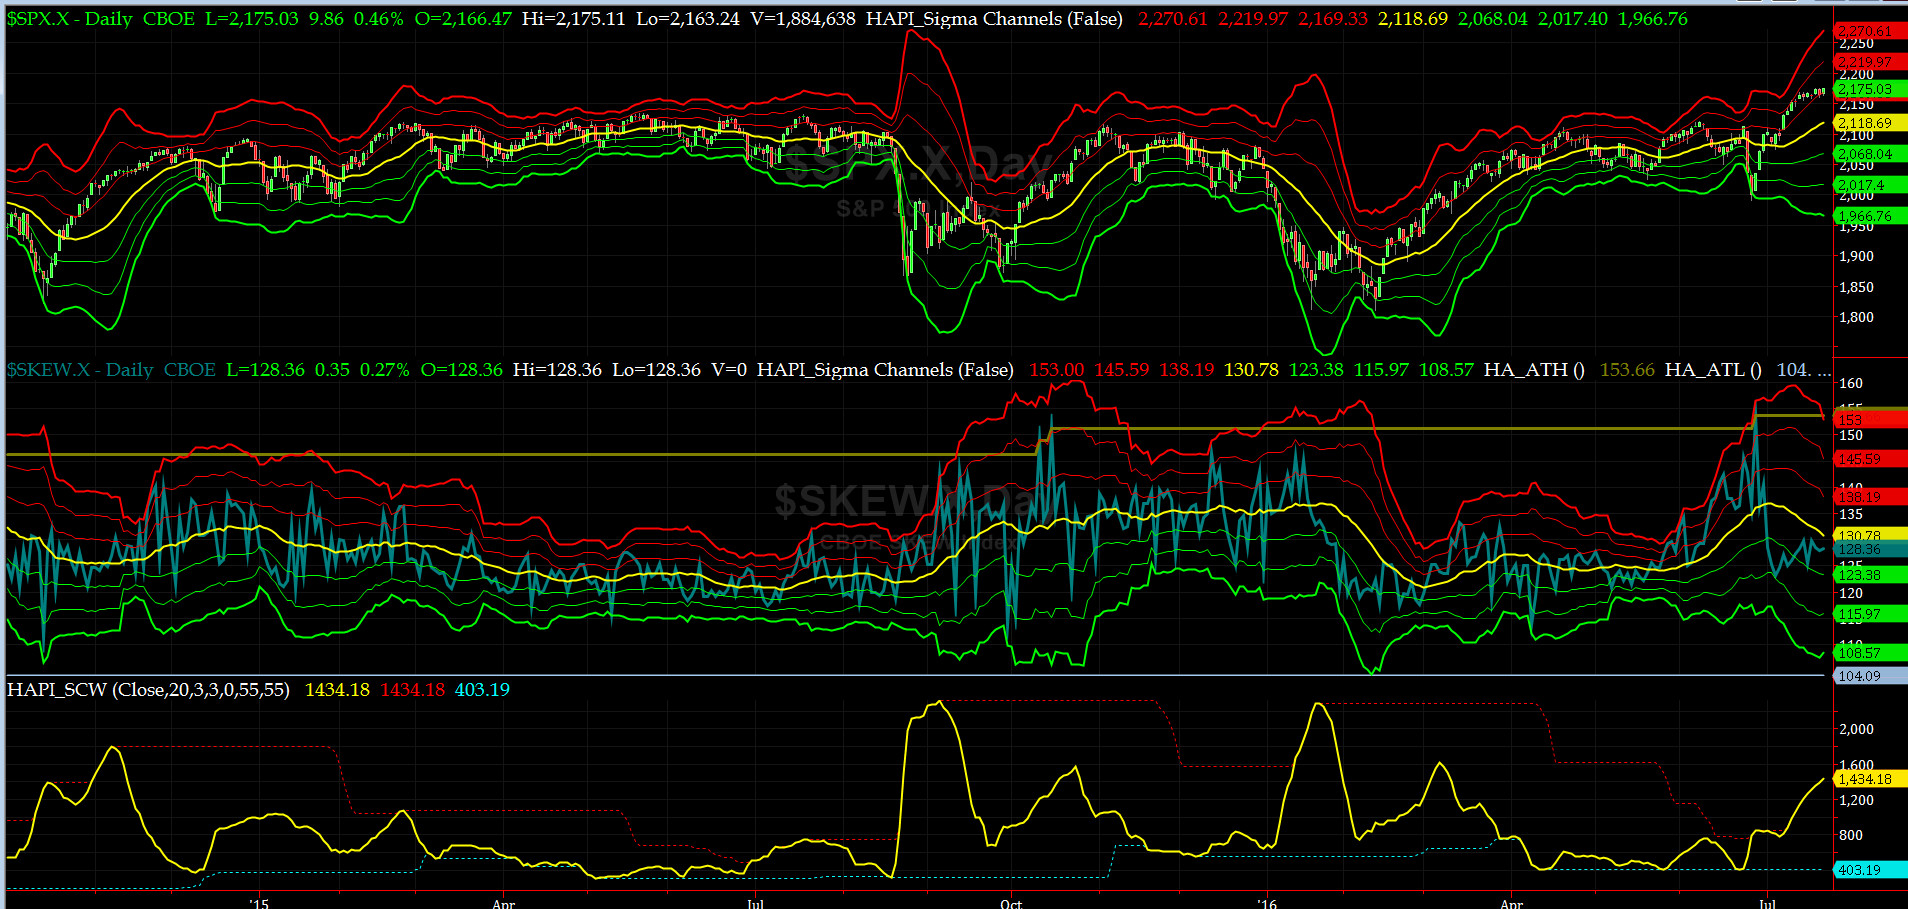
SPX SKEW (Tail Risk) Chart
SPX SKEW (Tail Risk) also flat-lined near 128 (its -1 sigma on July 6th right before June NFP) (normal = 120-125, range 100-150)
All Quiet on the Mid-Western Front? Smart Money contiues to think so.
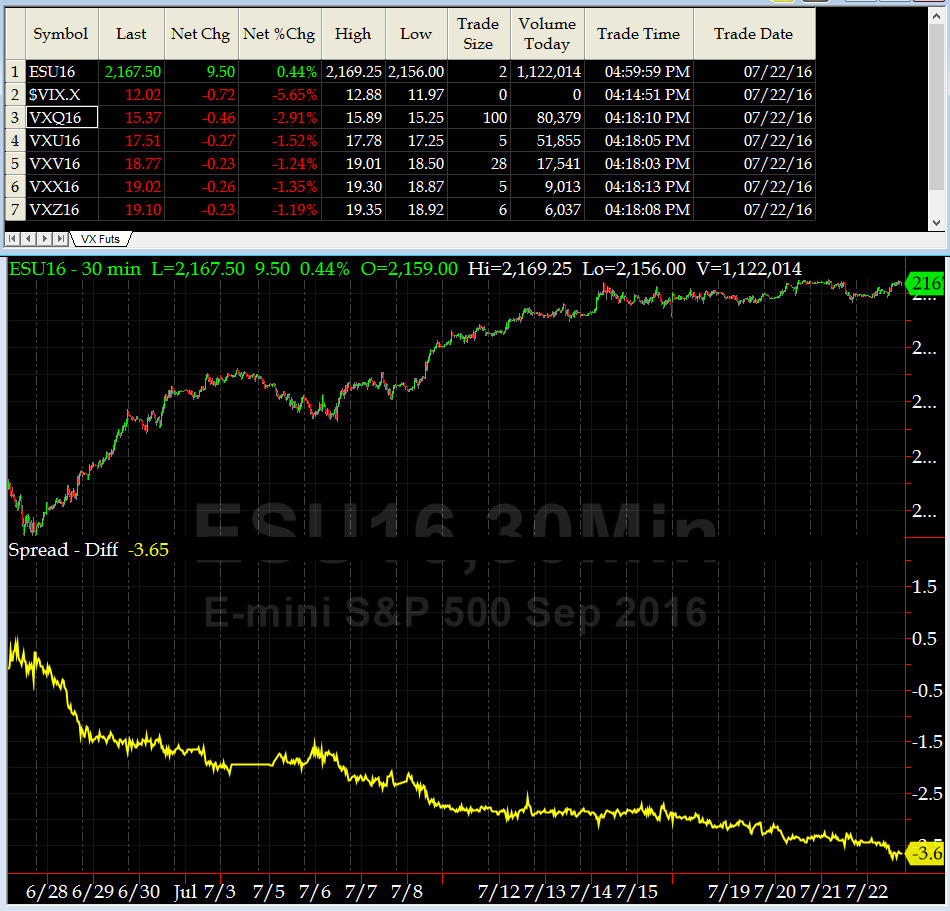
3-month VIX Futures Spread(VX) Chart
Our 3-month VIX Futures Spread (LONG AUG16 & SHORT NOV16) closed at -3.6 on Friday. As you can tell, this indicator says we are extremely overbought.
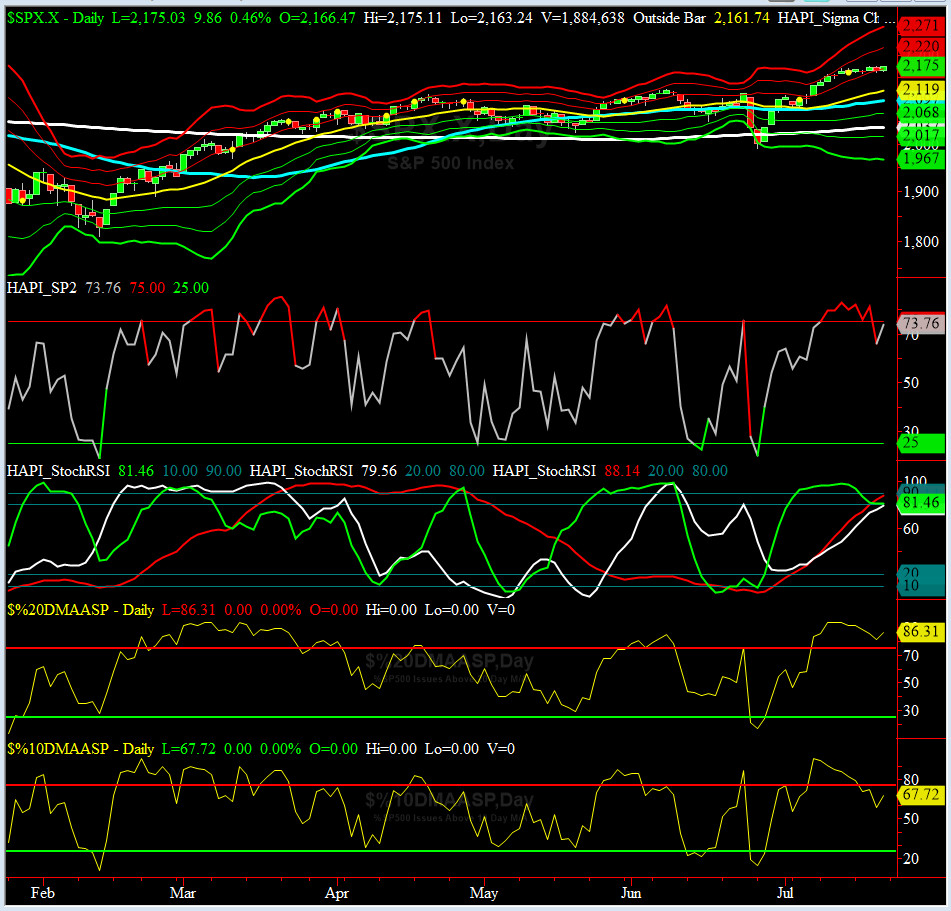
HA_SP2 Chart
HA_SP2 = 73.8 (Buy signal <= 25, Sell Signal >= 75)
This indicator also says we are near Overbought territory.
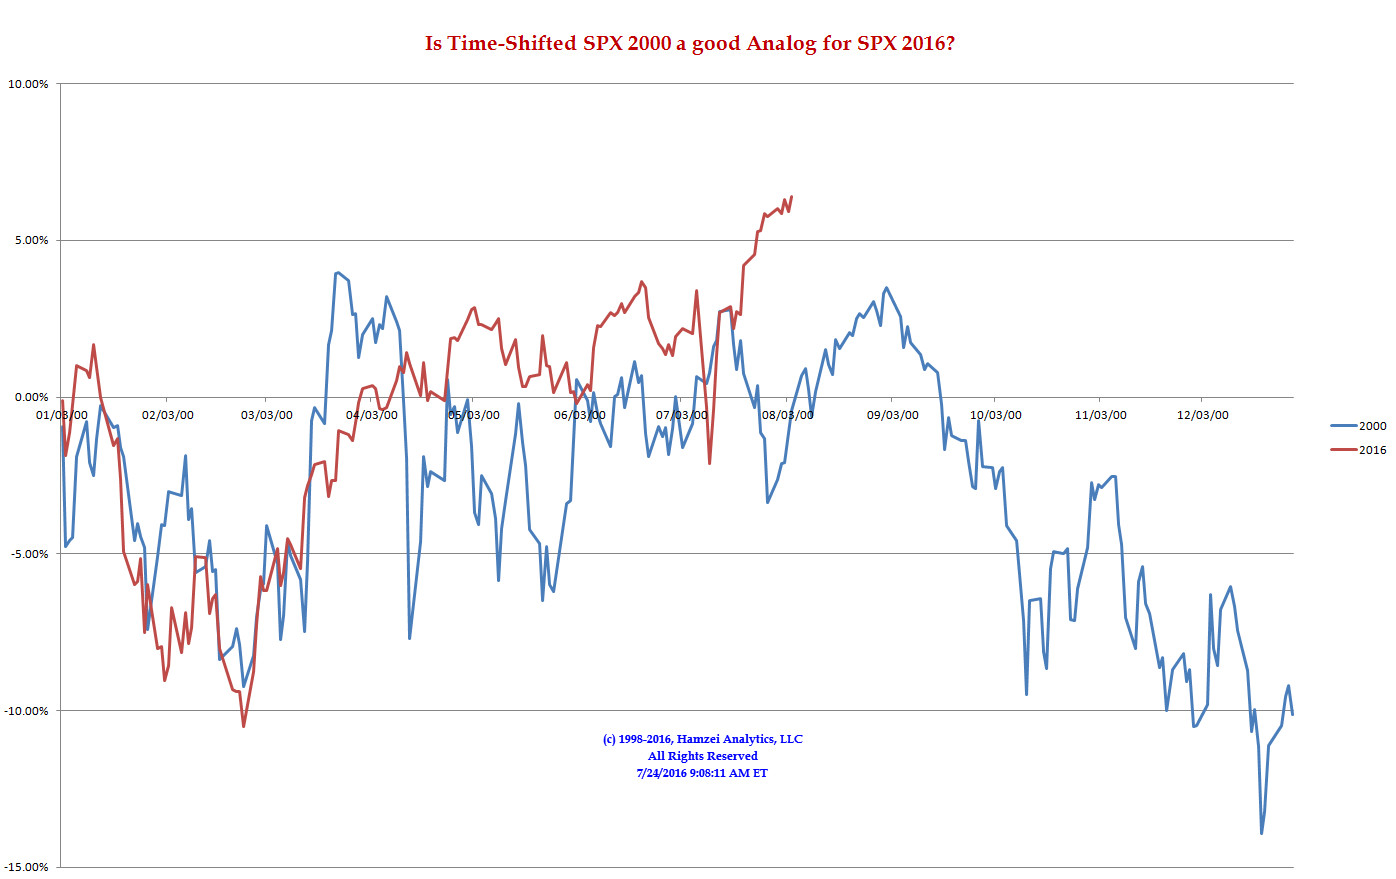
SPX 2000 Analog for SPX 2016
We could have easily posted a picture of Bibi here.....and you would observed the same reaction from us.....
but then agin, the cherished words of Gen. Colin Powell comes to us. More Tea?
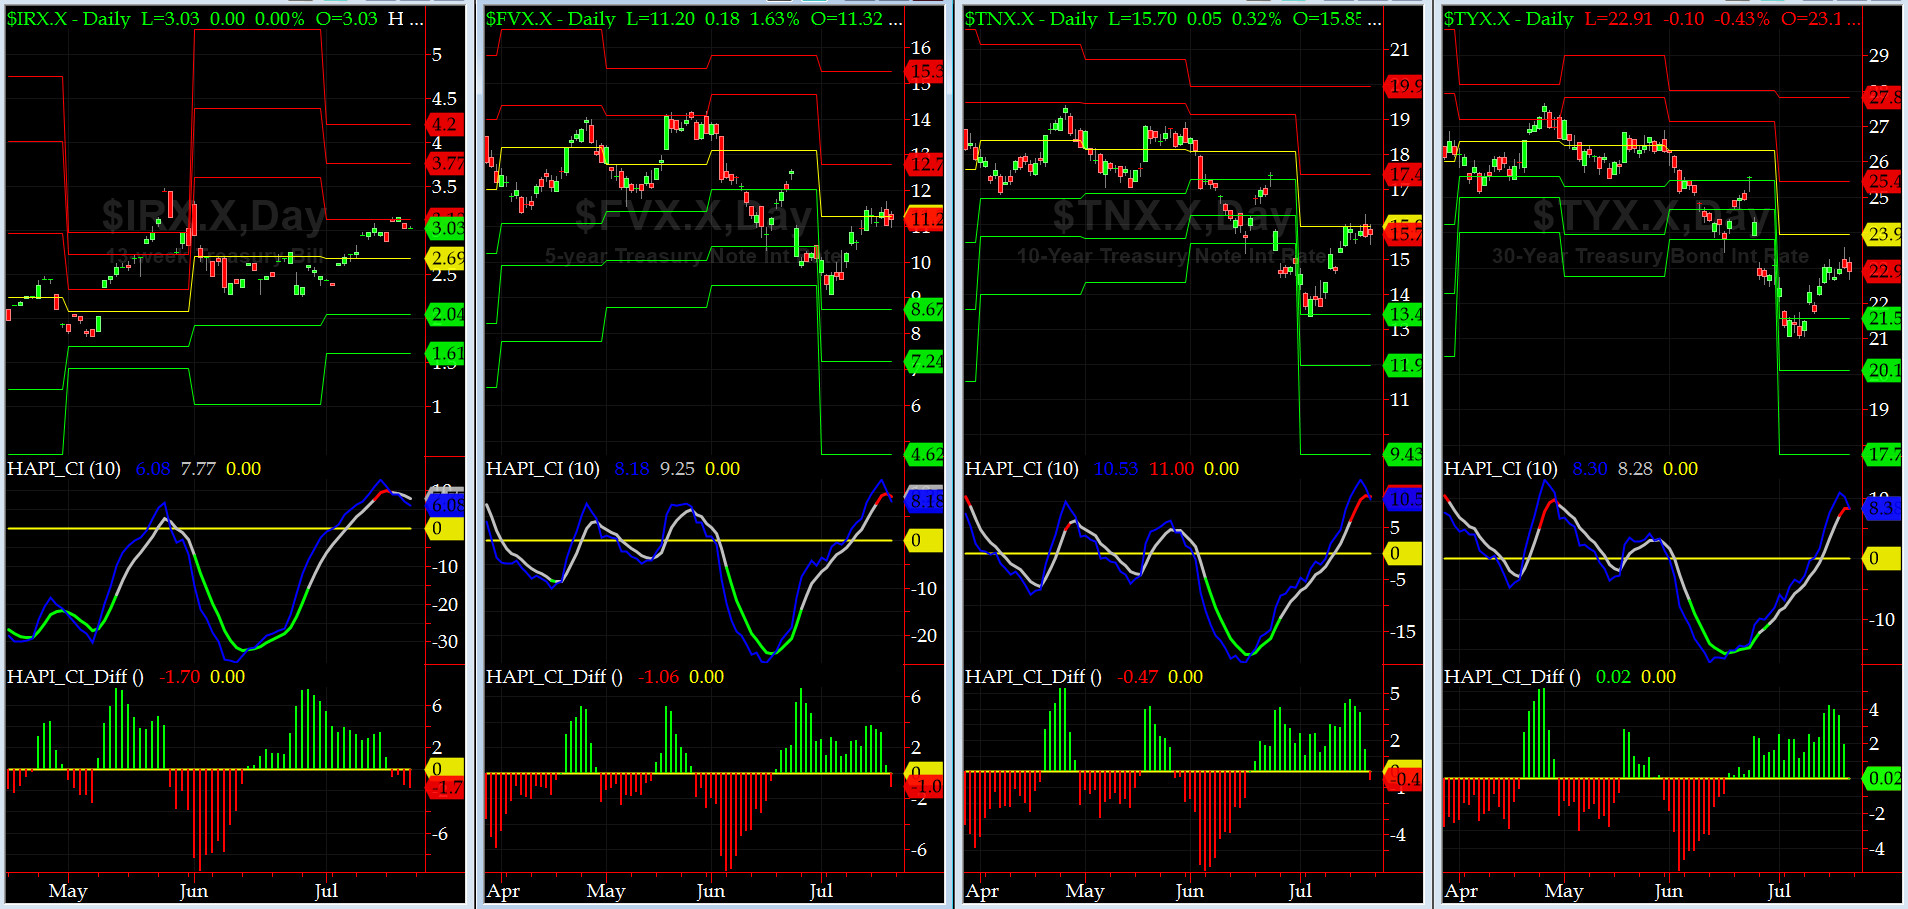
US Treasury T-Notes & T-Bonds Yields Chart
The past week, the US Treasury Complex went on a full fiesta (following our Roman Legion's daily ritual?).
Fari Hamzei
|


 Proactive Market Timing


