|
Sunday, August 14, 2016, 2330ET
Market Timing Charts, Analysis & Commentary for Issue #154
Timer Charts of S&P-500 Cash Index (SPX) + NASDAQ-100 Cash Index (NDX)
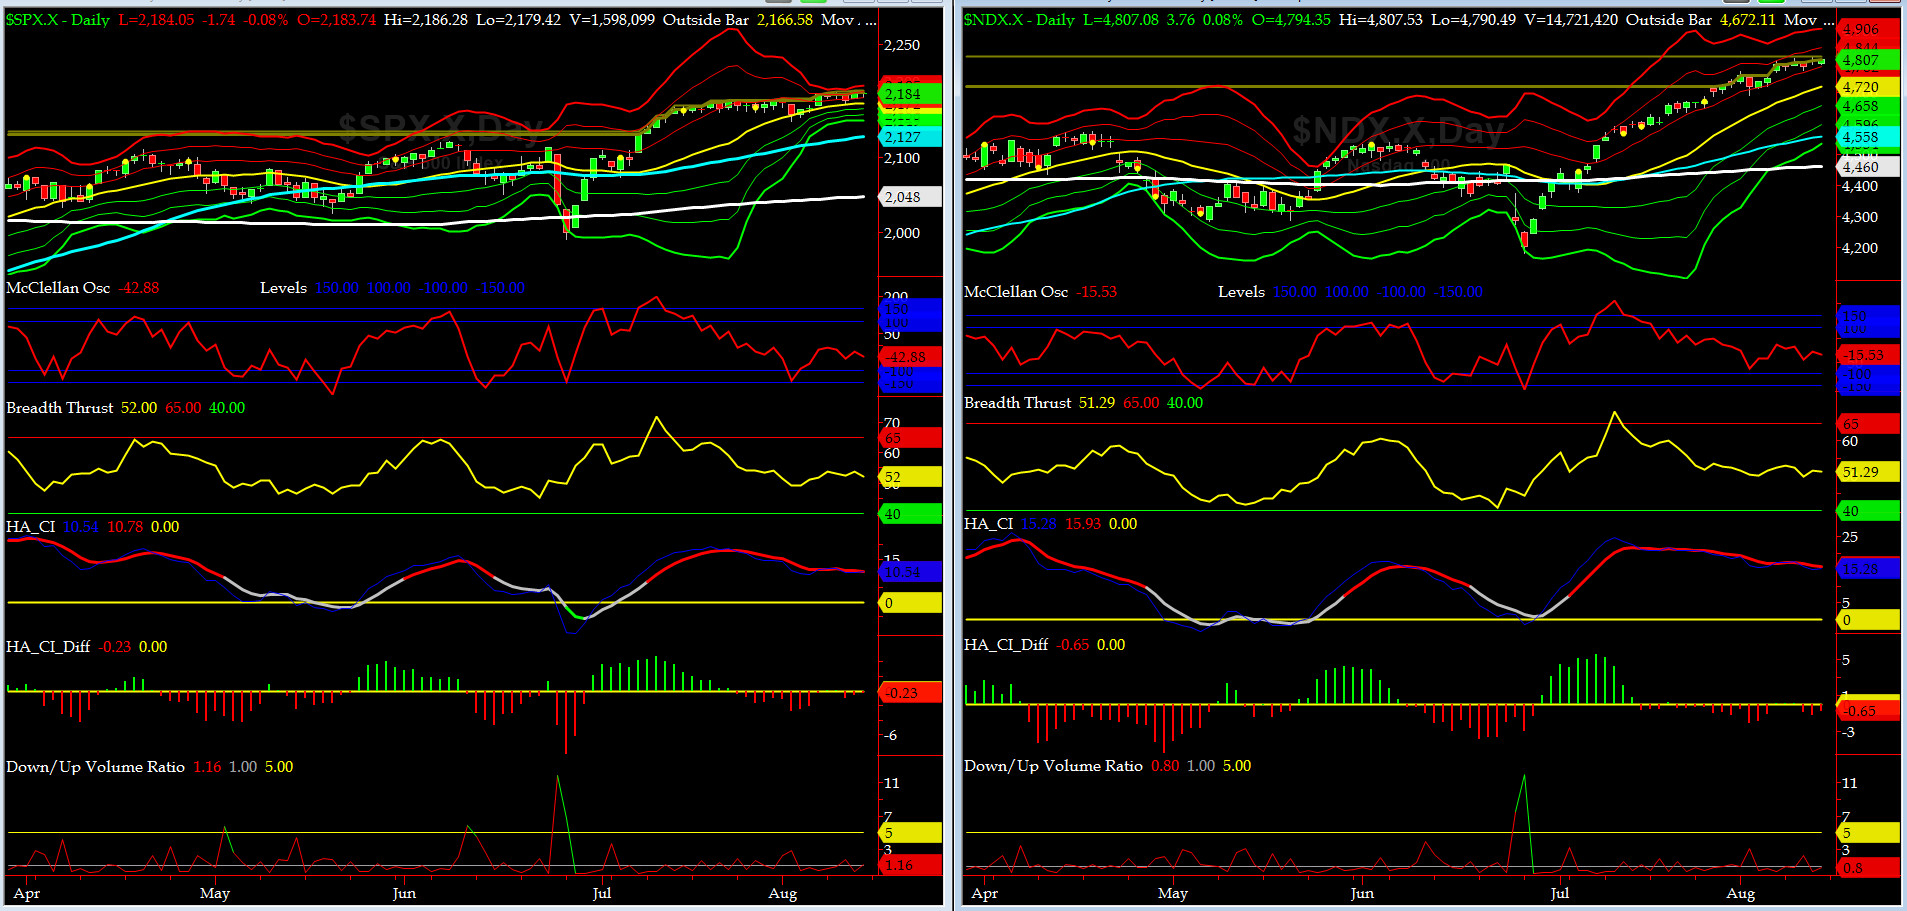
Most recent S&P-500 Cash Index (SPX): 2184.05 up +1.18 (up +0.05%) for the week ending on Friday, August 12th, 2016, which closed near its +1.5 sigma.
SPX ALL TIME INTRADAY HIGH = 2188.45 (reached on Thursday, August 11, 2016)
SPX ALL TIME CLOSING HIGH = 2185.75 (reached on Thursday, August 11, 2016)
Current DAILY +2 Sigma SPX = 2187 with WEEKLY +2 Sigma = 2198
Current DAILY 0 Sigma (20 day MA) SPX = 2172 with WEEKLY 0 Sigma = 2101
Current DAILY -2 Sigma SPX = 2156 with WEEKLY -2 Sigma = 2005
NYSE McClellan Oscillator = -43 (-150 is start of the O/S area; around -275 to -300 area or lower, we go into the �launch-pad� mode, over +150, we are in O/B area)
NYSE Breadth Thrust = 52 (40 is considered as oversold and 65 as overbought)
SPX printed more All-Time-Highs.... so all is well in the Mid-Western Front? Reminds us of Pink Floyd's song: [We're all] Comfortably Numb, from their "The Wall" album, published in 1979.
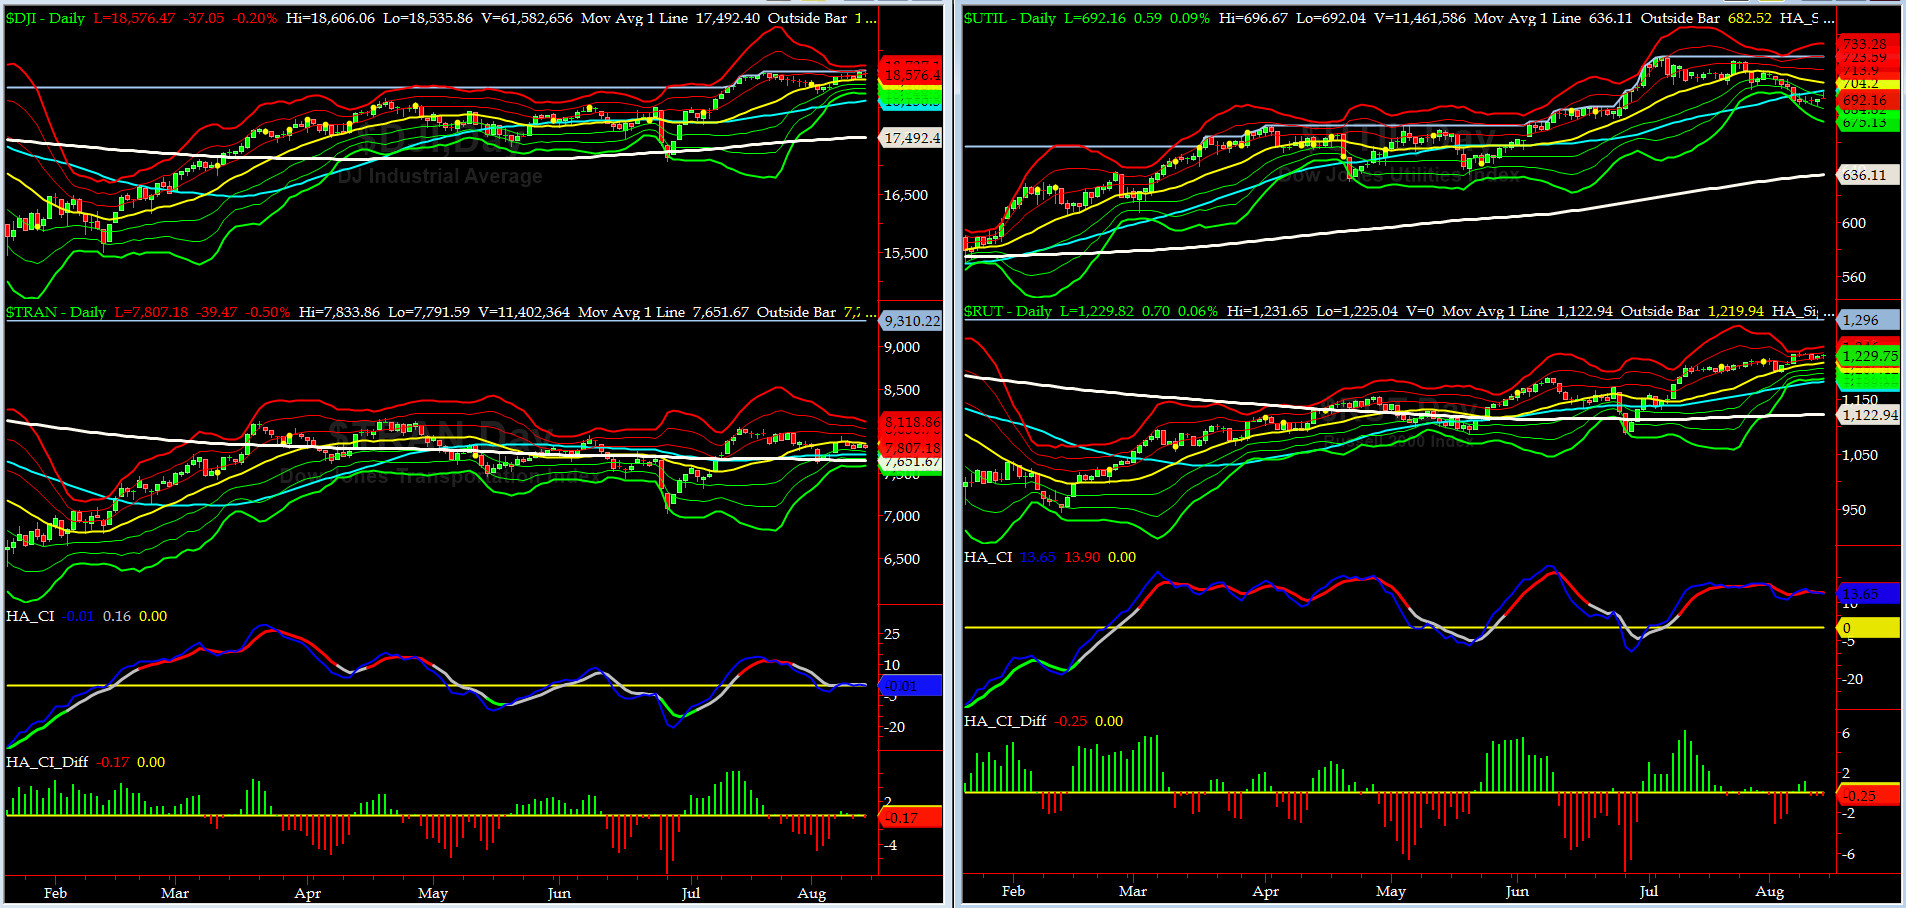
Canaries [in the Coal Mine] Chart for DJ TRAN & RUT Indices
200-Day MA DJ TRAN = 7651 or 2% below DJ TRAN (max observed in last 5 yrs = 20.2%, min = -20.3%)
200-Day MA RUT = 1122 or 9.5% below RUT (max observed in last 5 yrs = 21.3%, min = -22.6%)
DJ Transports (proxy for economic conditions 6 to 9 months hence) chart pattern is in a divergence with SPX, acting as a warning, at least for now.
Russell 2000 Small Caps (proxy for RISK ON/OFF) has been pretty much flat, much like SPX. RISK-ON is back but it's very mild right now.
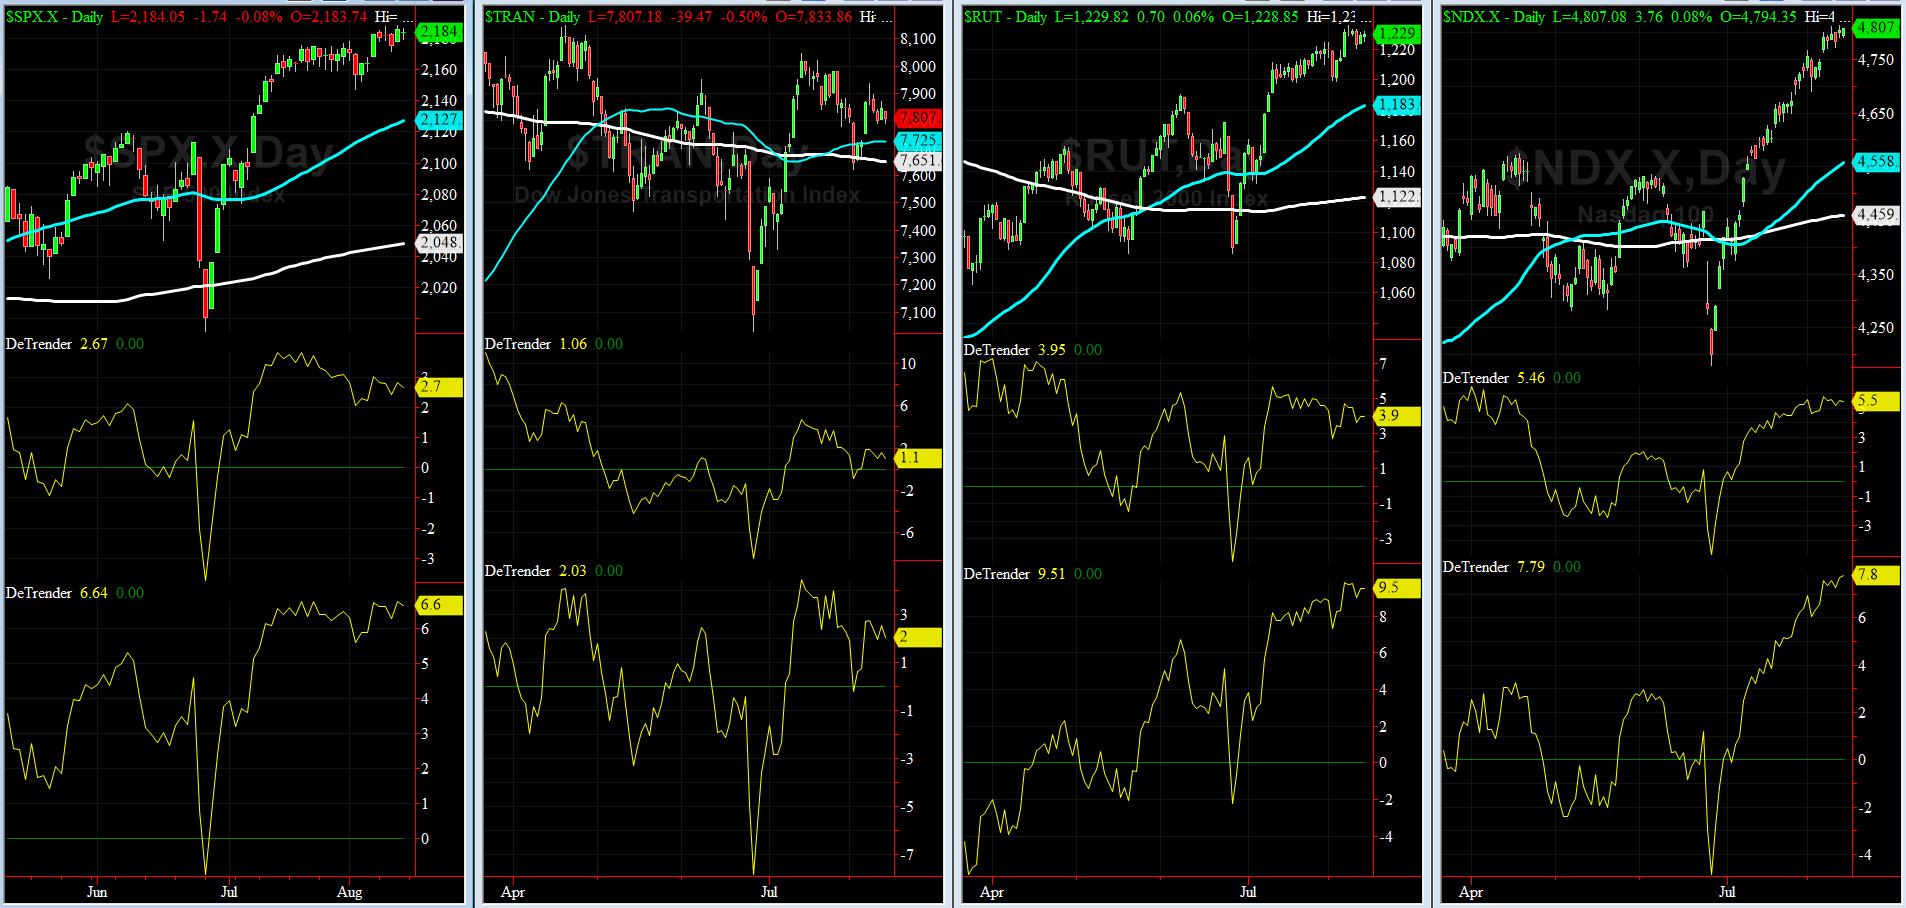
DeTrenders Charts for SPX, NDX, TRAN & RUT Indices
50-Day MA SPX = 2127 or 2.7% below SPX (max observed in last 5 yrs = +8.6%, min = -9.3%)
200-Day MA SPX = 2048 or 6.6% below SPX (max observed in last 5 yrs = 15.2%, min = -14%)
This week ALL of our Eight DeTrenders continue to stay POSITIVE. DeTrenders for TRAN & RUT continue to get our constant attention.
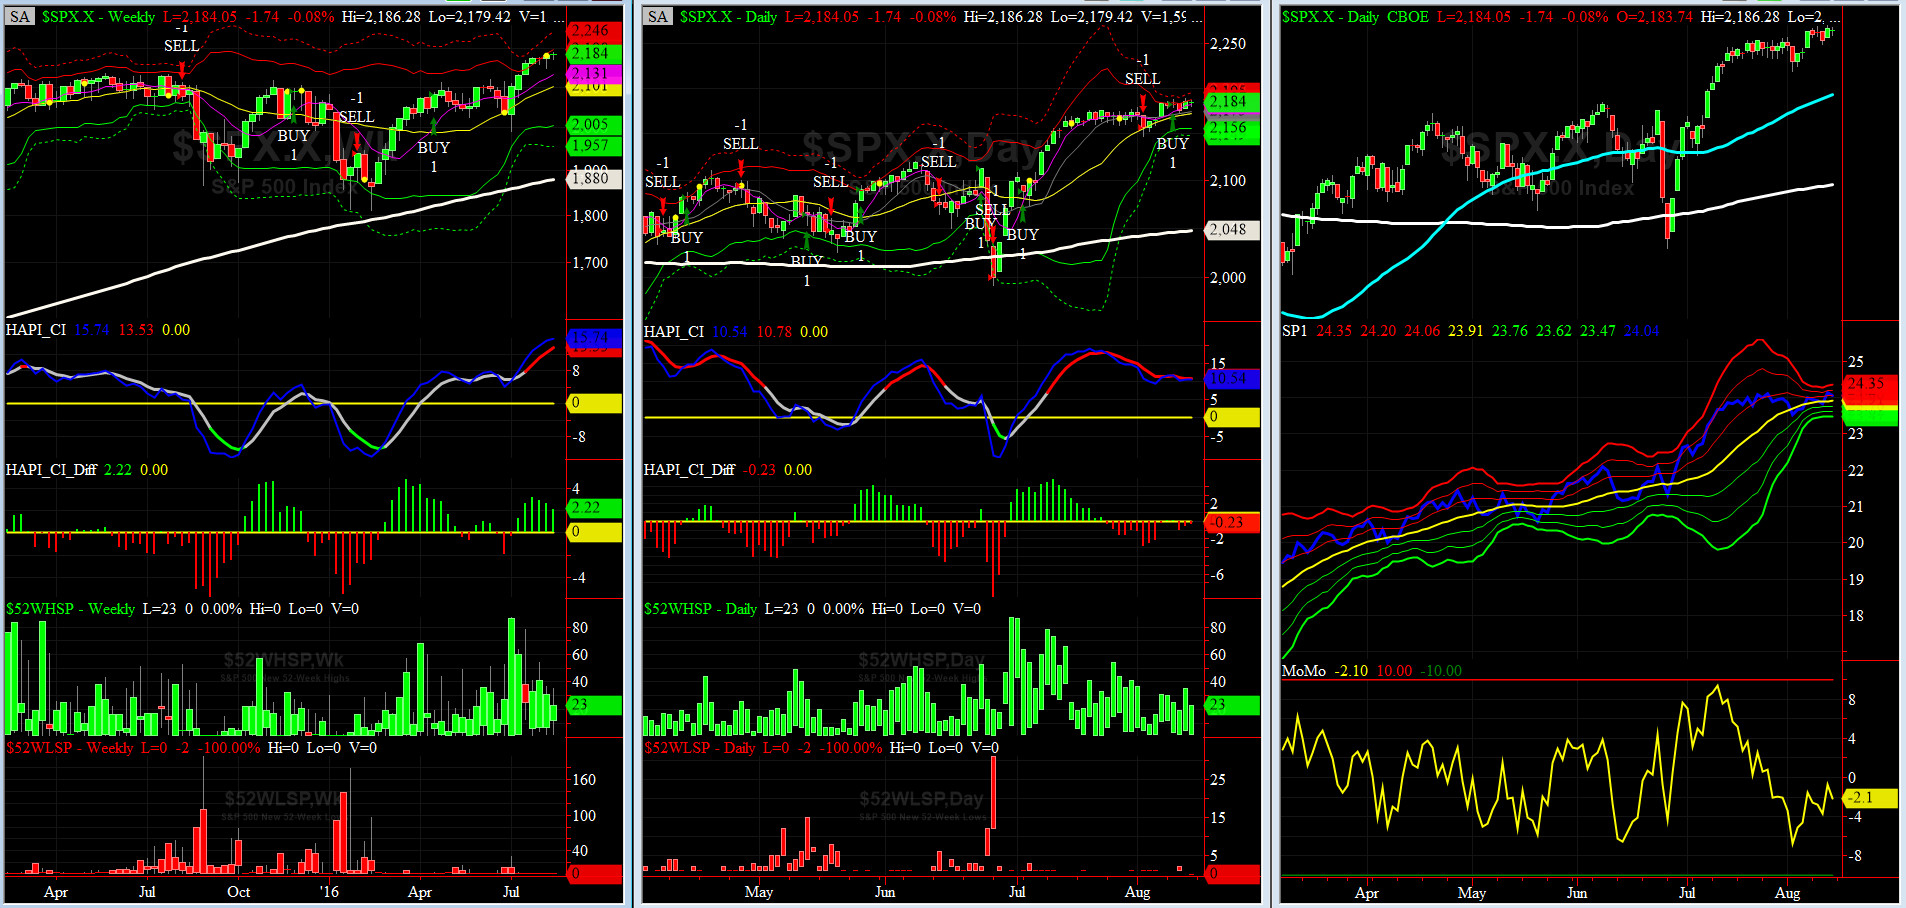
HA_SP1_Momo Chart
WEEKLY Timing Model = on a BUY Signal since Friday 4/15/16 CLOSE at 2081
DAILY Timing Model = on a BUY Signal since Tuesday 8/9/16 CLOSE at 2181
Max SPX 52wk-highs reading last week = 35 (over 120-140, the local maxima is in)
Max SPX 52wk-Lows reading last week = 2 (over 40-60, the local minima is in)
HA_SP1 = below its +1 sigma channels
HA_Momo = -2.1 (reversals most likely occur above +10 or below -10)
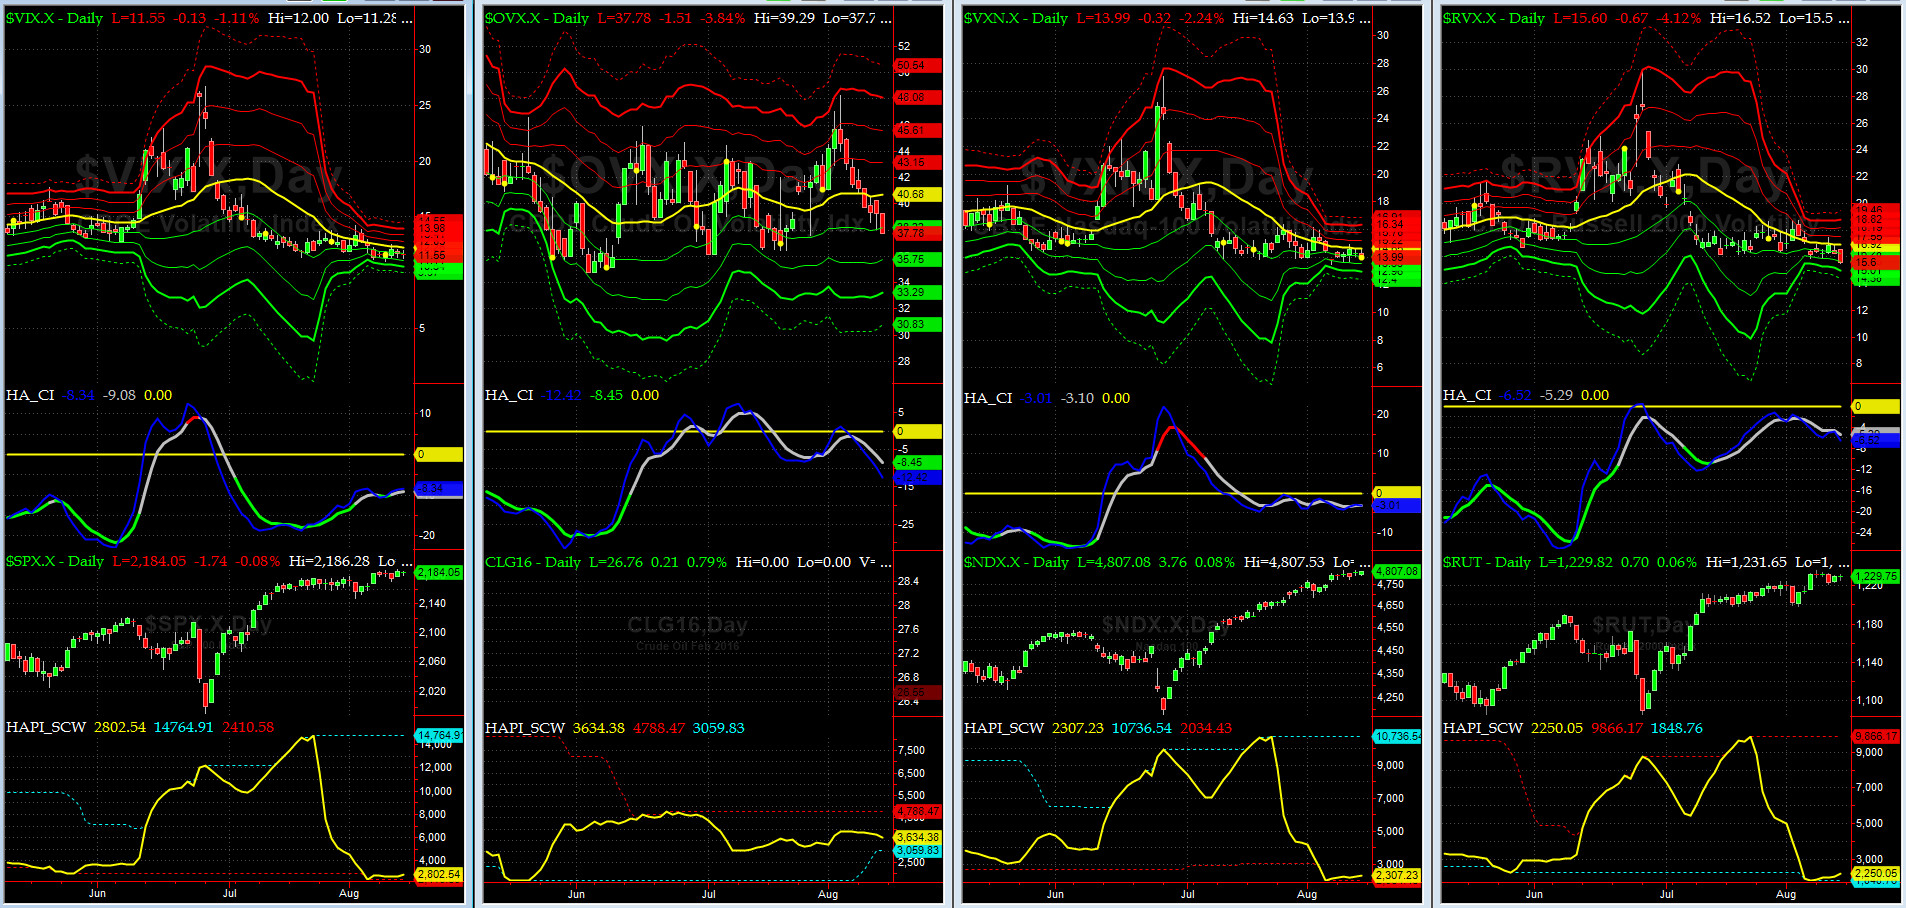
Vol of the Vols Chart
VIX = 11.55 is above its -1 sigma (remember it�s the VIX�s vol pattern (its sigma channels) that matters, and not the level of VIX itself (this is per Dr. Robert Whaley, a great mentor and the inventor of original VIX, now called VXO). VIX usually peaks around a test of its +4 sigma).
VIX had another quiet week. OVX (vol index for crude) got crushed.
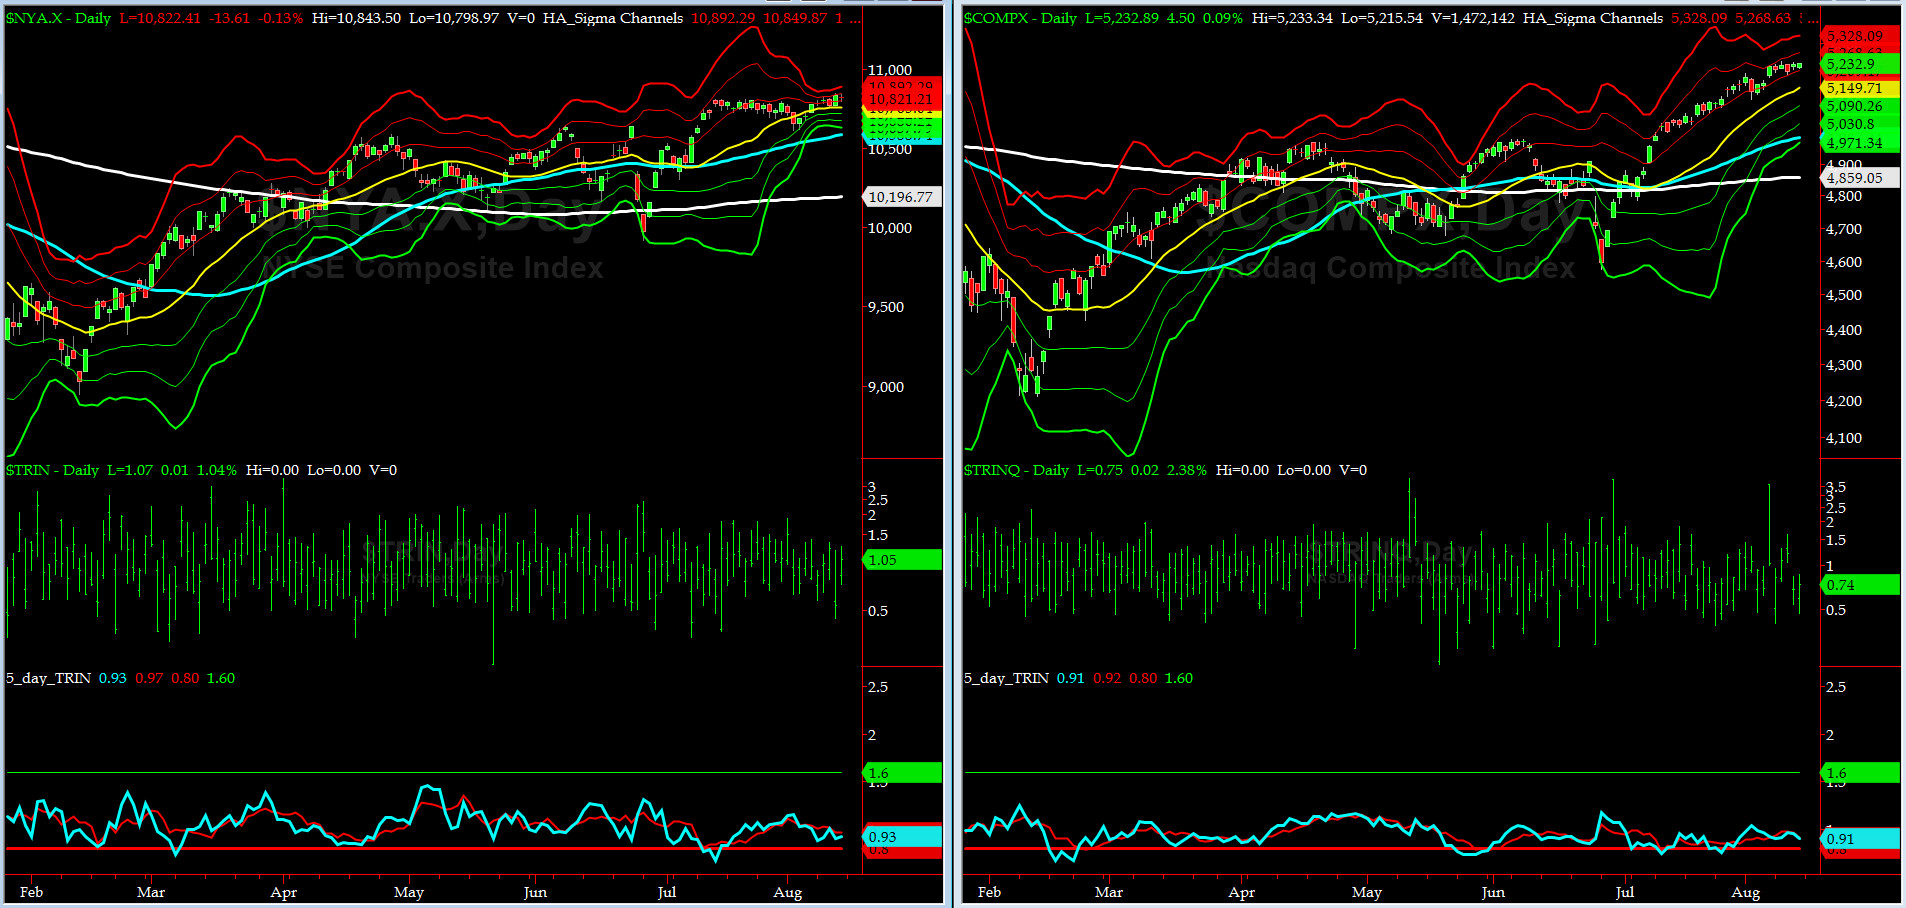
5-day TRIN & TRINQ Charts
Both charts are now near NEUTRAL here........
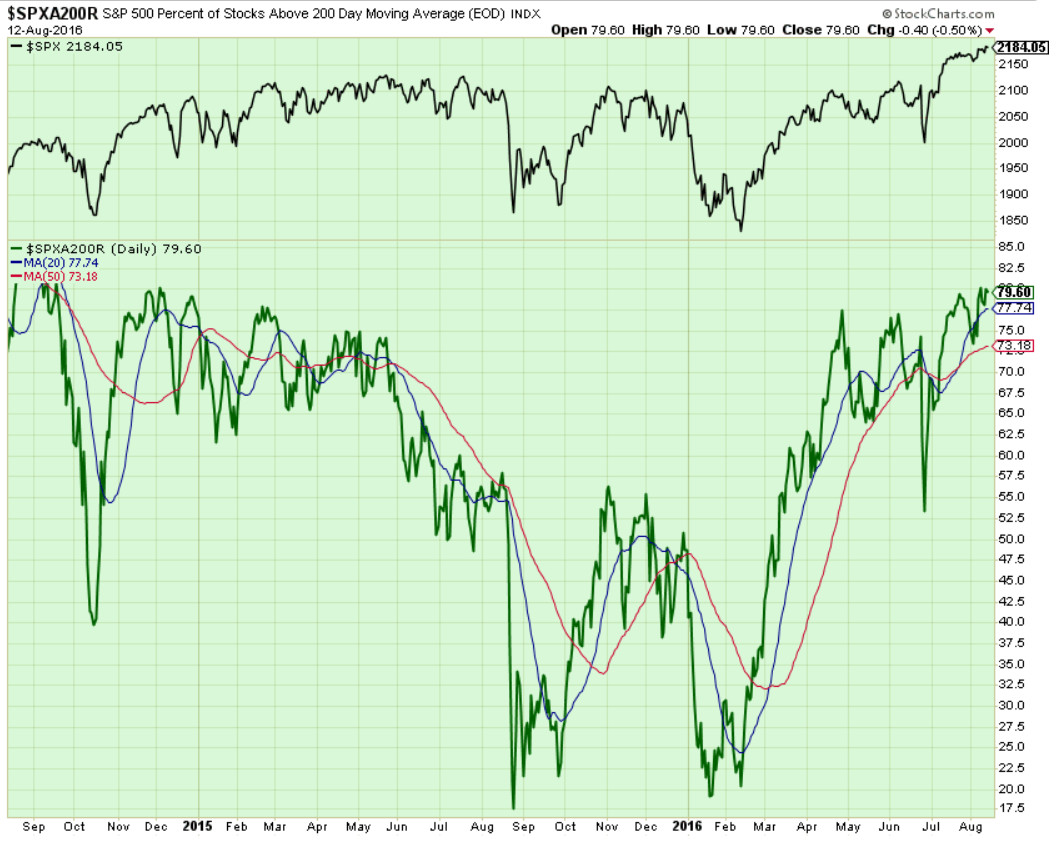
Components of SPX above their respective 200day MA Chart
This scoring indicator is almost 80% now. All of its previous bearish divergences are history now.
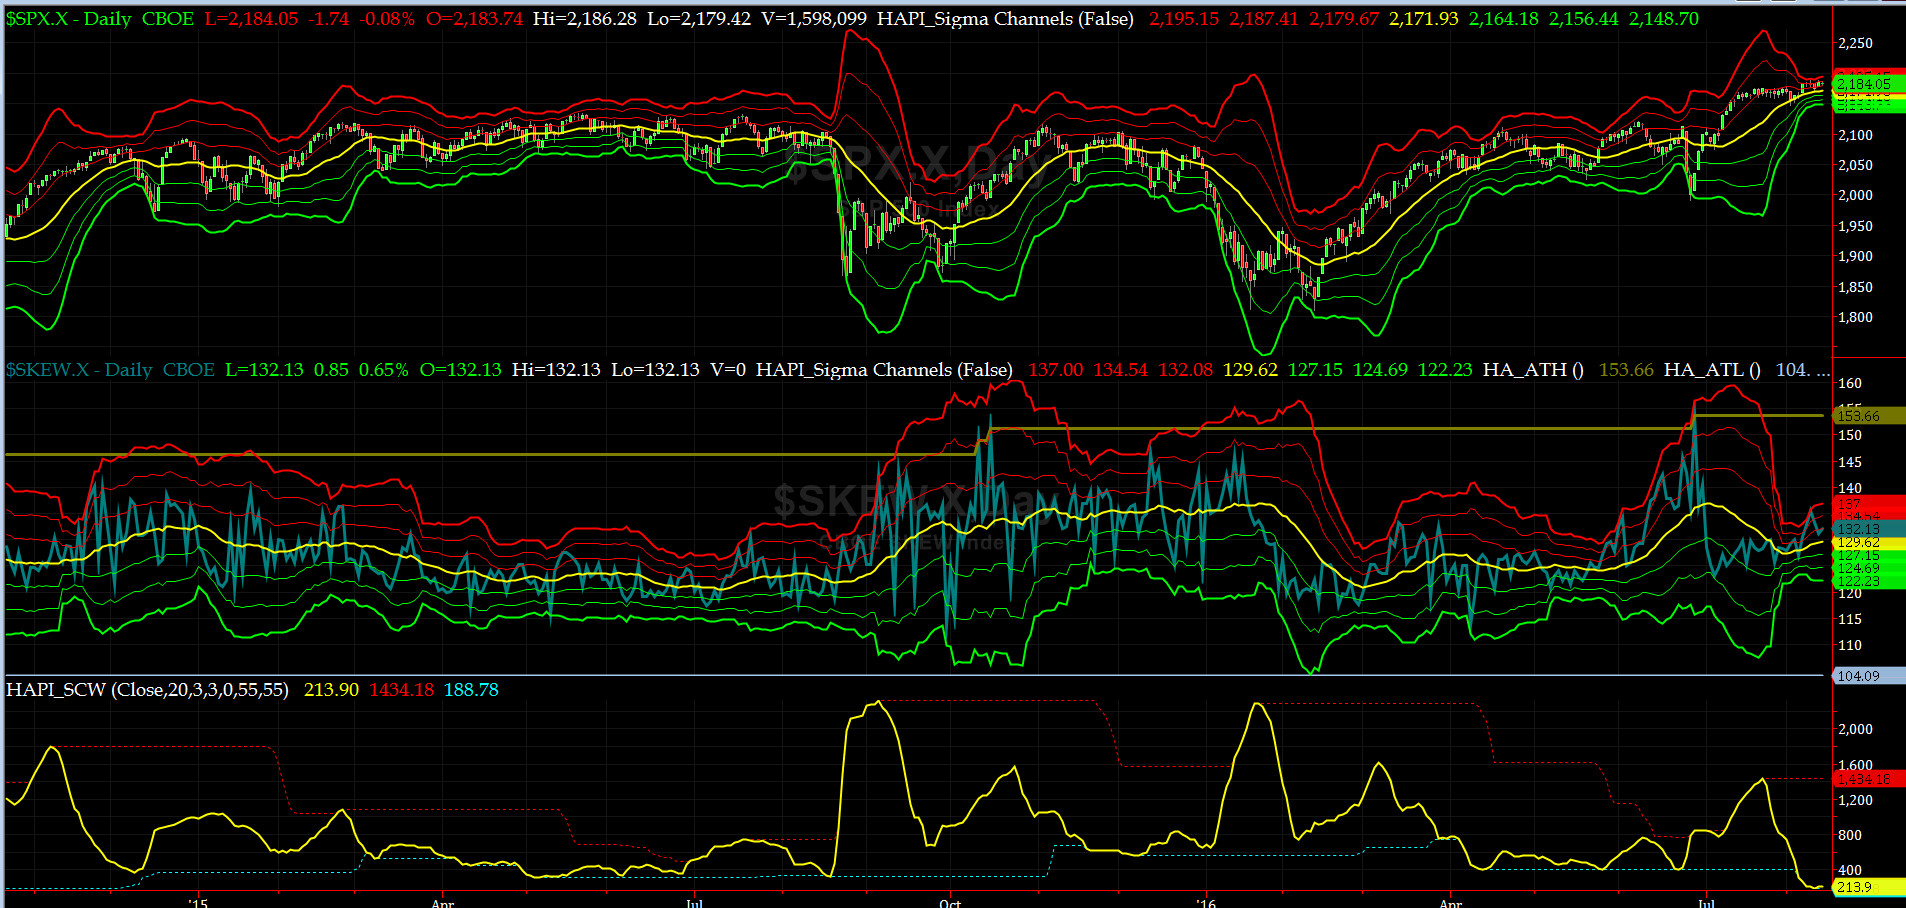
SPX SKEW (Tail Risk) Chart
SPX SKEW (Tail Risk) rose to 132 near its +1 sigma (normal = 120-125, range 100-150)
All Quiet on the Mid-Western Front? Smart Money still thinks so.
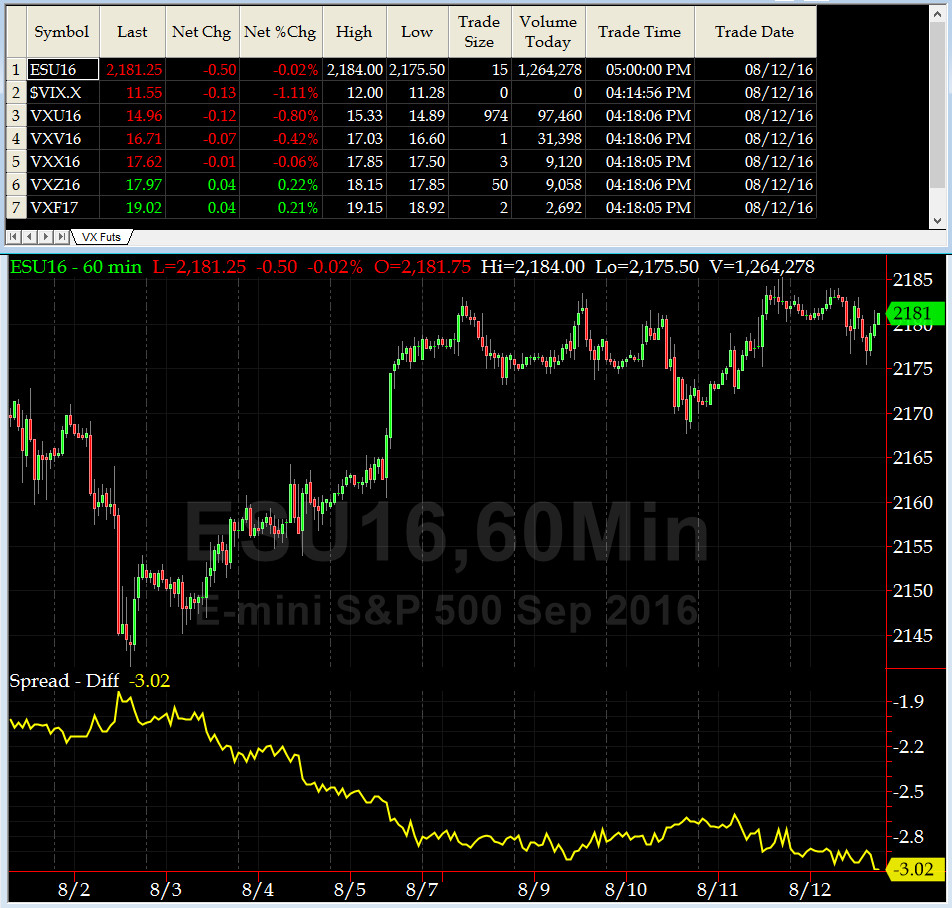
3-month VIX Futures Spread(VX) Chart
Our 3-month VIX Futures Spread (LONG SEPT16 & SHORT DEC16) closed at -3.02 on Friday. As you can tell, this indicator says continues to signal that we are extremely overbought.
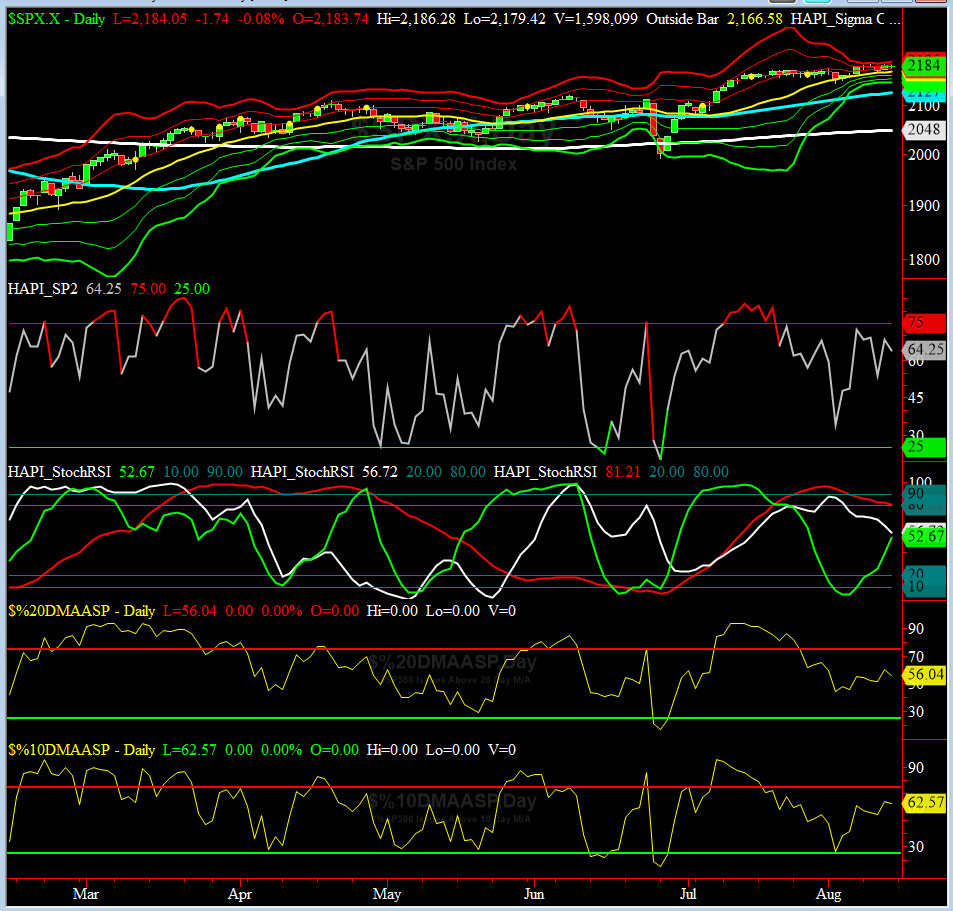
HA_SP2 Chart
HA_SP2 = 64 (Buy signal <= 25, Sell Signal >= 75)
This indicator is in a big divergence with SPX closing a point below its all time high.
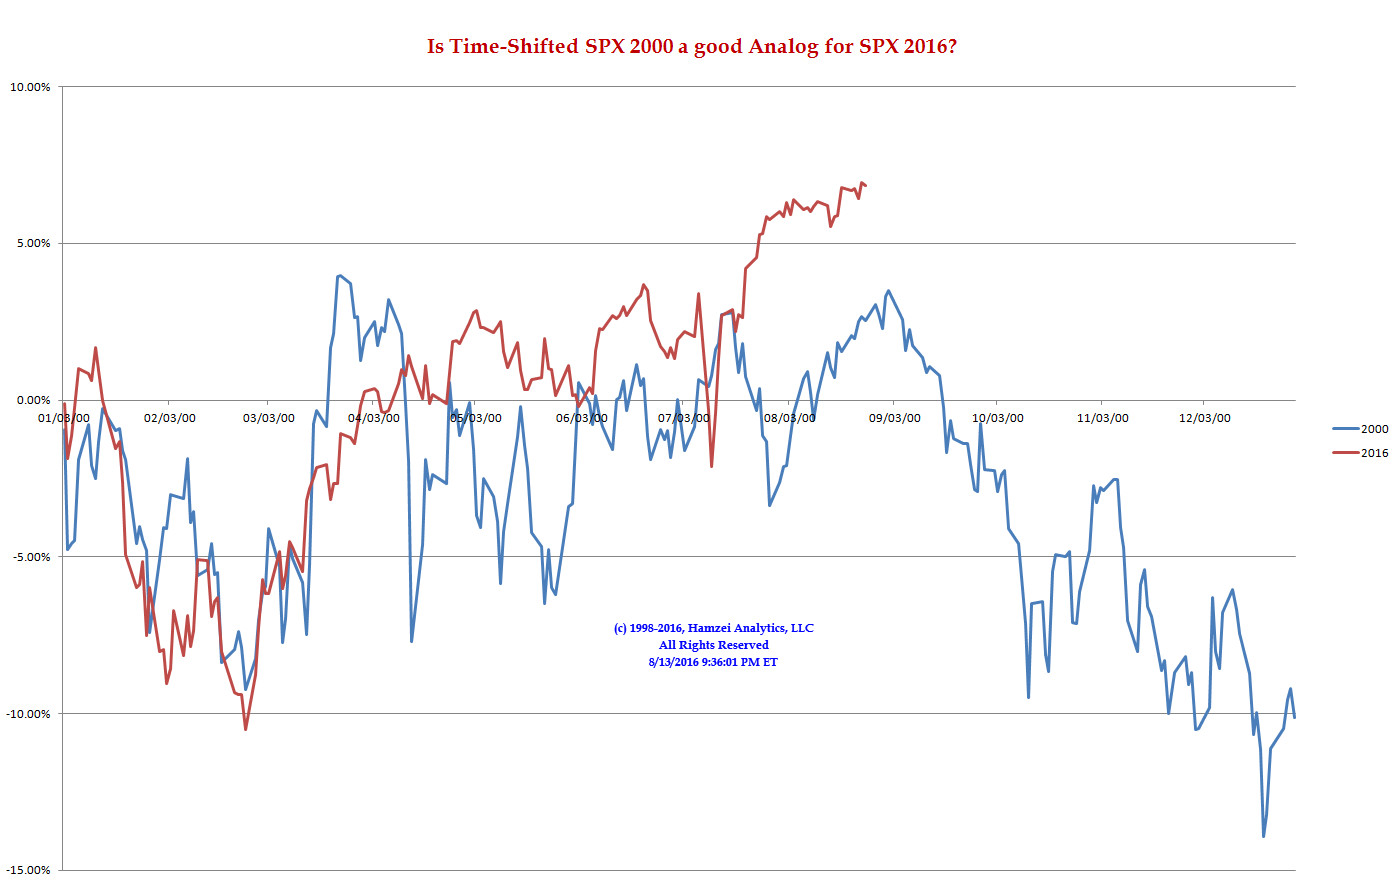
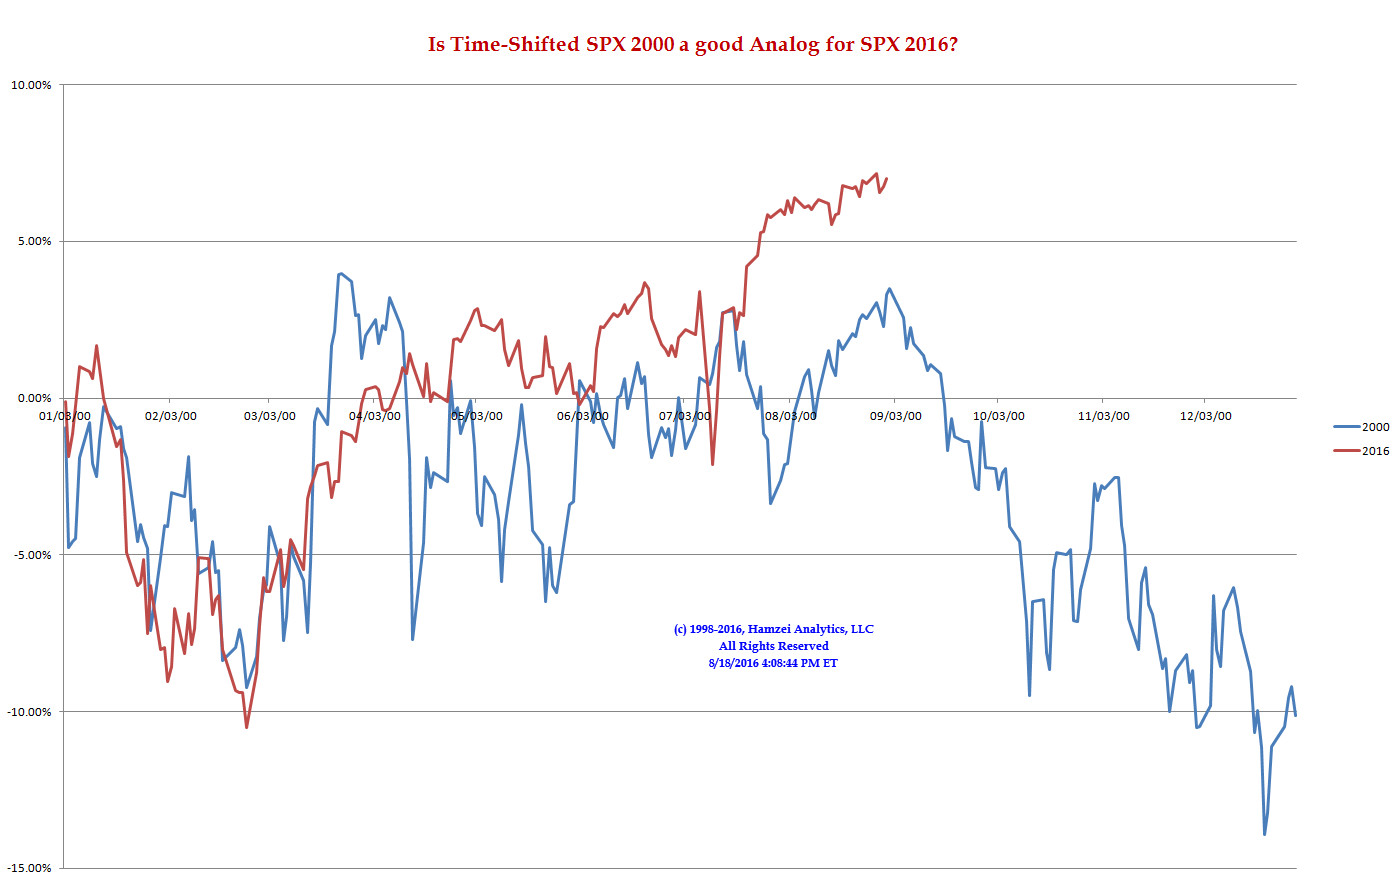
SPX 2000 Analog for SPX 2016
[If this chart is a good analog] then let's see if a week from now, it will get exciting to trade SPX.
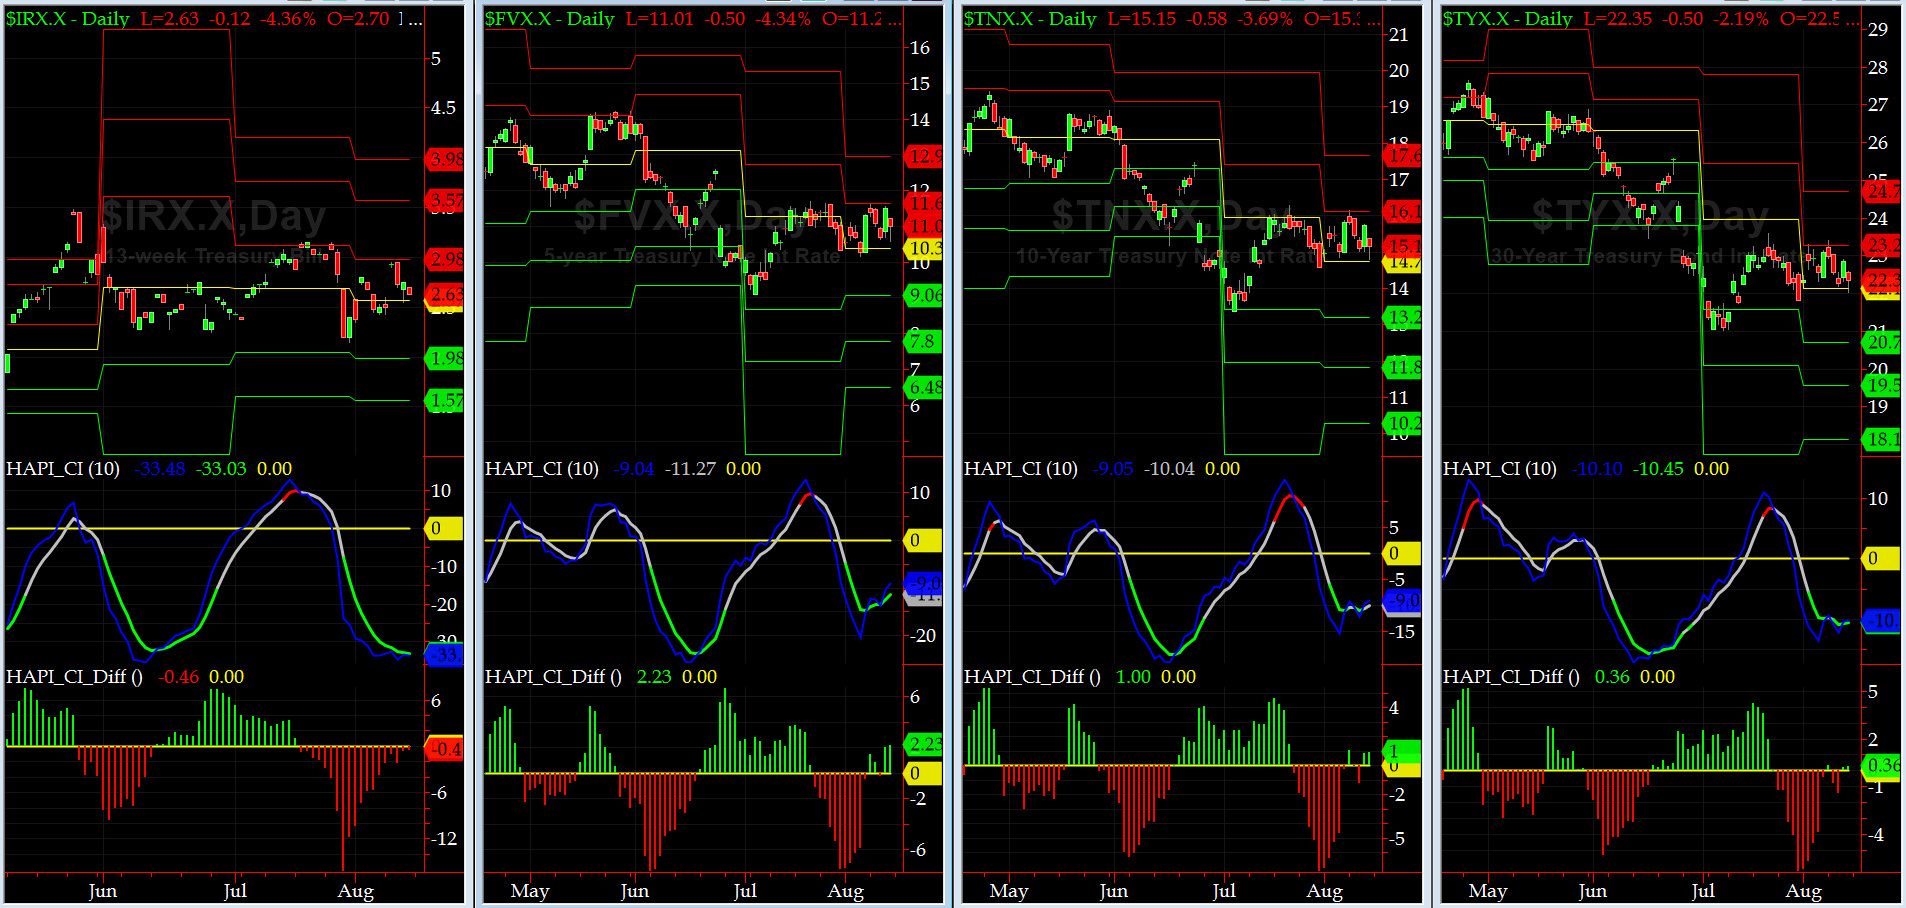
US Treasury T-Notes & T-Bonds Yields Chart
US Treasury Complex is very quiet, trading near its monthly pivots.
Fari Hamzei
|


 Proactive Market Timing