|
Monday, August 29, 2016, 0800ET
Market Timing Charts, Analysis & Commentary for Issue #156
Timer Charts of S&P-500 Cash Index (SPX) + NASDAQ-100 Cash Index (NDX)
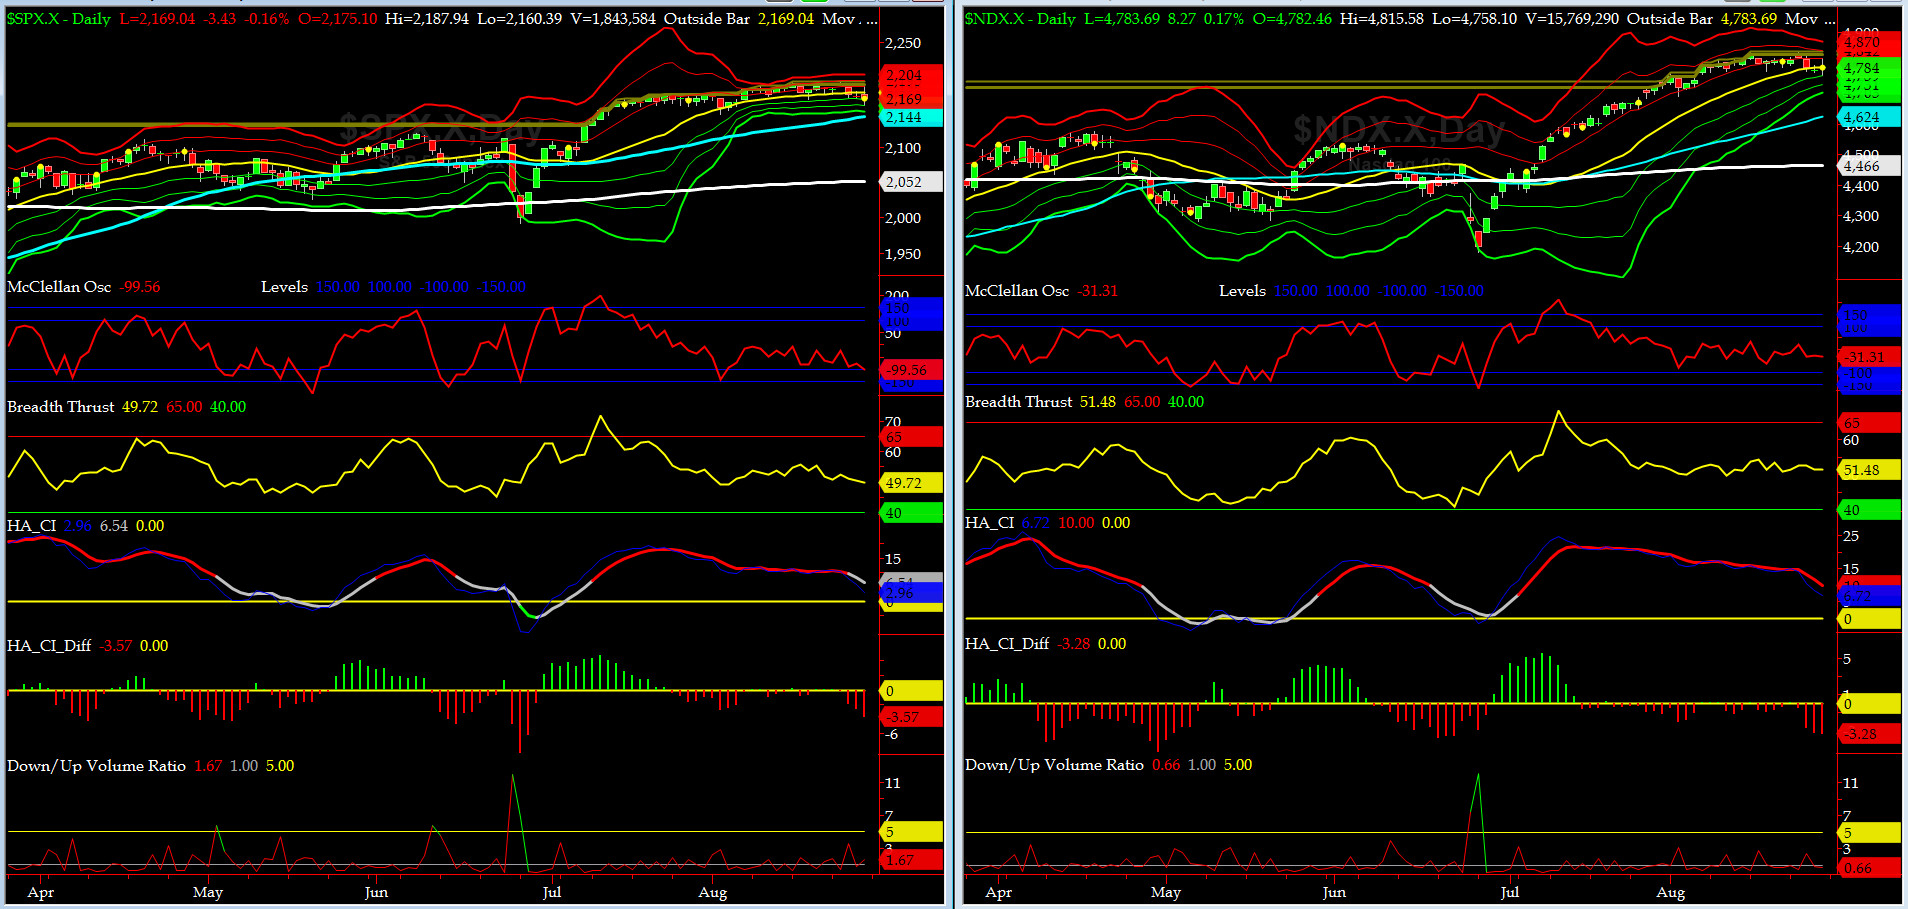
Most recent S&P-500 Cash Index (SPX): 2169.04 down -14.83 (down -0.68%) for the week ending on Friday, August 26th, 2016, which closed near its -1 sigma.
SPX ALL TIME INTRADAY HIGH = 2193.81 (reached on Monday, August 15, 2016)
SPX ALL TIME CLOSING HIGH = 2190.15 (reached on Monday, August 15, 2016)
Current DAILY +2 Sigma SPX = 2195 with WEEKLY +2 Sigma = 2214
Current DAILY 0 Sigma (20 day MA) SPX = 2178 with WEEKLY 0 Sigma = 2113
Current DAILY -2 Sigma SPX = 2160 with WEEKLY -2 Sigma = 2011
NYSE McClellan Oscillator = -99 (-150 is start of the O/S area; around -275 to -300 area or lower, we go into the �launch-pad� mode, over +150, we are in O/B area)
NYSE Breadth Thrust = 49.7 (40 is considered as oversold and 65 as overbought)
Very dull week with exception of Wednesday and Friday (courtesy of Auntie Janet at Jackson Hole)
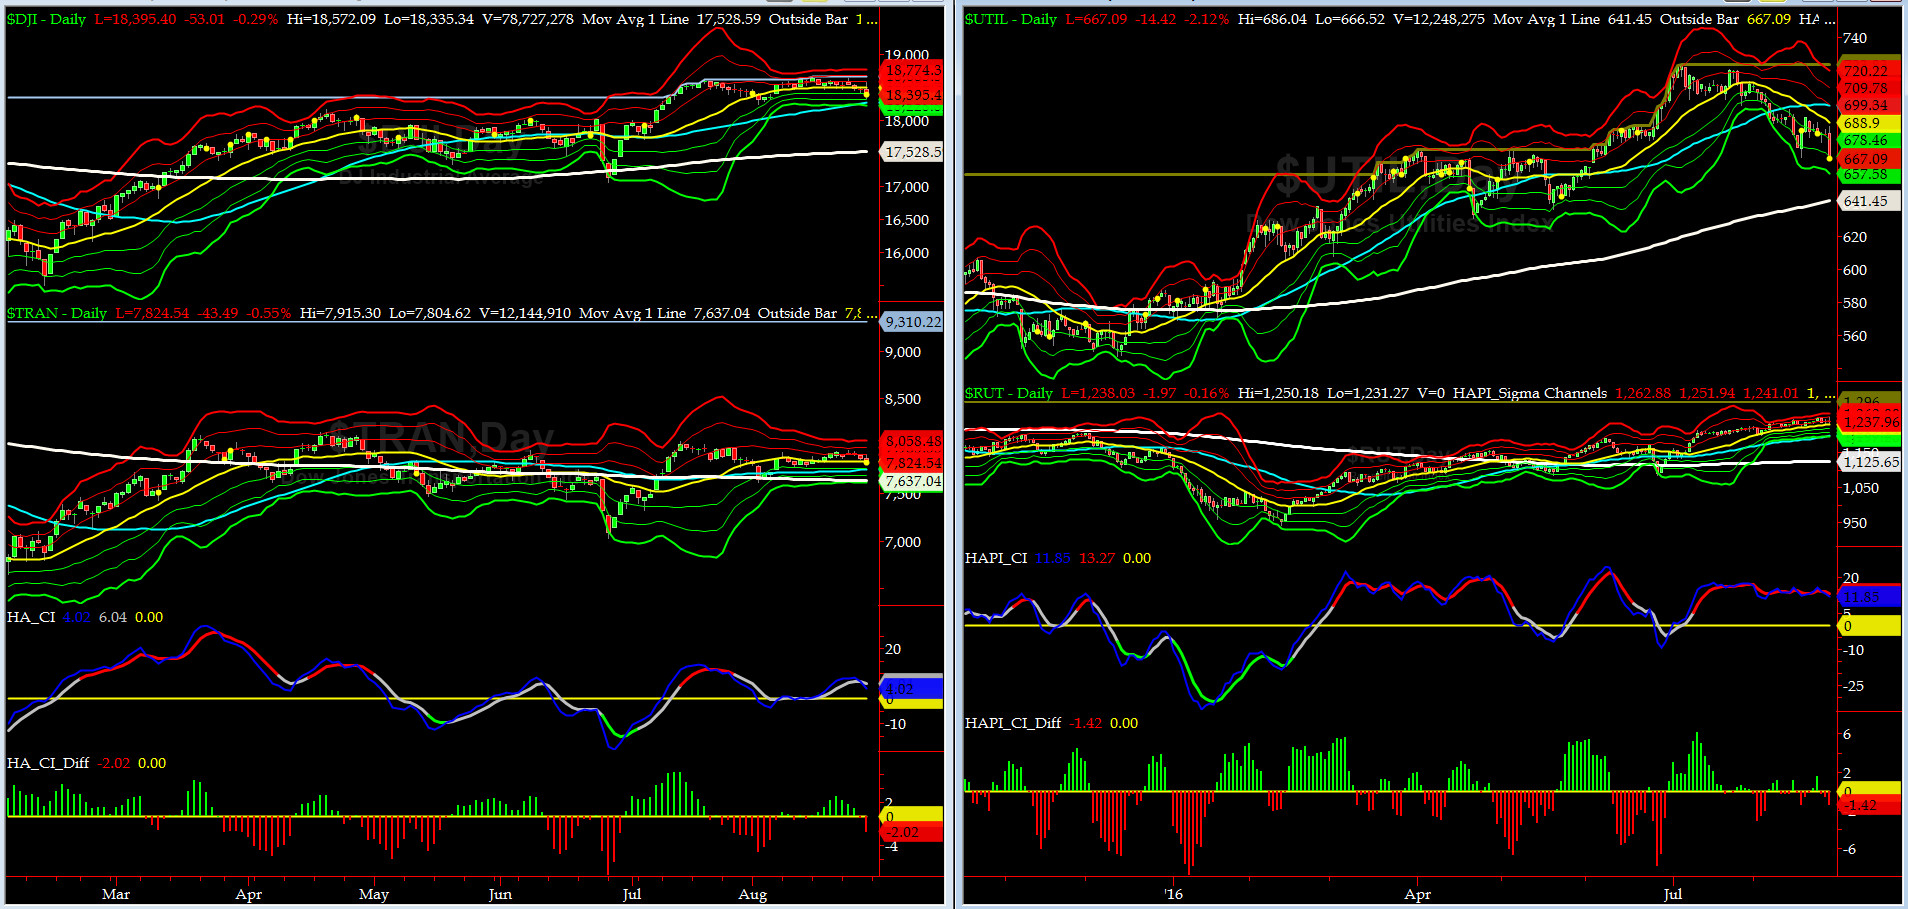
Canaries [in the Coal Mine] Chart for DJ TRAN & RUT Indices
200-Day MA DJ TRAN = 7637 or 2.5% below DJ TRAN (max observed in last 5 yrs = 20.2%, min = -20.3%)
200-Day MA RUT = 1125 or 10% below RUT (max observed in last 5 yrs = 21.3%, min = -22.6%)
DJ Transports (proxy for economic conditions 6 to 9 months hence) spent the whole week in a very gradual retreat.
Russell 2000 Small Caps (proxy for RISK ON/OFF) had a mixed week and went nowhere fast.
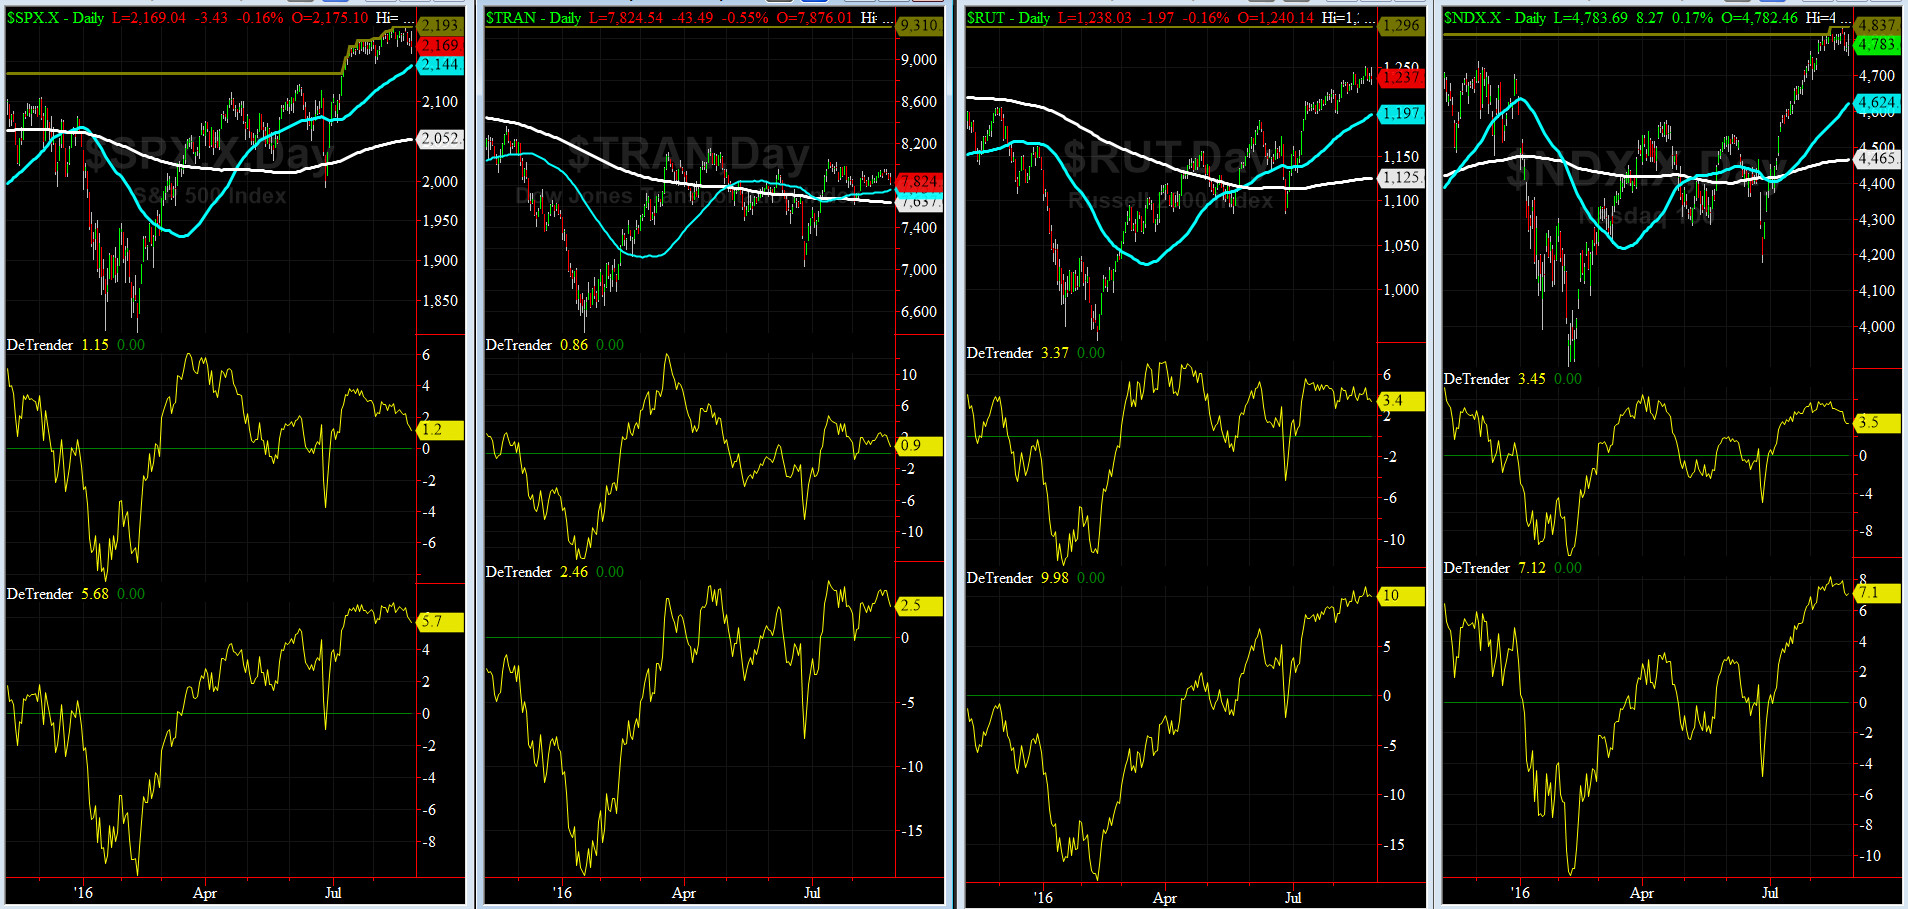
DeTrenders Charts for SPX, NDX, TRAN & RUT Indices
50-Day MA SPX = 2144 or 1.2% below SPX (max observed in last 5 yrs = +8.6%, min = -9.3%)
200-Day MA SPX = 2052 or 5.7% below SPX (max observed in last 5 yrs = 15.2%, min = -14%)
This week ALL of our Eight DeTrenders continue to stay POSITIVE. DeTrenders for TRAN & RUT continue to get our constant attention.
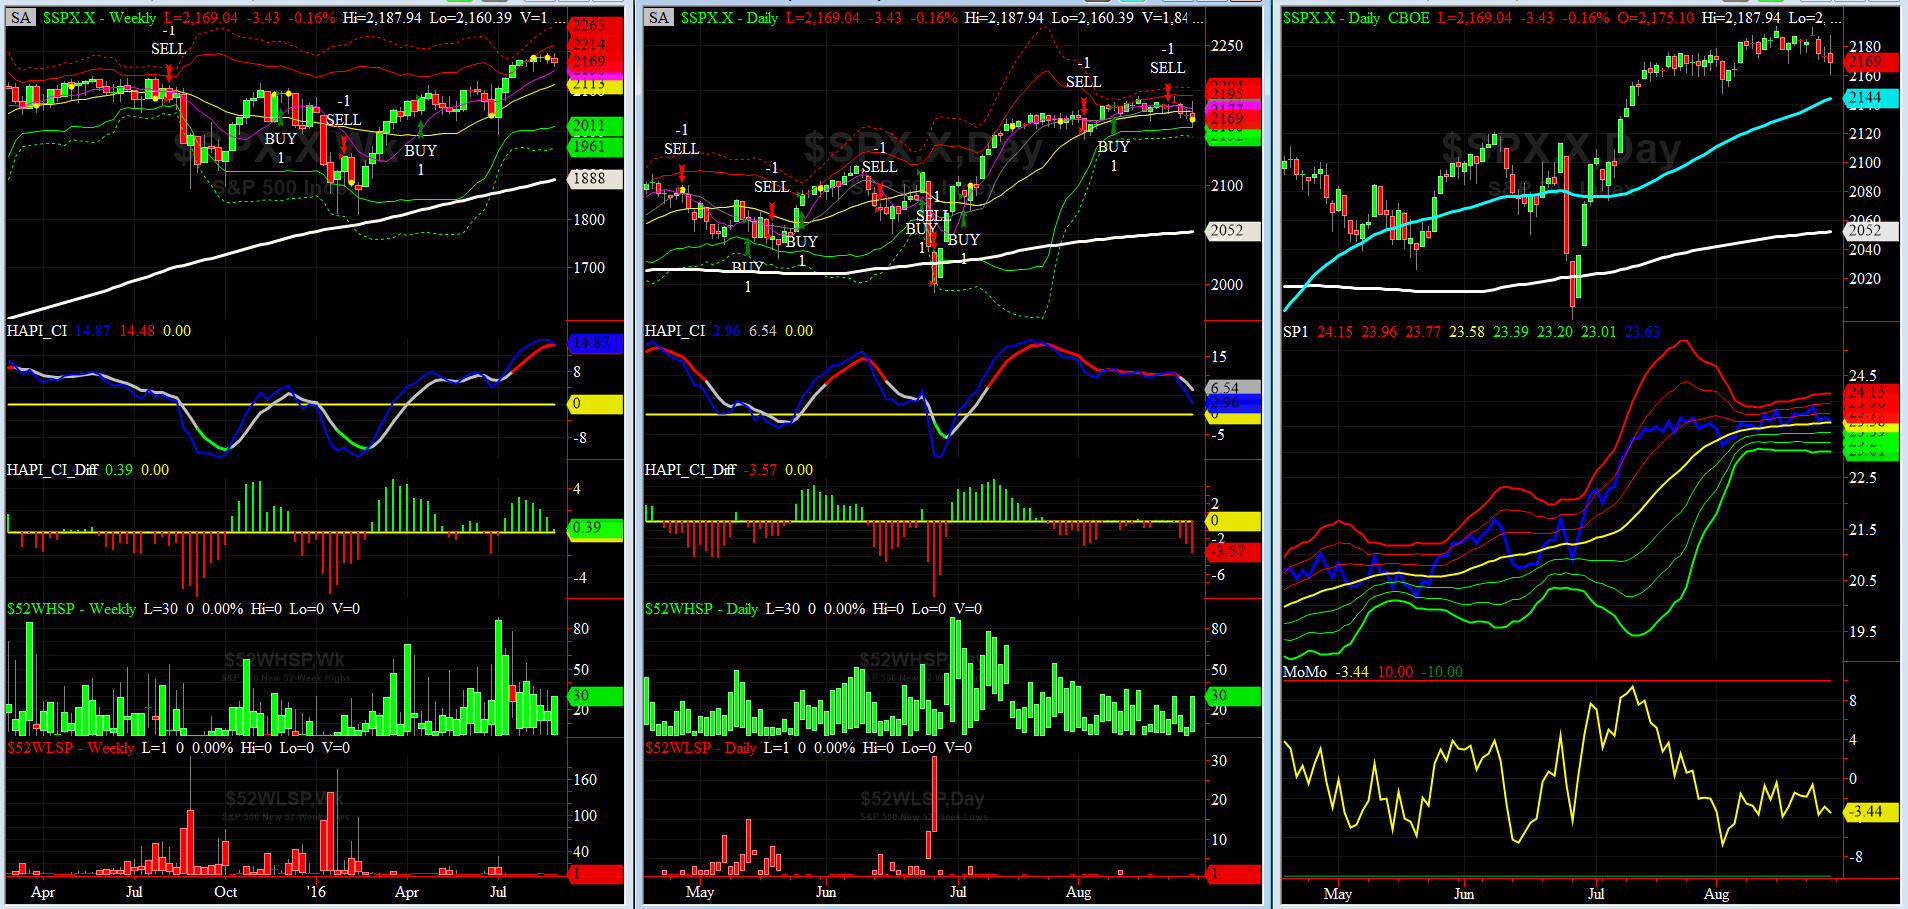
HA_SP1_Momo Chart
WEEKLY Timing Model = on a BUY Signal since Friday 4/15/16 CLOSE at 2081
DAILY Timing Model = on a SHORT Signal since Monday 8/22/16 CLOSE at 2181
Max SPX 52wk-highs reading last week = 30 (over 120-140, the local maxima is in)
Max SPX 52wk-Lows reading last week = 1 (over 40-60, the local minima is in)
HA_SP1 = just above its zero sigma channels
HA_Momo = -3.44 (reversals most likely occur above +10 or below -10)
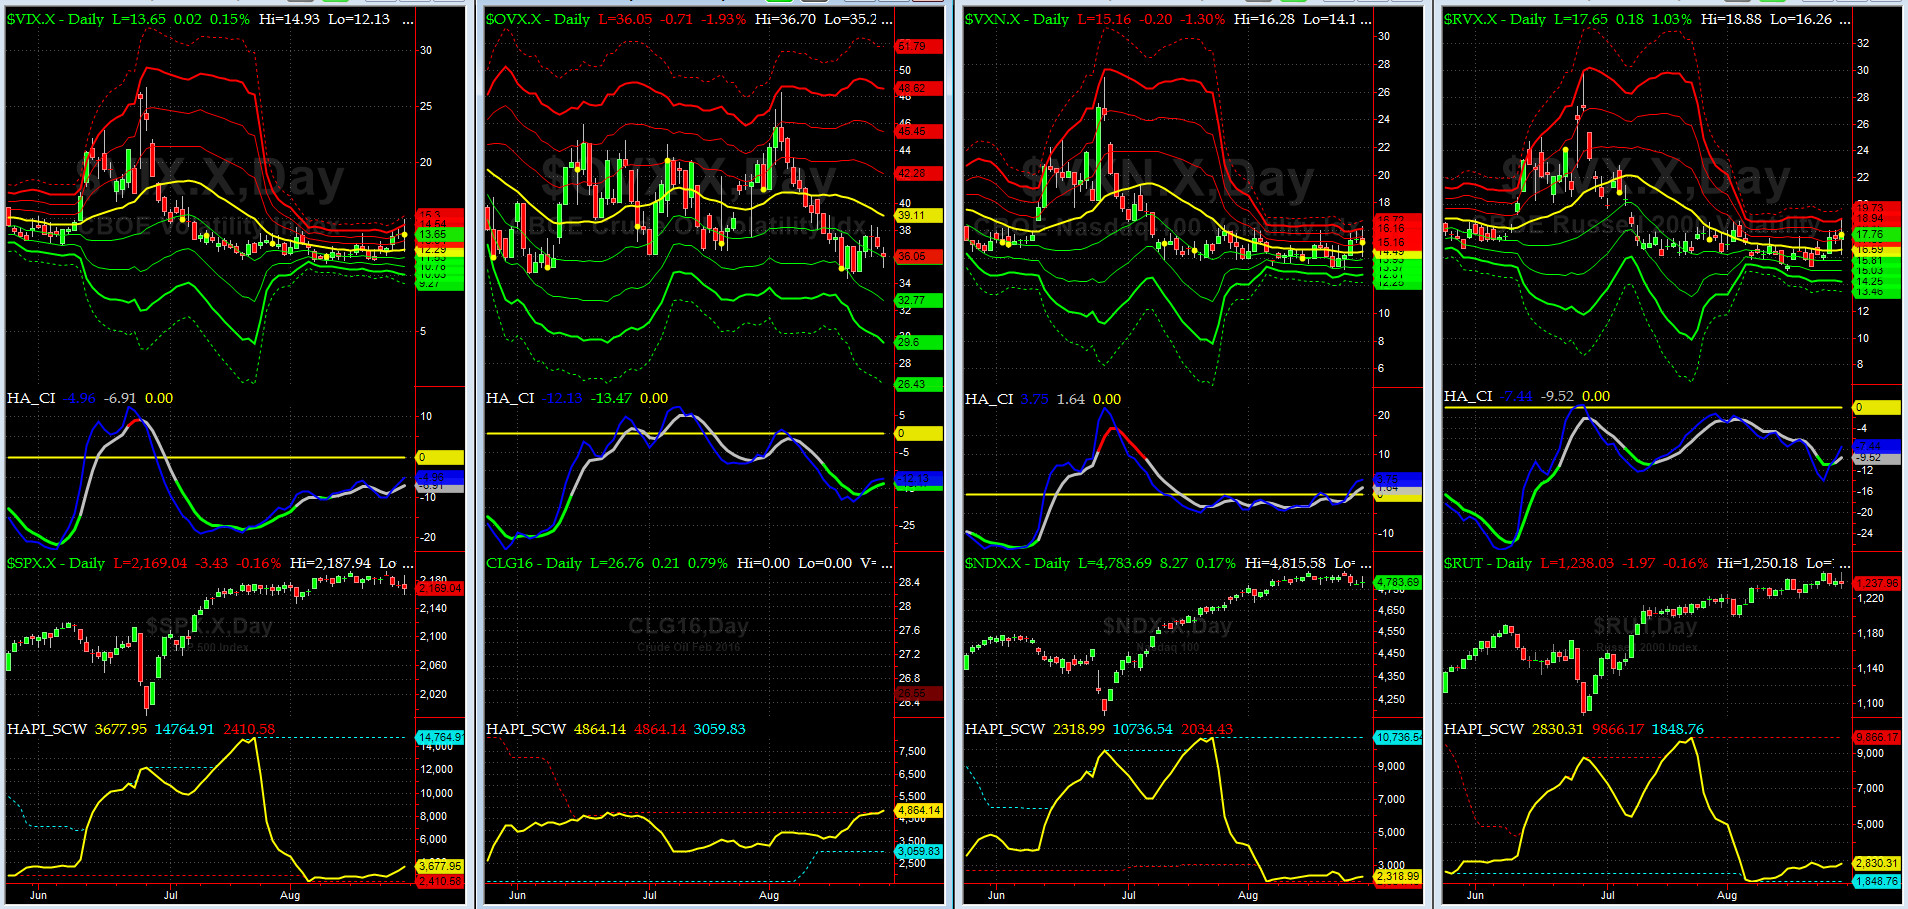
Vol of the Vols Chart
VIX = 14.1 is at its +2 sigma (remember it�s the VIX�s vol pattern (its sigma channels) that matters, and not the level of VIX itself (this is per Dr. Robert Whaley, a great mentor and the inventor of original VIX, now called VXO). VIX usually peaks around a test of its +4 sigma).
VIX finally moved up. This shockwave is still in progress.
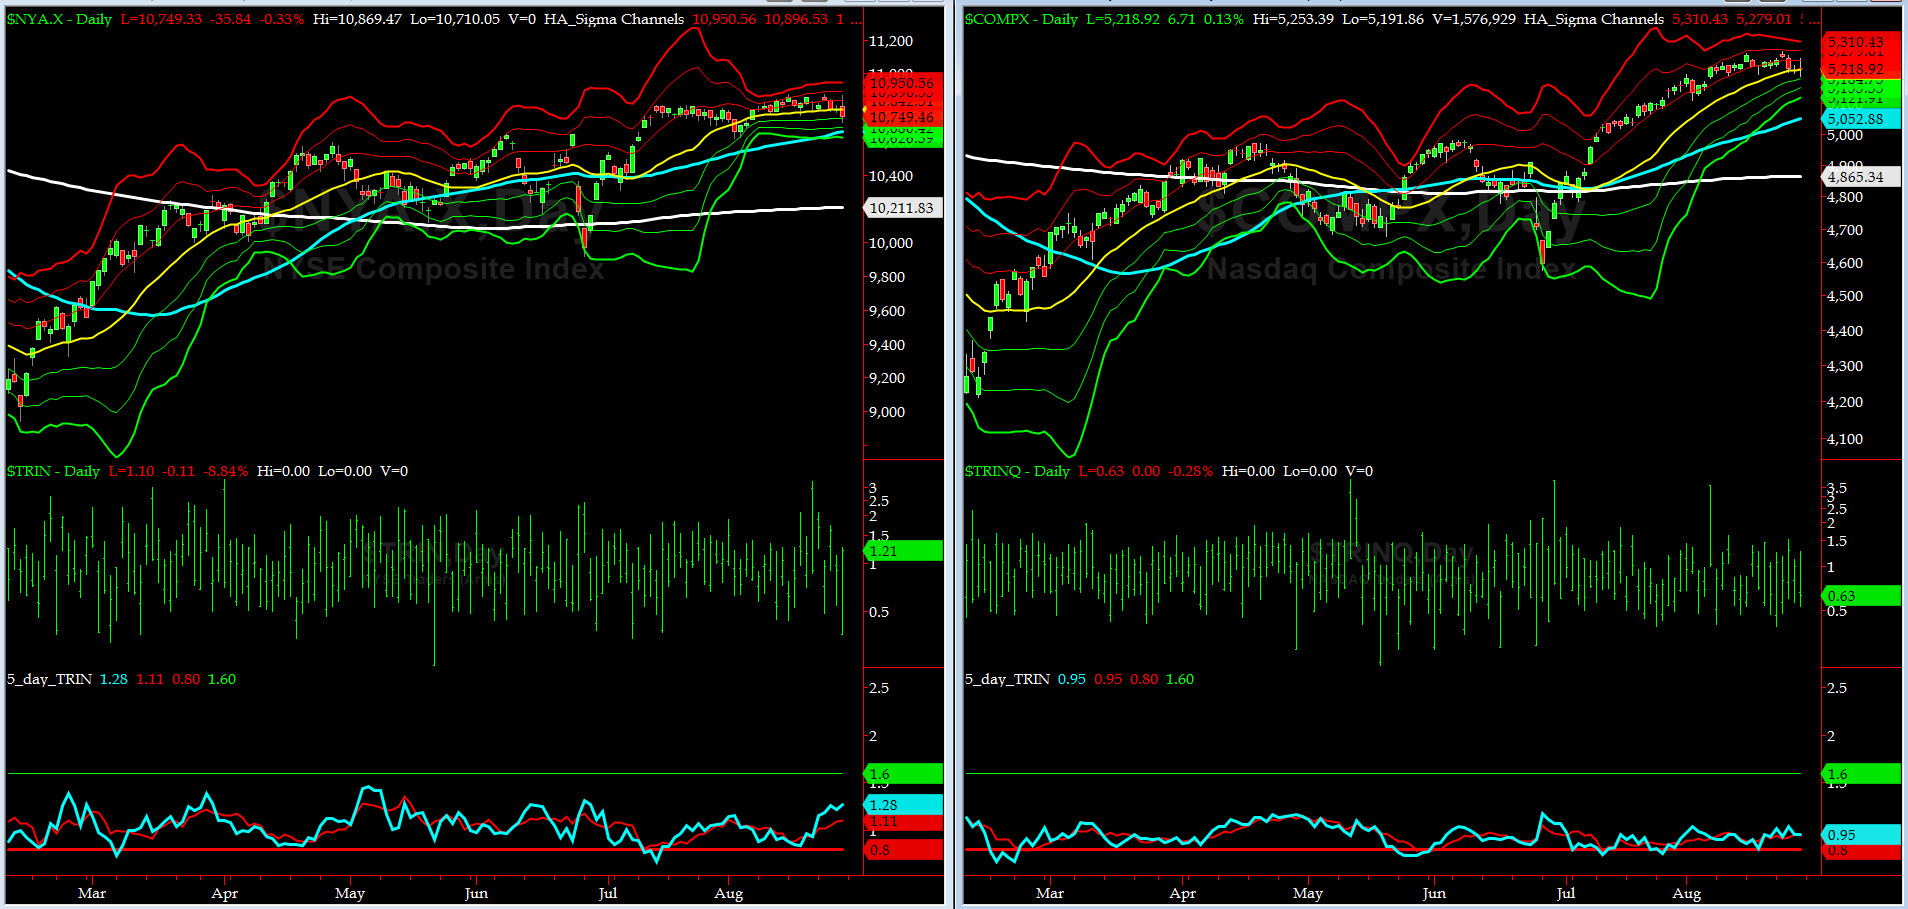
5-day TRIN & TRINQ Charts
Both charts are NEUTRAL here........
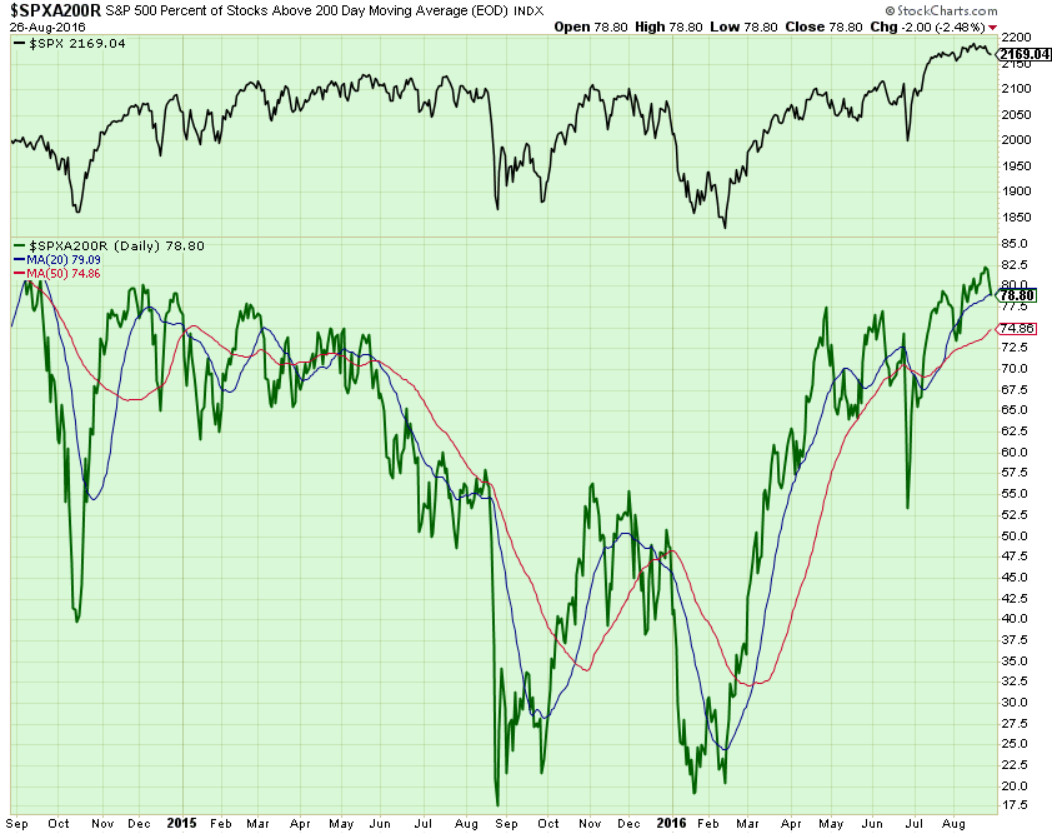
Components of SPX above their respective 200day MA Chart
This scoring indicator is at 78.8% following a very fast drop from 82% aread.
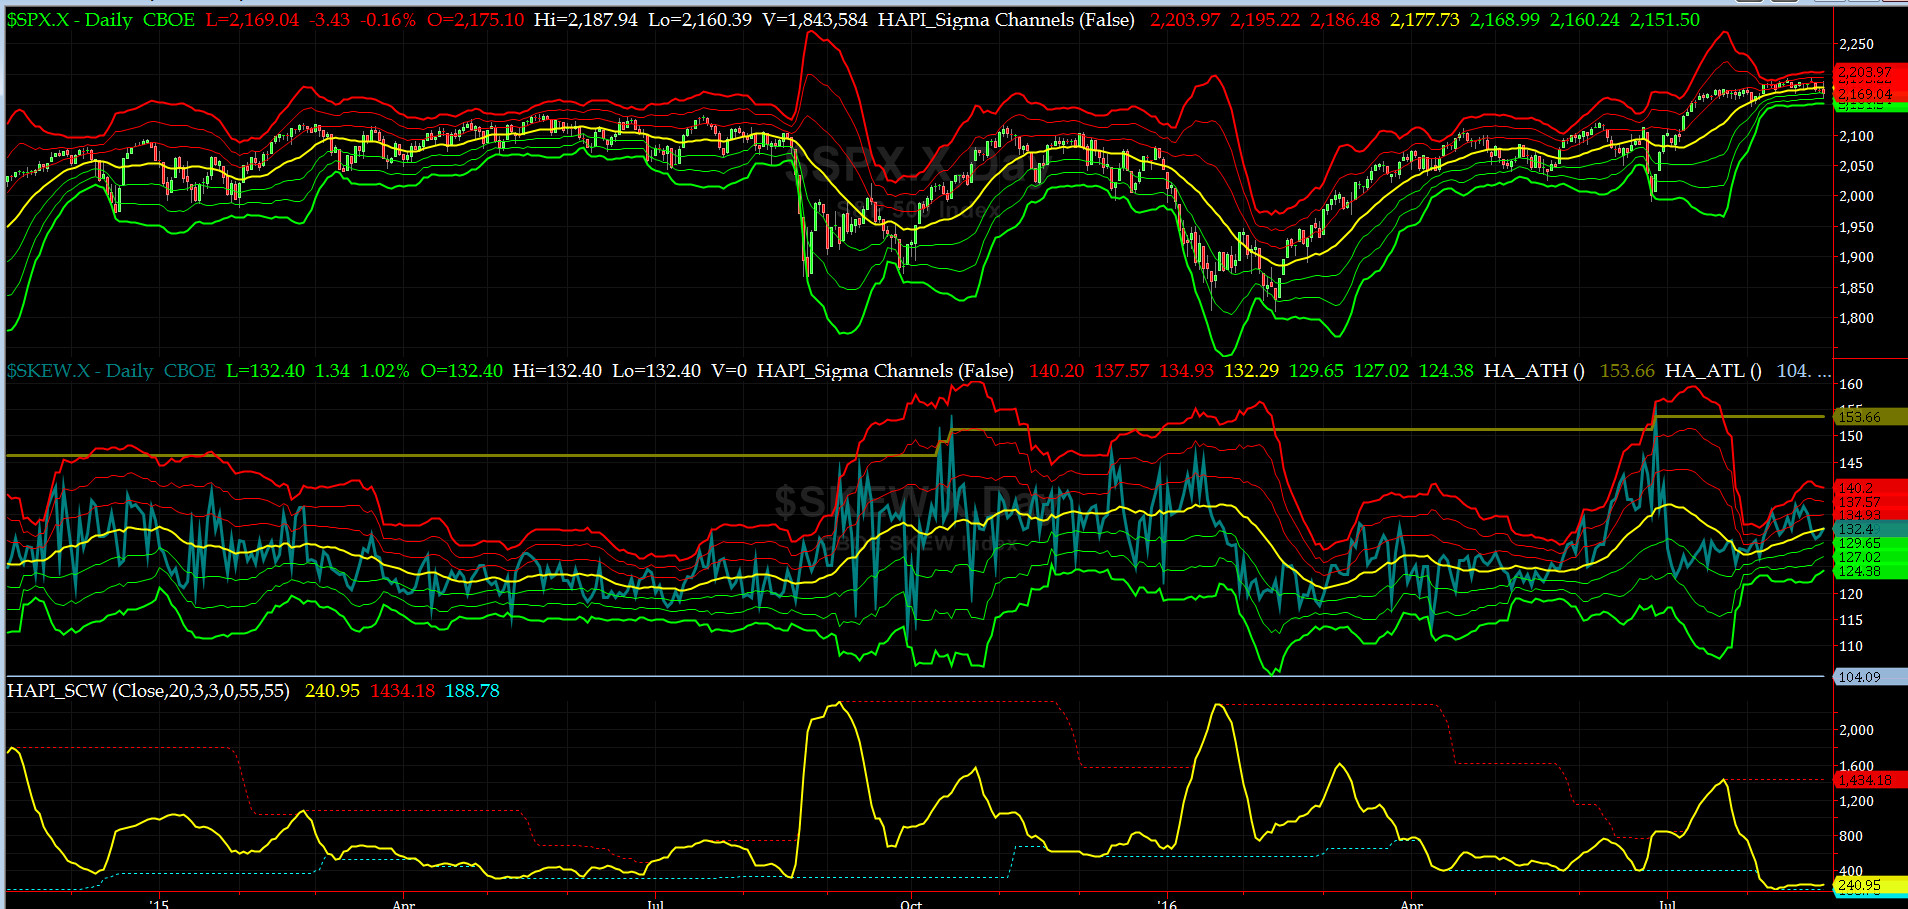
SPX SKEW (Tail Risk) Chart
SPX SKEW (Tail Risk) rose to 132 near its zero sigma (normal = 120-125, range 100-150)
All Quiet on the Mid-Western Front? Smart Money continues to smell trouble ahead (contested US General Election?)
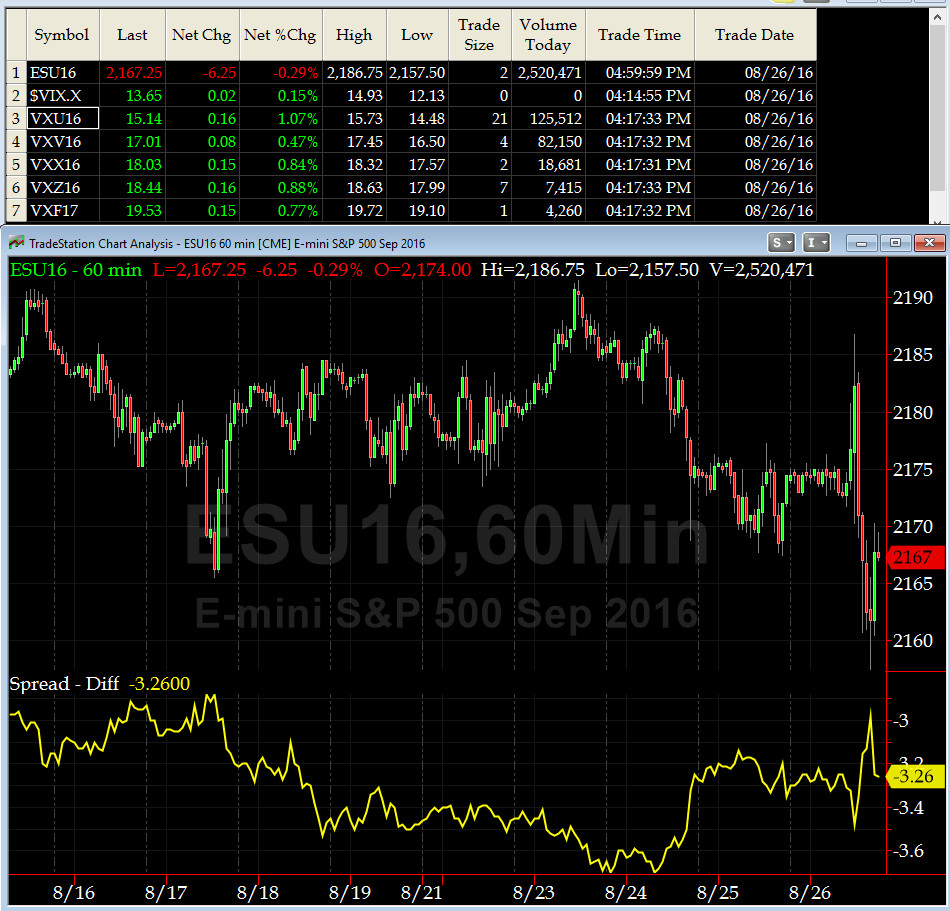
3-month VIX Futures Spread(VX) Chart
Our 3-month VIX Futures Spread (LONG SEPT16 & SHORT DEC16) closed at -3.26 on Friday. As you can tell, this indicator continues to signal that we are still overbought.
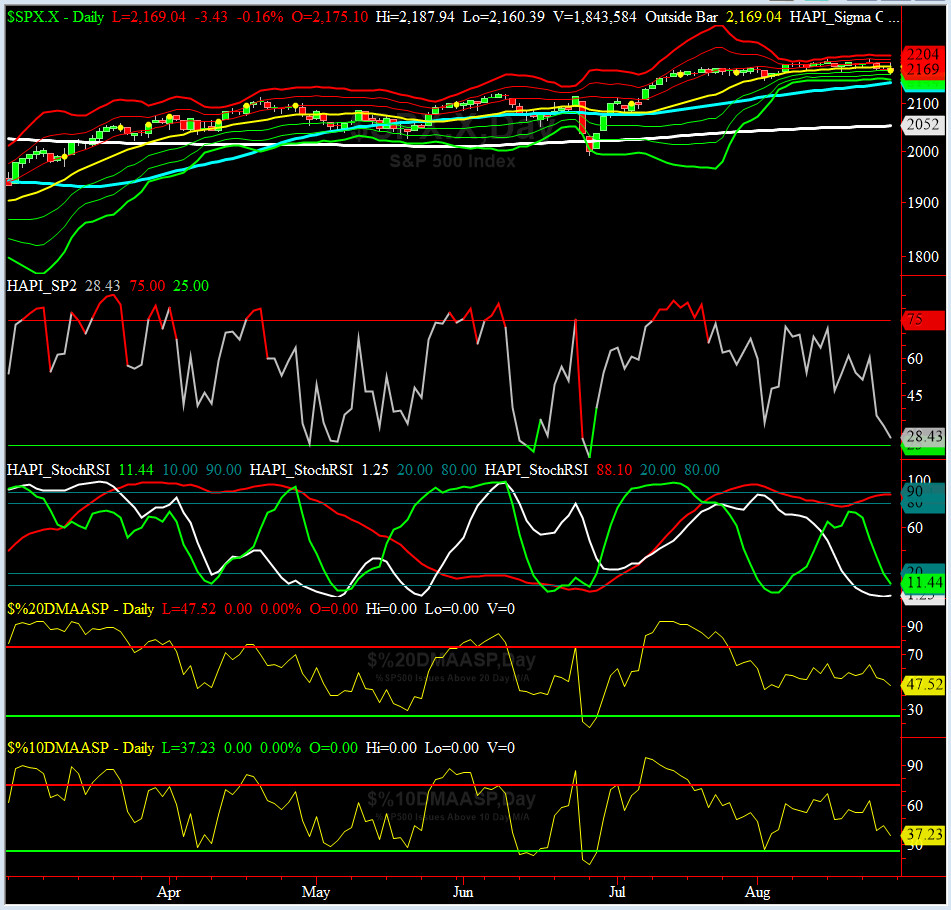
HA_SP2 Chart
HA_SP2 = 28 (Buy signal <= 25, Sell Signal >= 75)
This indicator says we are about to enter the oversold zone.

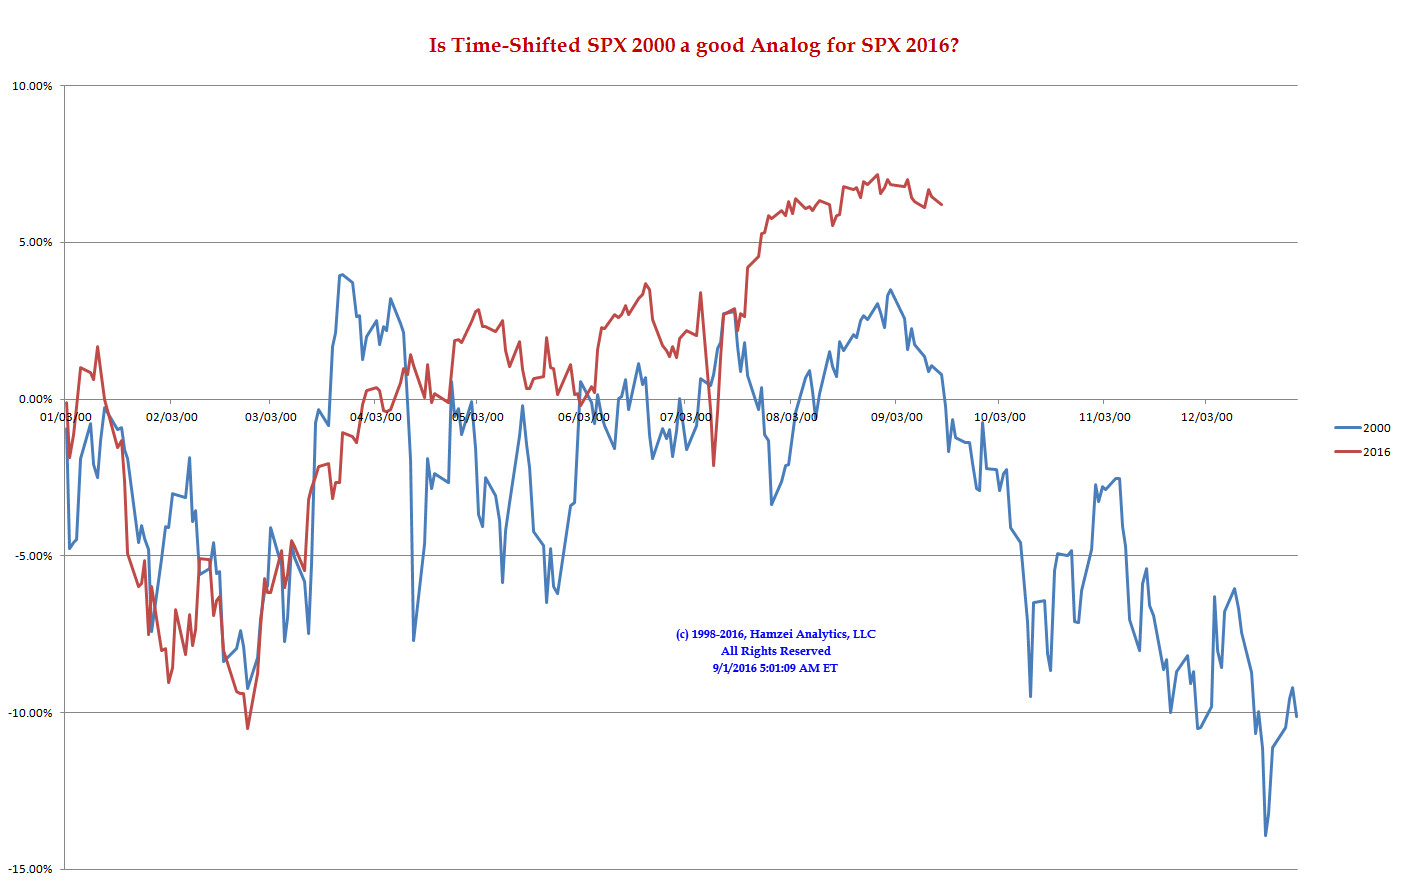
SPX 2000 Analog for SPX 2016
This Market is getting ready to Rock....
My XO, @Capt_Tiko, is ready too.....Got Tuna?
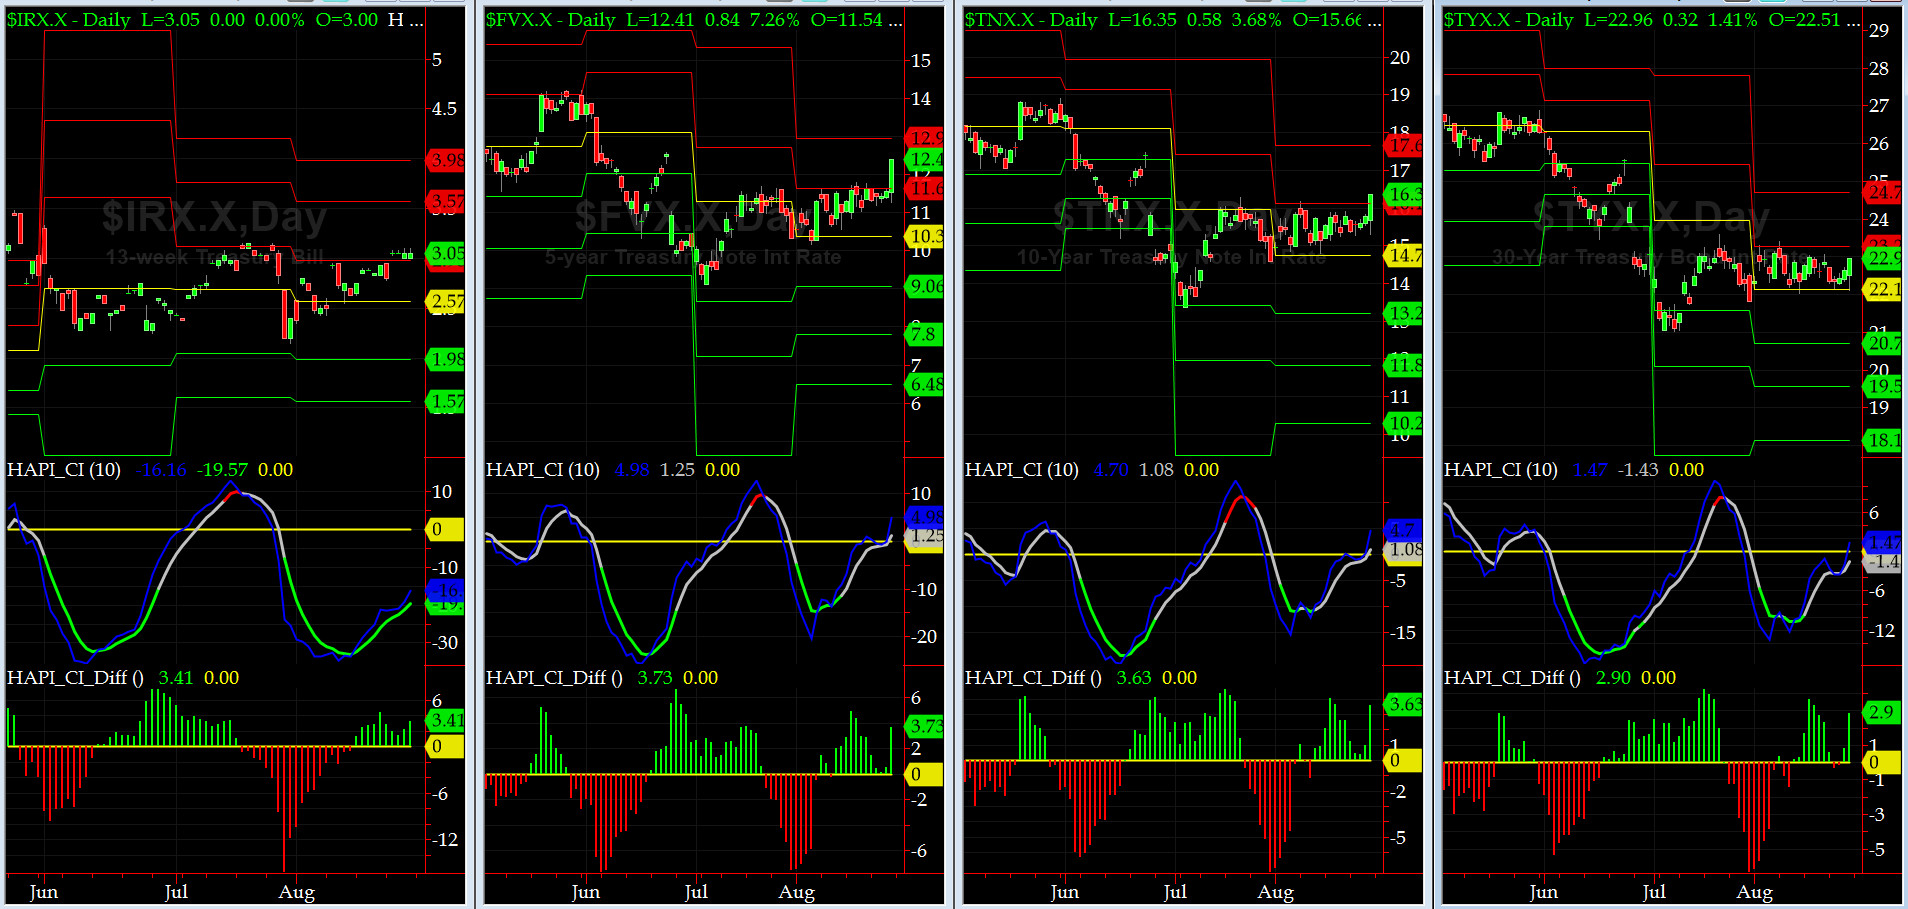
US Treasury T-Notes & T-Bonds Yields Chart
The jump in five-year note's (and to some degree the 10-yr note) YTM is worth watching this week.
Fari Hamzei
|


 Proactive Market Timing