
|
 |
 |
 |
 |
 |
 |
 |
 |
 Proactive Market Timing Proactive Market Timing
|
|
|
Most Recent PMT vs SPX Performance Chart

|
|
|
|
Tuesday, September 13, 2016, 1915ET
Updated Market Bias for Issue #158
Our current Market Bias with Timer Digest is LONG SPX as of Tuesday September 13 Close 2127.02
Our previous Market Bias was FLAT SPX as of Monday September 12 Close 2159.04
This is our 2nd Trade for this week = LONG SPX or SPY CallSpreads
SPX Second Profit Target = 2165
SPX First Profit Target = 2140-2155
SPX Money Management Stop = 2115
BOTTOM LINE: Again we emphasize that during the next few trading weeks, we have to be very cautious & keep our bet size in check.
Note: Once one of our SPX targets is hit (Profit or Money Management), our Option/ETF trade for that week is over. Go to Cash and wait for the next PMT Issue.
Fari Hamzei
|
|
|
|
|
|
Tuesday, September 13, 2016, 1900ET
Notice of Change of Market Bias with Timer Digest
Dear Jim,
Fun never ends in This Side of Paradise. Another great day in the futures markets on the short side, and now, we are ready to get LONG SPX again from 2127s.
Fari Hamzei
|
|
|
|
|
|
Tuesday, September, 2016, 1845ET
Timer and SP1_momo Charts Update

Timer Charts of S&P-500 Cash Index (SPX) + NASDAQ-100 Cash Index (NDX)
HA_SP1_Momo Chart
|
|
|
|
|
|
Monday, September 12, 2016, 2114ET
Notice of Change of Market Bias with Timer Digest
Dear Jim,
Another day for the history books. We are exhausted & so is the Market.
Taking a break and going FLAT SPX for now (and booking 31 handles). SPX Close = 2159.04.
Fari Hamzei
|
|
|
|
|
|
Monday, September 12, 2016, 2000ET
Link for Tonight's Market Timing Webinar
Click here to Play
Thanks for attending,
Fari Hamzei
|
|
|
|
|
|
Monday, September 12, 2016, 1930ET
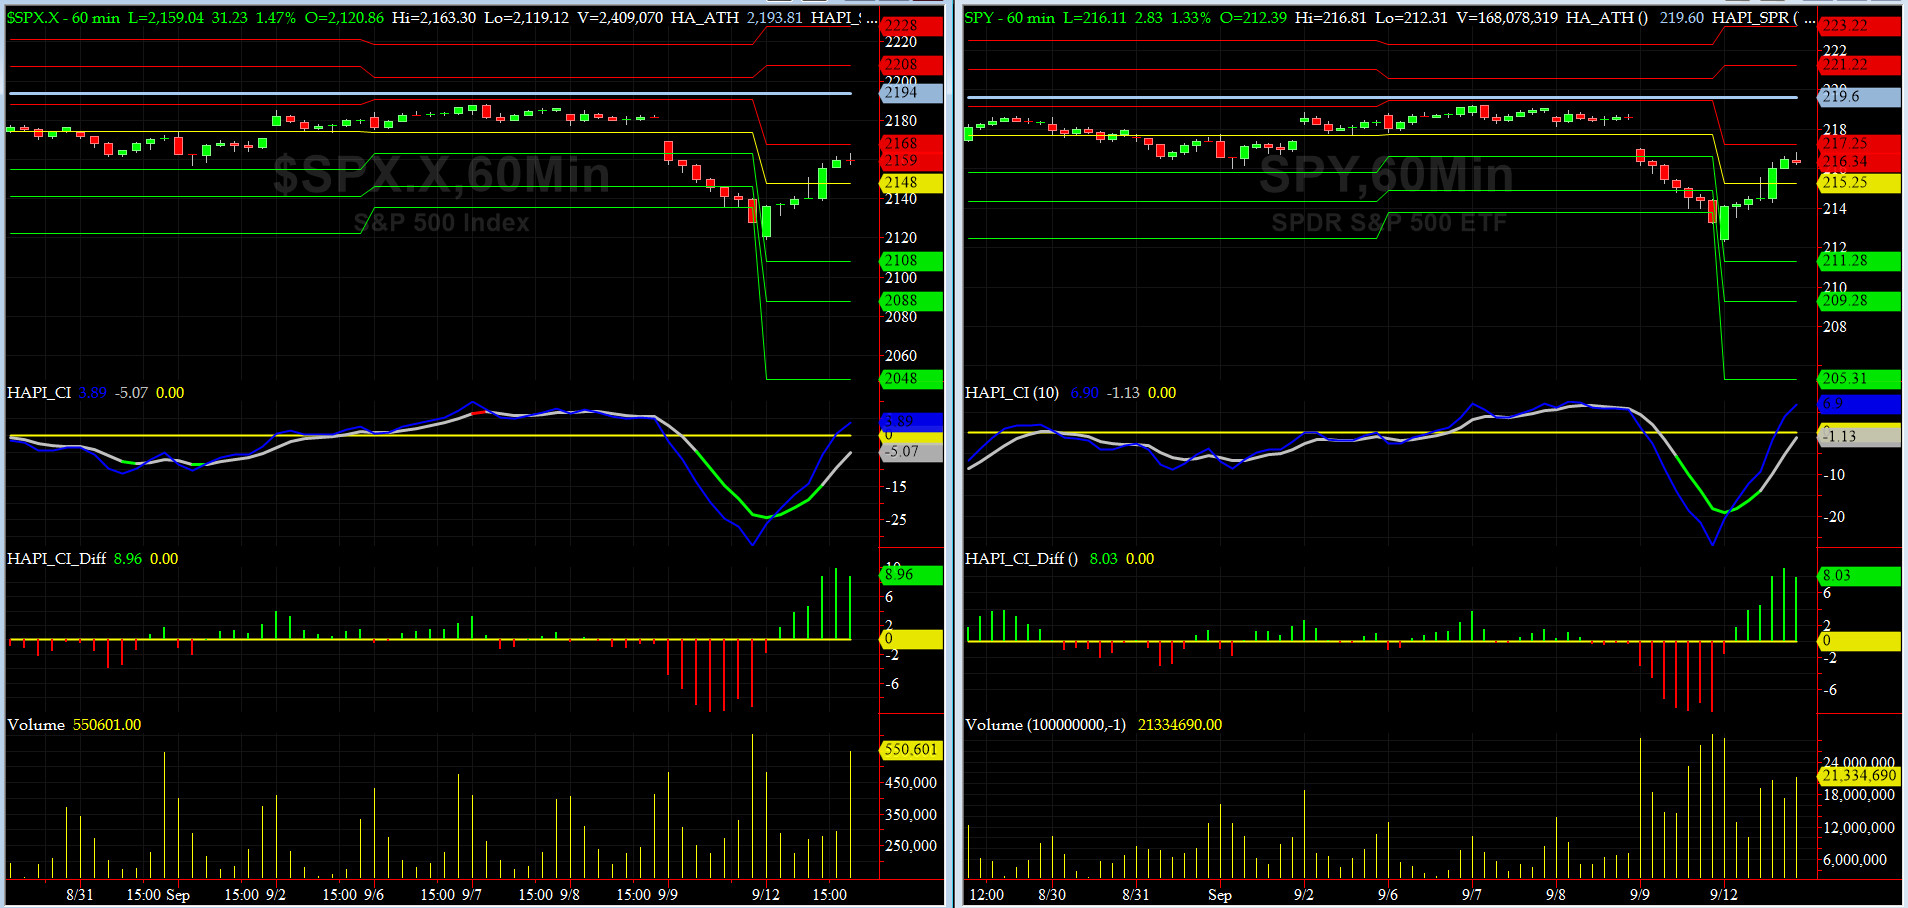
Companion Chart for Market Bias Review, Issue #158
|
|
|
|
|
|
Sunday, September 11, 2016, 1900ET
Market Bias, Issue #158
Our current Market Bias with Timer Digest is LONG SPX as of Friday September 9 Close 2127.81
Our previous Market Bias was SHORT SPX as of Monday August 1 Close 2170.84
This WEEK�s Trade = LONG SPX or SPY CallSpreads
SPX Second Profit Target = 2165
SPX First Profit Target = 2145-2150
SPX Money Management Stop = 2120
BOTTOM LINE: During the next few trading weeks, we have to be very cautious. IOHO, this week, at best, we should expect a dead-cat bounce. As my XO, @Capt_Tiko, warned us: keep your bet size in check and stock up on [iced] tea.
Note: Once one of our SPX targets is hit (Profit or Money Management), our Option/ETF trade for that week is over. Go to Cash and wait for the next PMT Issue.
Fari Hamzei
|
|
|
|
|
|
Saturday, September 10, 2016, 1900ET
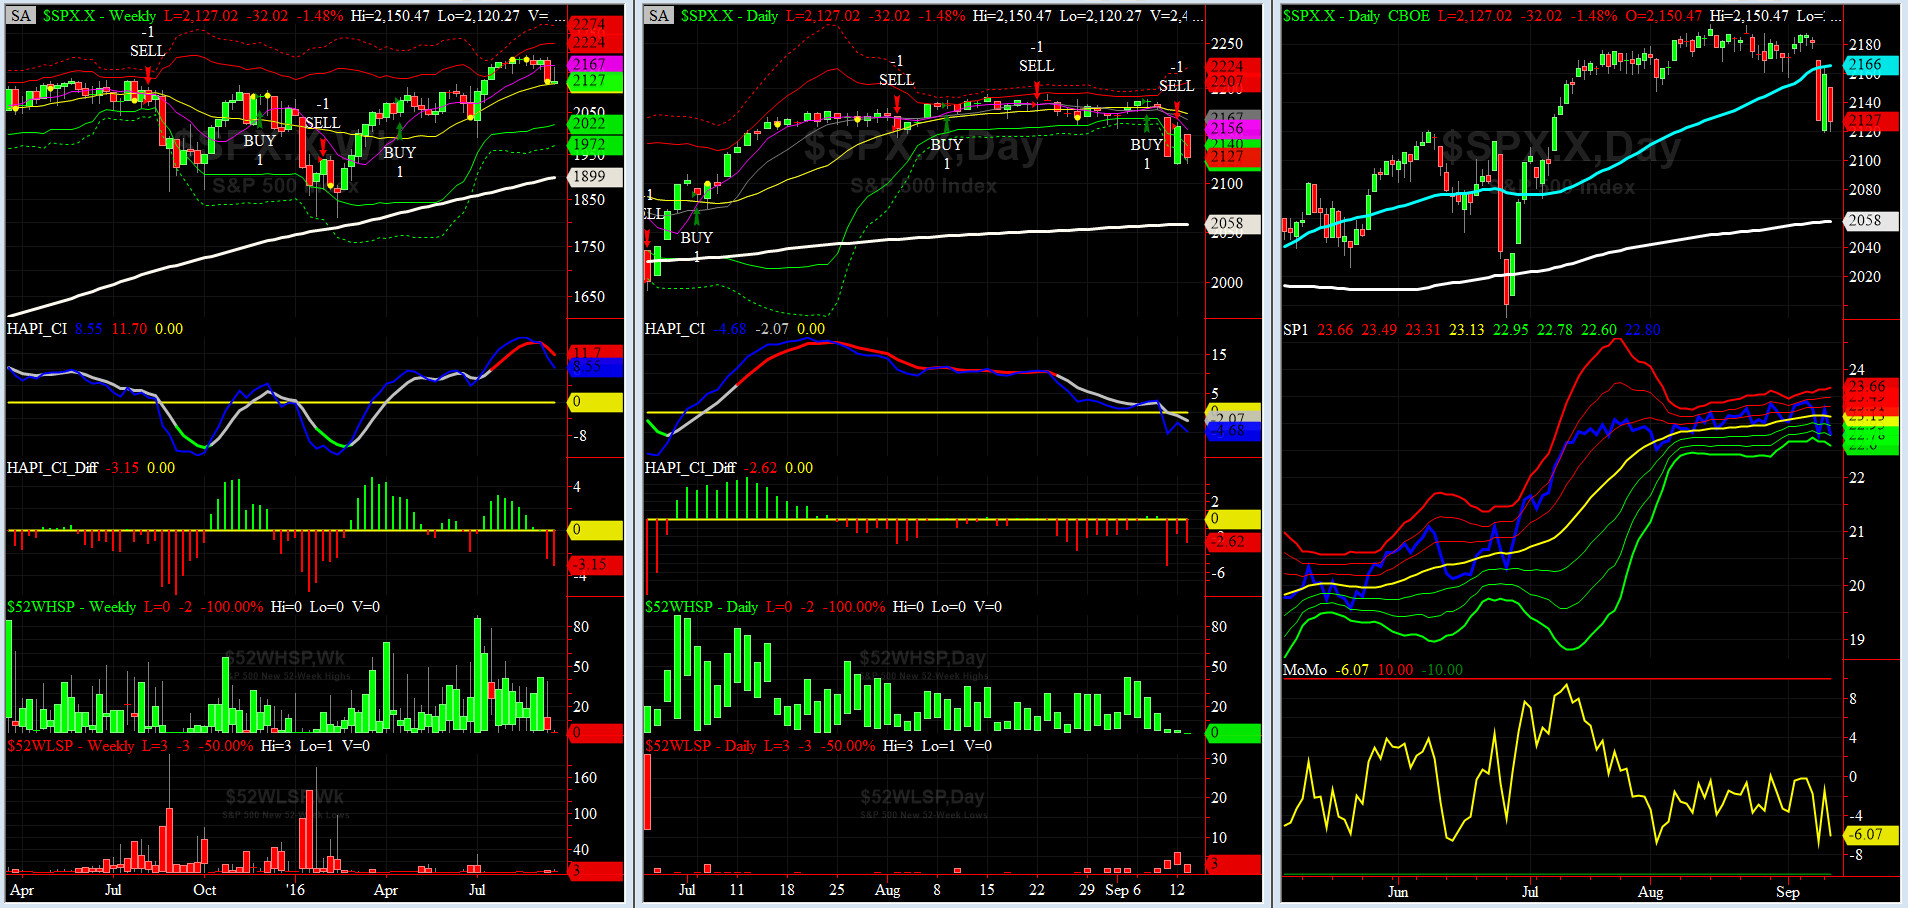
Market Timing Charts, Analysis & Commentary for Issue #158
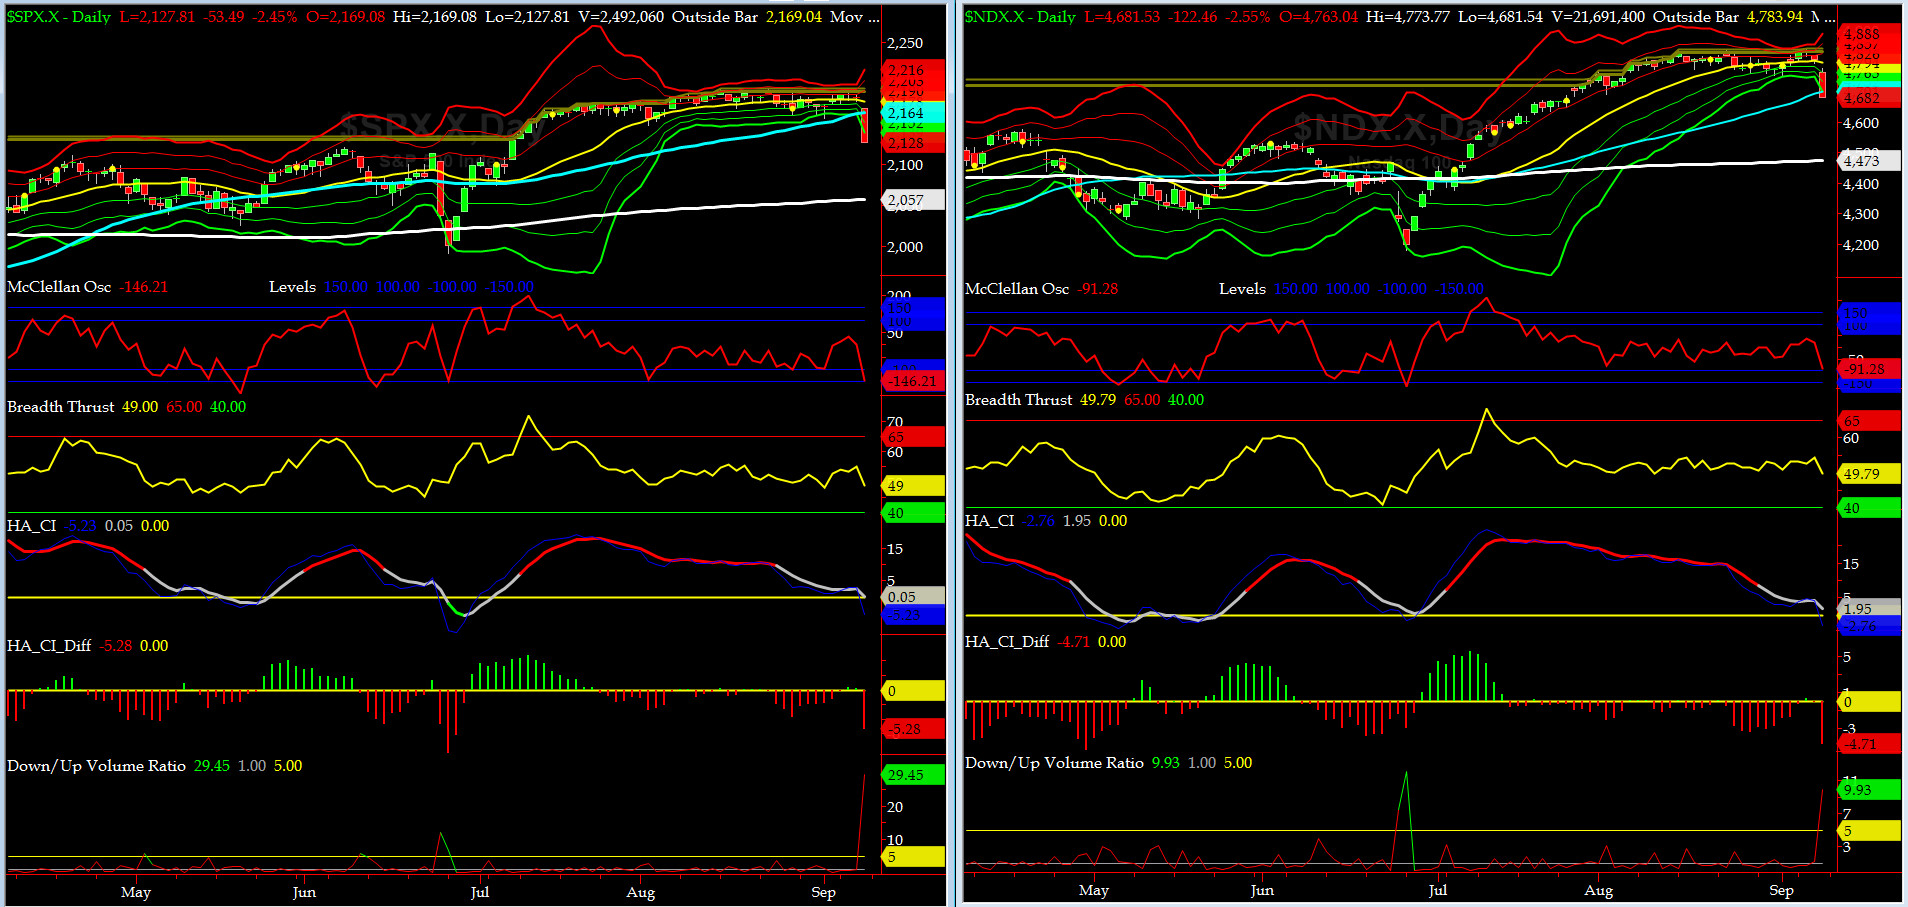
Timer Charts of S&P-500 Cash Index (SPX) + NASDAQ-100 Cash Index (NDX)
Most recent S&P-500 Cash Index (SPX): 2127.81 down -52.17 (down -2.39%) for the week ending on Friday, September 9th, 2016, which closed below its -3 sigma.
SPX ALL TIME INTRADAY HIGH = 2193.81 (reached on Monday, August 15, 2016)
SPX ALL TIME CLOSING HIGH = 2190.15 (reached on Monday, August 15, 2016)
Current DAILY +2 Sigma SPX = 2203 with WEEKLY +2 Sigma = 2223
Current DAILY 0 Sigma (20 day MA) SPX = 2178 with WEEKLY 0 Sigma = 2120
Current DAILY -2 Sigma SPX = 2152 with WEEKLY -2 Sigma = 2016
NYSE McClellan Oscillator = -146 (-150 is start of the O/S area; around -275 to -300 area or lower, we go into the �launch-pad� mode, over +150, we are in O/B area)
NYSE Breadth Thrust = 49 (40 is considered as oversold and 65 as overbought)
It ain't over till Fat Lady sings.... what a day it was with down volume accounting for 97% of total volume (NYSE Down to Up Volume Ratio spiked to 29.45).
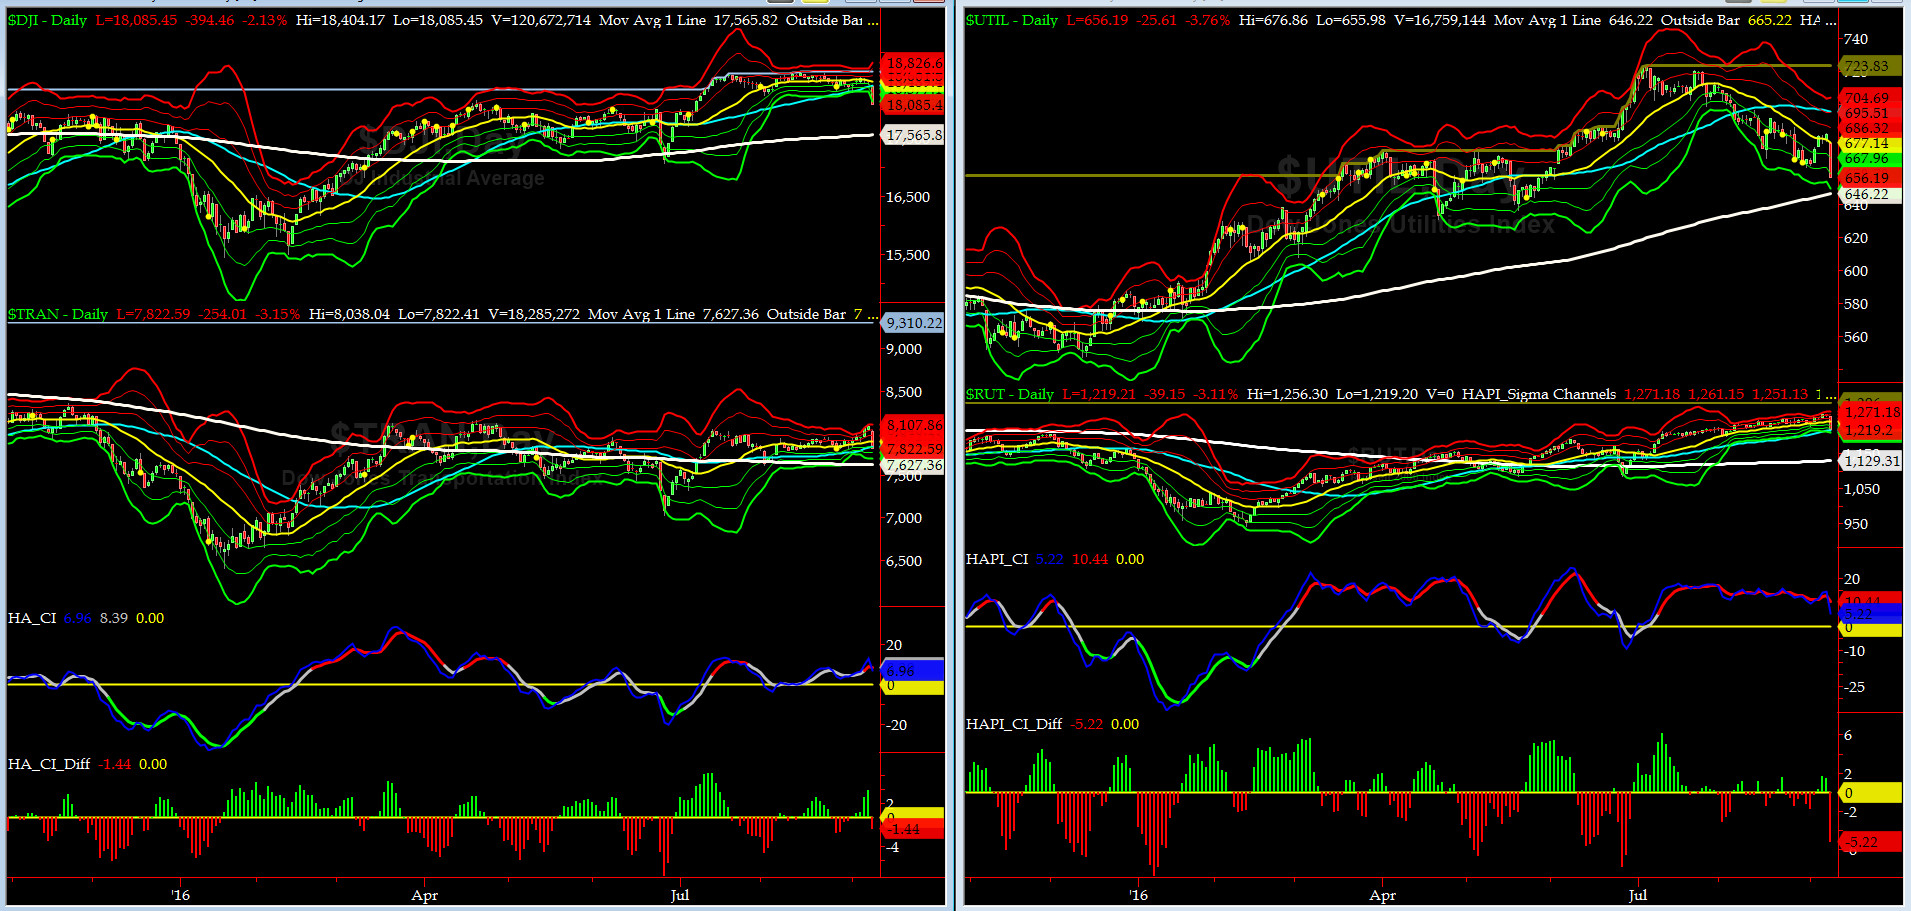
Canaries [in the Coal Mine] Chart for DJ TRAN & RUT Indices
200-Day MA DJ TRAN = 7627 or 2.6% below DJ TRAN (max observed in last 5 yrs = 20.2%, min = -20.3%)
200-Day MA RUT = 1129 or 8% below RUT (max observed in last 5 yrs = 21.3%, min = -22.6%)
DJ Transports (proxy for economic conditions 6 to 9 months hence) was about to make a channel breakout on Thursday and then came Hurricane Friday and a 3.15% drop to its 50-day MA!!
Russell 2000 Small Caps (proxy for RISK ON/OFF) was also hit, and stopped just barely above its 50-day MA. Oh, how the Mighty can fall fast..... <<< note to HRC!
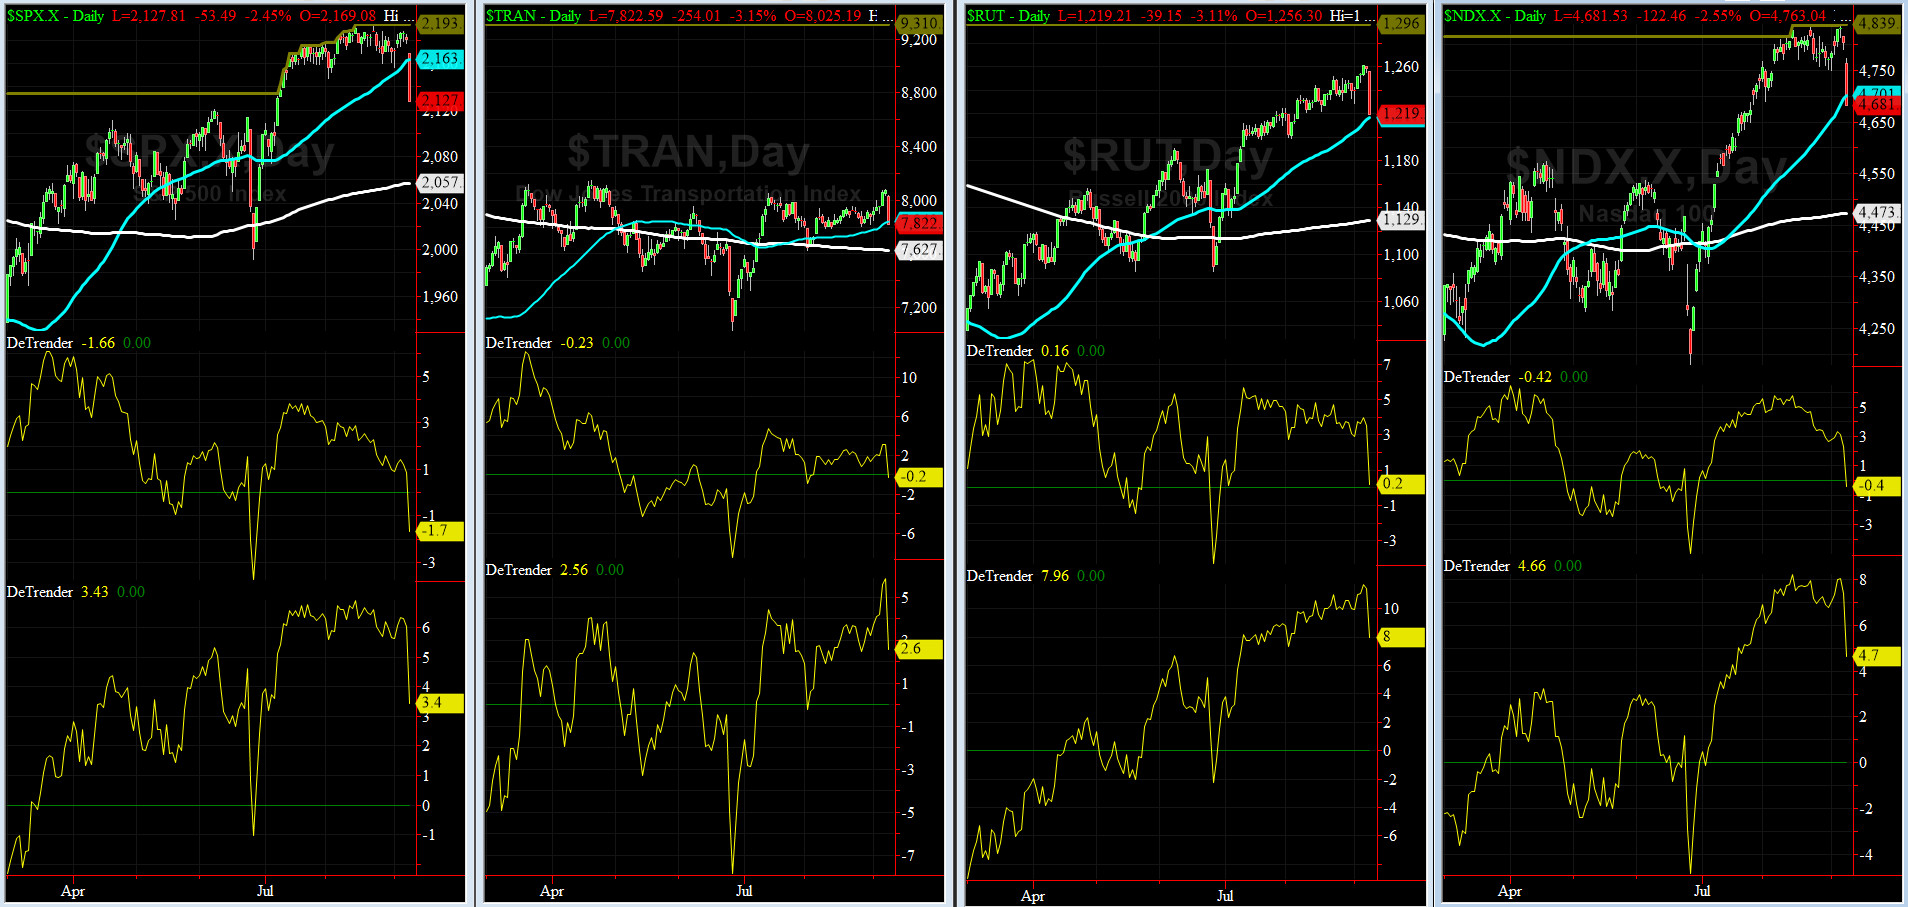
DeTrenders Charts for SPX, NDX, TRAN & RUT Indices
50-Day MA SPX = 2163 or 1.7% above SPX (max observed in last 5 yrs = +8.6%, min = -9.3%)
200-Day MA SPX = 2057 or 3.4% below SPX (max observed in last 5 yrs = 15.2%, min = -14%)
On Friday, 3 of our 8 DeTrenders went negative abruptly, and the fourth one missed by 0.2%. DeTrenders for TRAN & RUT continue to remain on our radar as we monitor their price action with caution.
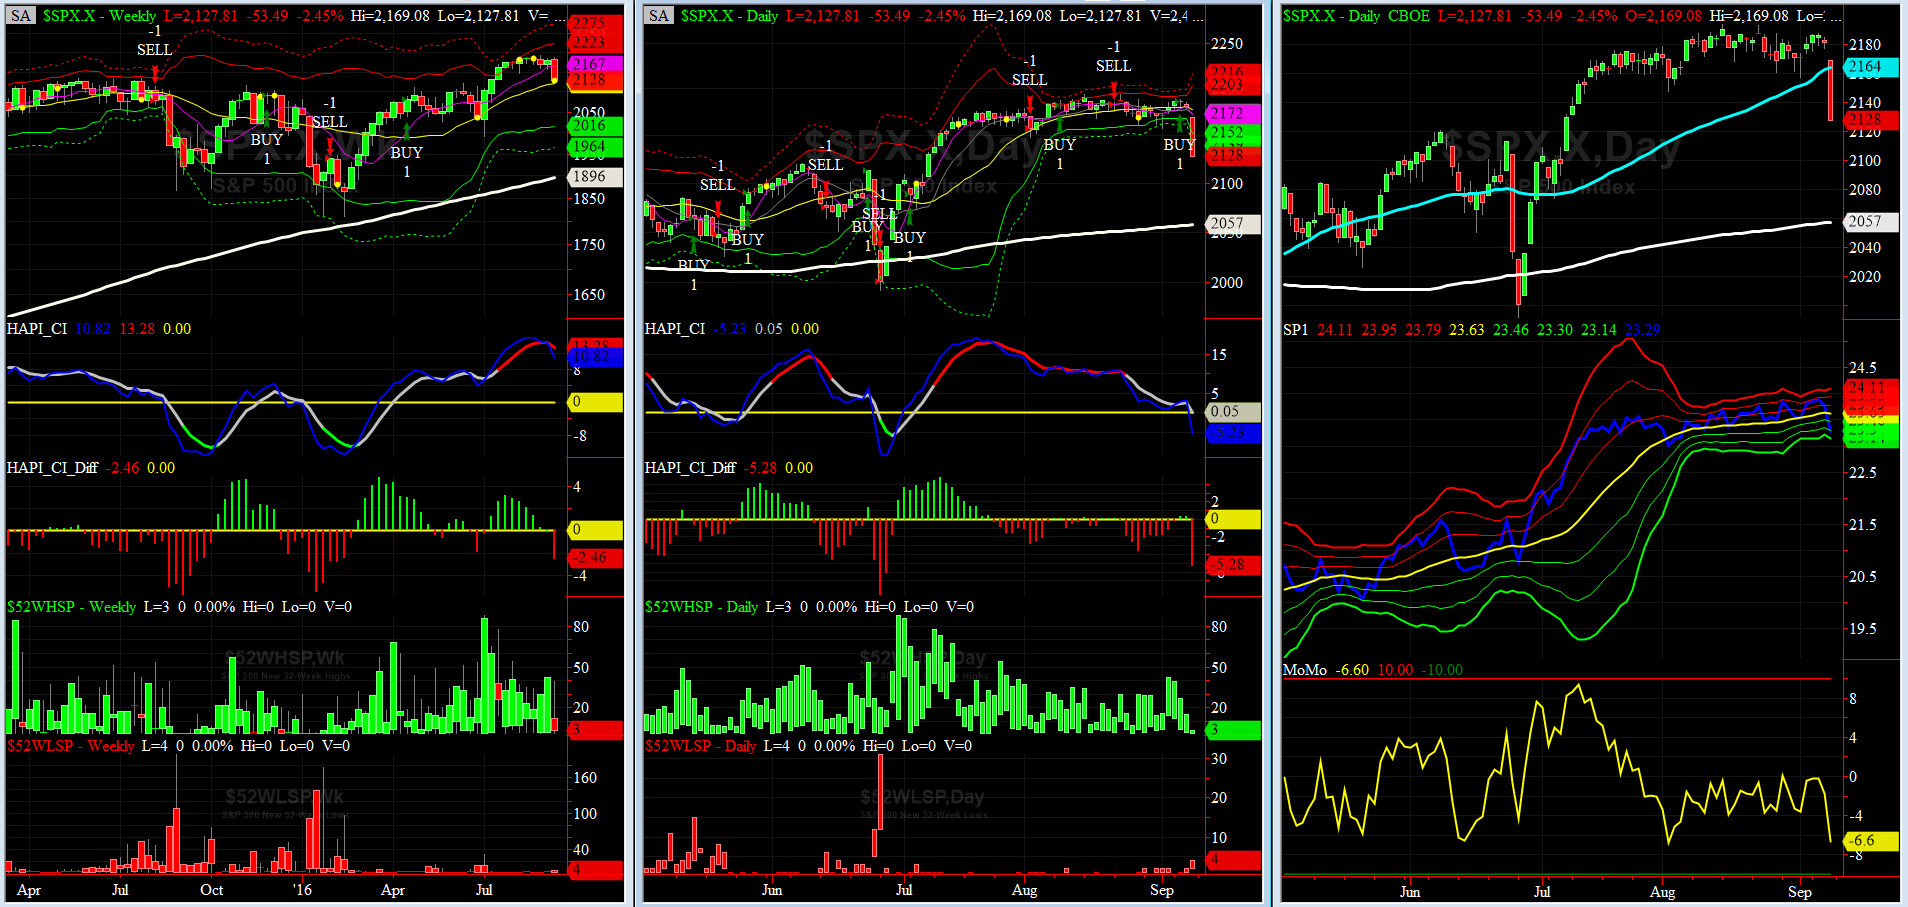
HA_SP1_Momo Chart
WEEKLY Timing Model = on a BUY Signal since Friday 4/15/16 CLOSE at 2081
DAILY Timing Model = on a BUY Signal since Wednesday 9/7/16 CLOSE at 2186
Max SPX 52wk-highs reading last week = 39 (over 120-140, the local maxima is in)
Max SPX 52wk-Lows reading last week = 4 (over 40-60, the local minima is in)
HA_SP1 = just above its -2.5 sigma channels
HA_Momo = -6.6(reversals most likely occur above +10 or below -10)
As expected in the last issue, our coveted CI Indicator for WEEKLY SPX had a down cross (CI Diff went RED). What was UNEXPECTED, was its amplitude.
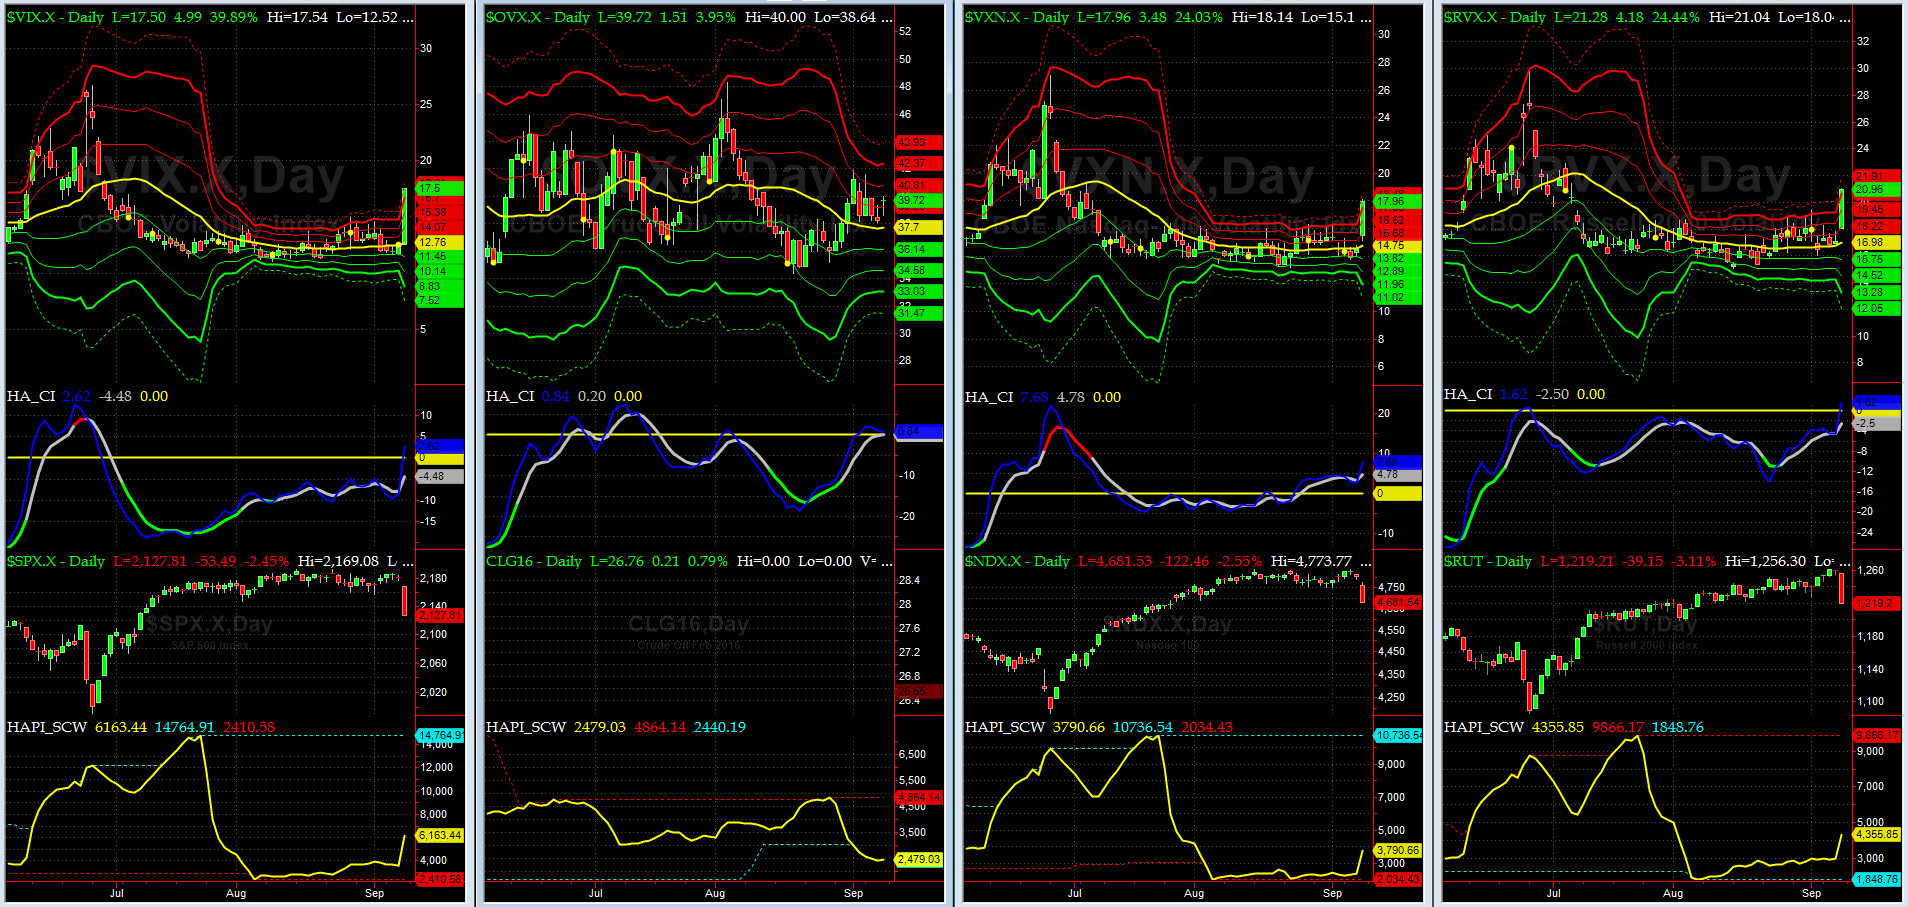
Vol of the Vols Chart
VIX = 17.5 is almost at its +4 sigma (remember it�s the VIX�s vol pattern (its sigma channels) that matters, and not the level of VIX itself (this is per Dr. Robert Whaley, a great mentor and the inventor of original VIX, now called VXO). VIX usually peaks around a test of its +4 sigma).
We have a new shockwave in progress.
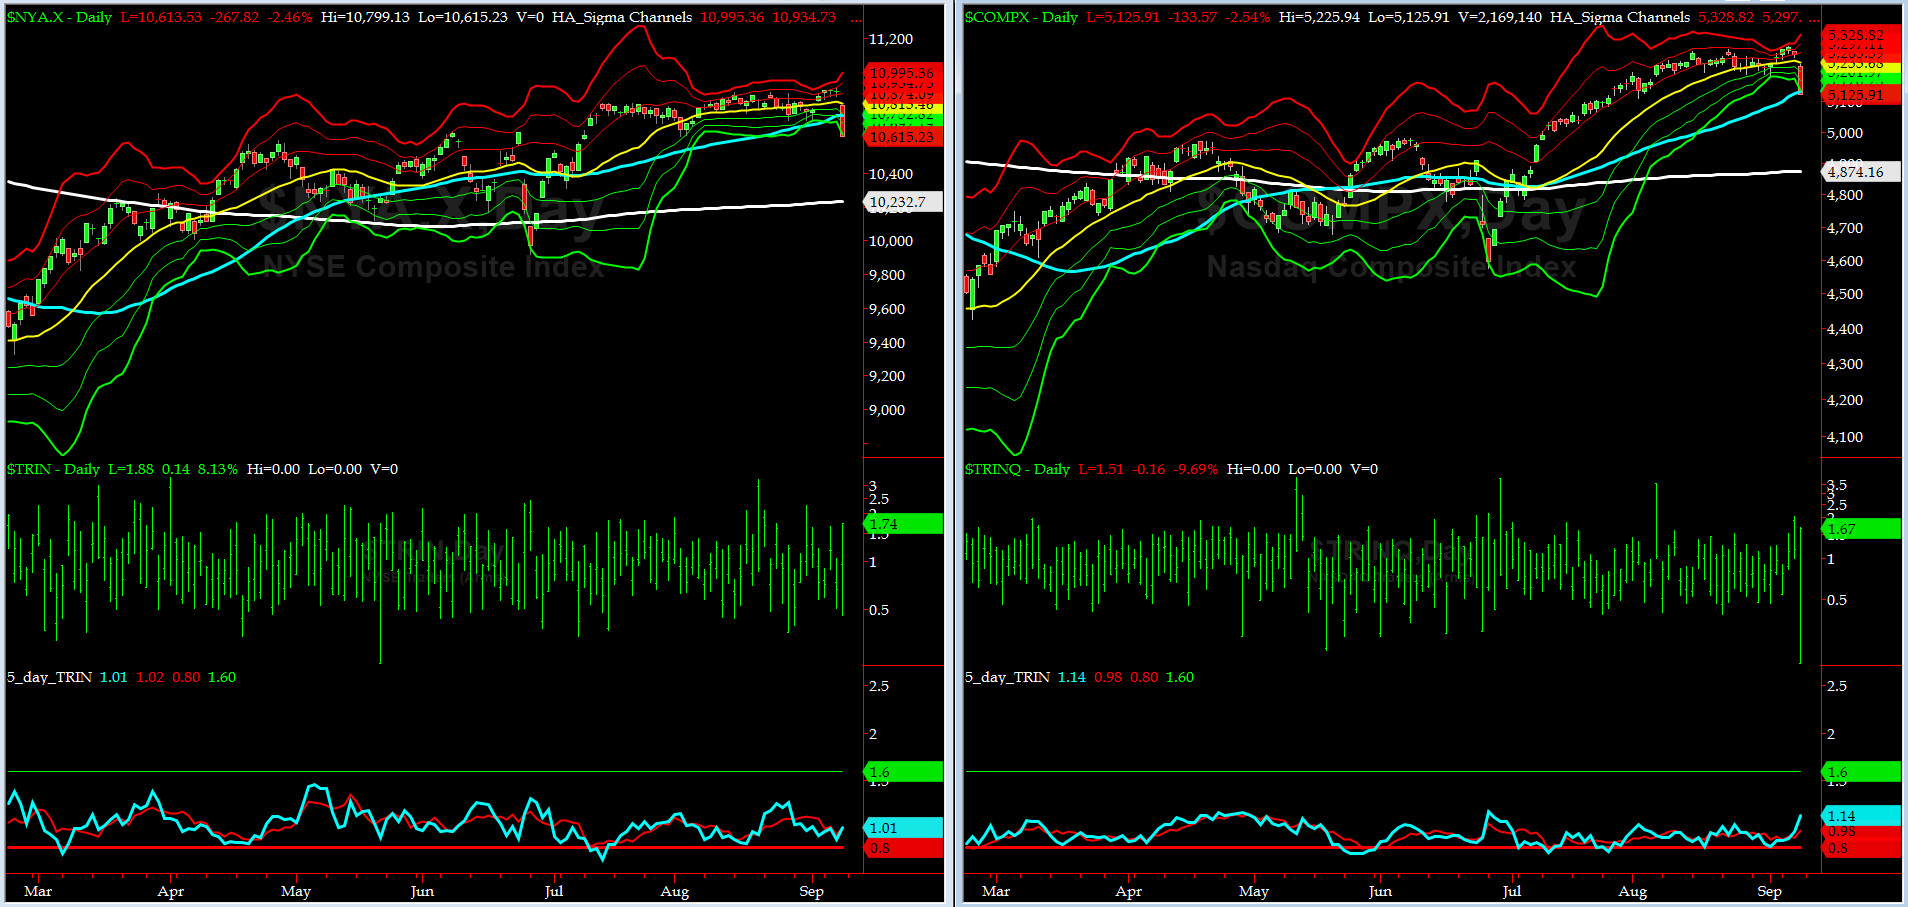
5-day TRIN & TRINQ Charts
Both charts are still NEUTRAL here........
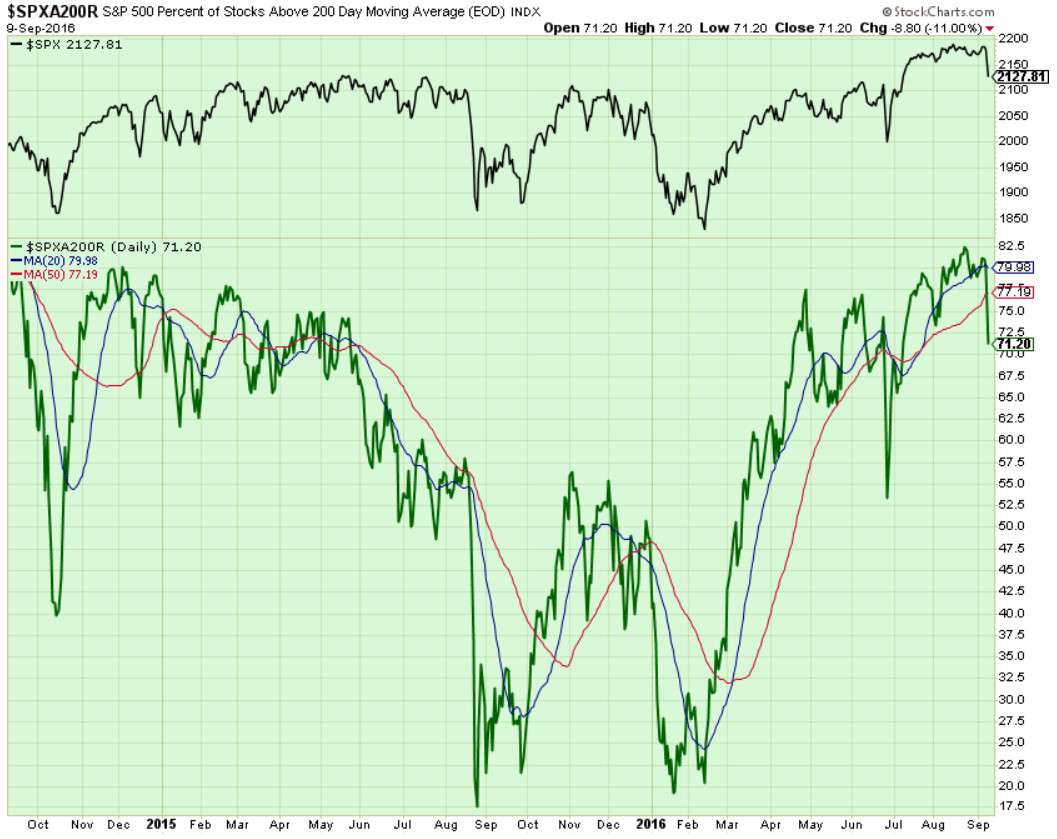
Components of SPX above their respective 200day MA Chart
This scoring indicator dropped 11% on Friday as selling was across the board and severe. next stop is 65-67%.
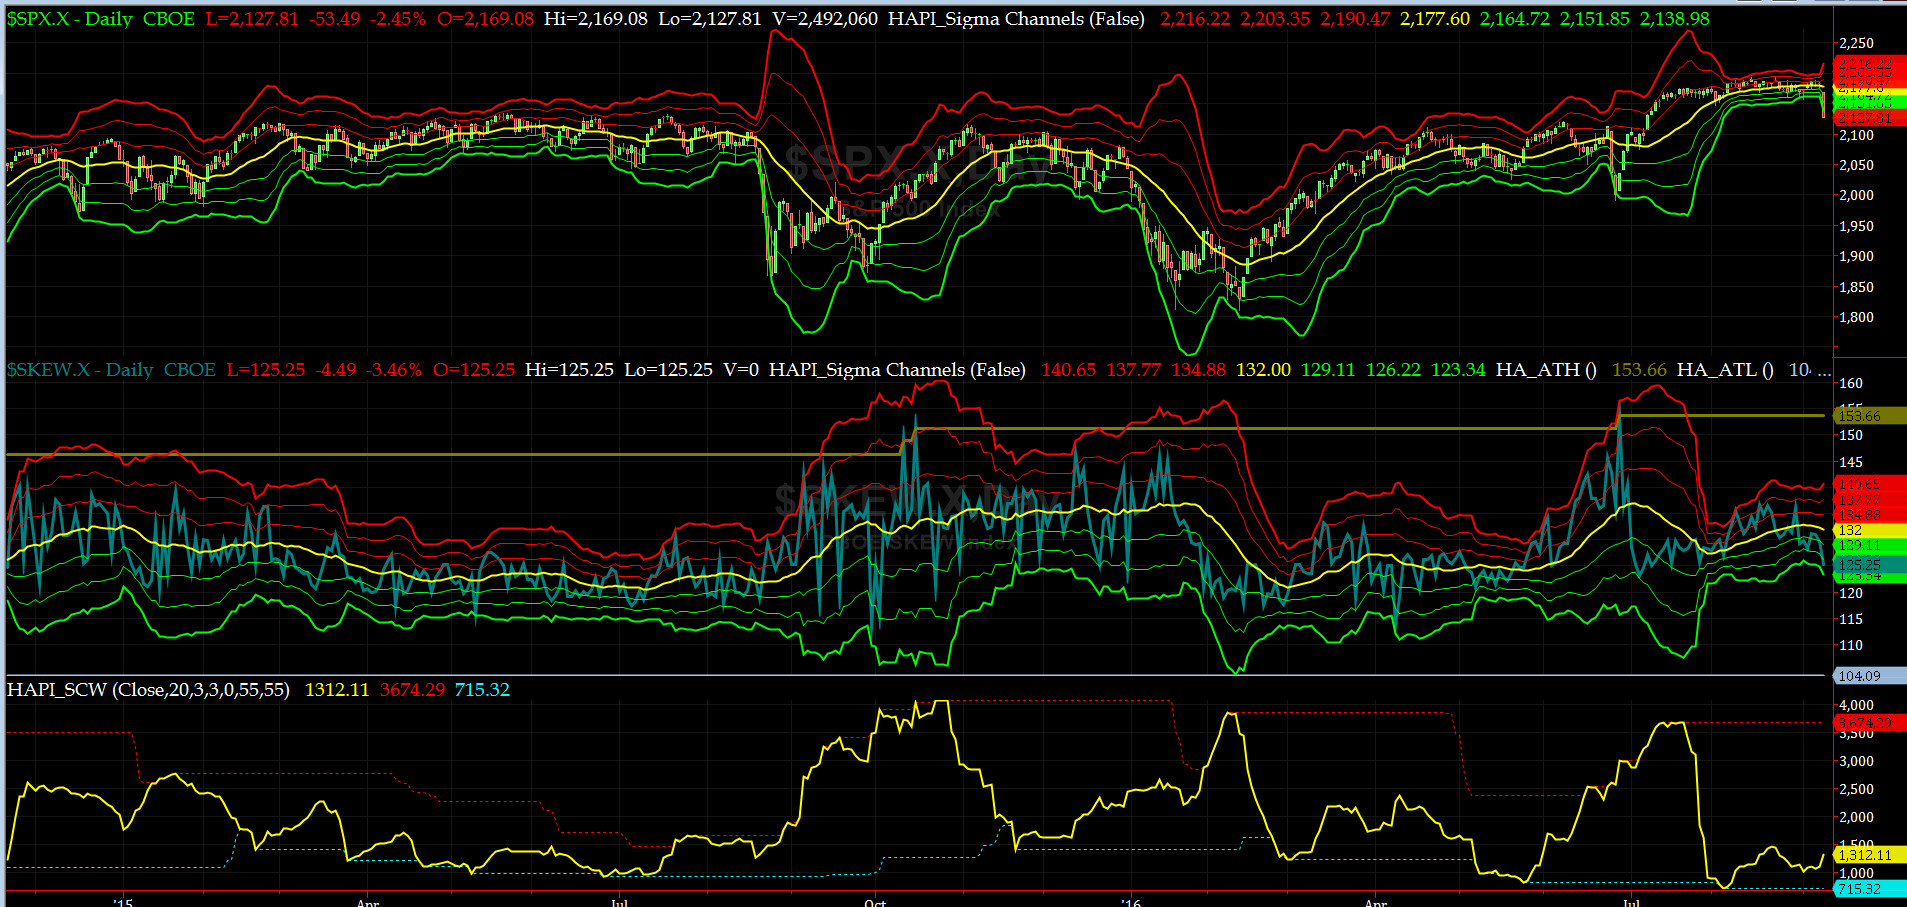
SPX SKEW (Tail Risk) Chart
SPX SKEW (Tail Risk) eased to 125 which is just below its -2 sigma (normal = 120-125, range 100-150)
All is NOT Quiet on the Mid-Western Front. Smart Money was correct in discounting near term trouble ahead (contested US General Election & [and the Bonds sell-off]?)
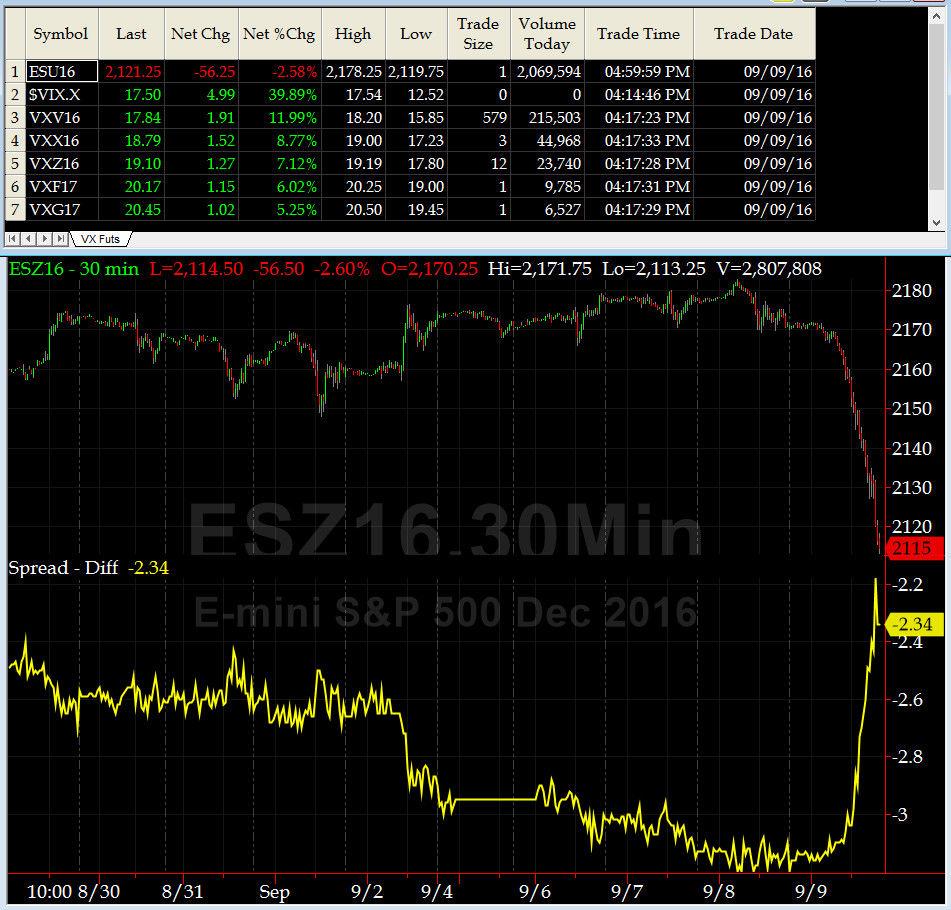
3-month VIX Futures Spread(VX) Chart
Our 3-month VIX Futures Spread (LONG OCT16 & SHORT JAN17) closed at -2.34 on Friday. Our VX spread now says the down move is in progress (most likely half way done) and needs a retest failure, most likely in the next 2 to 4 weeks.
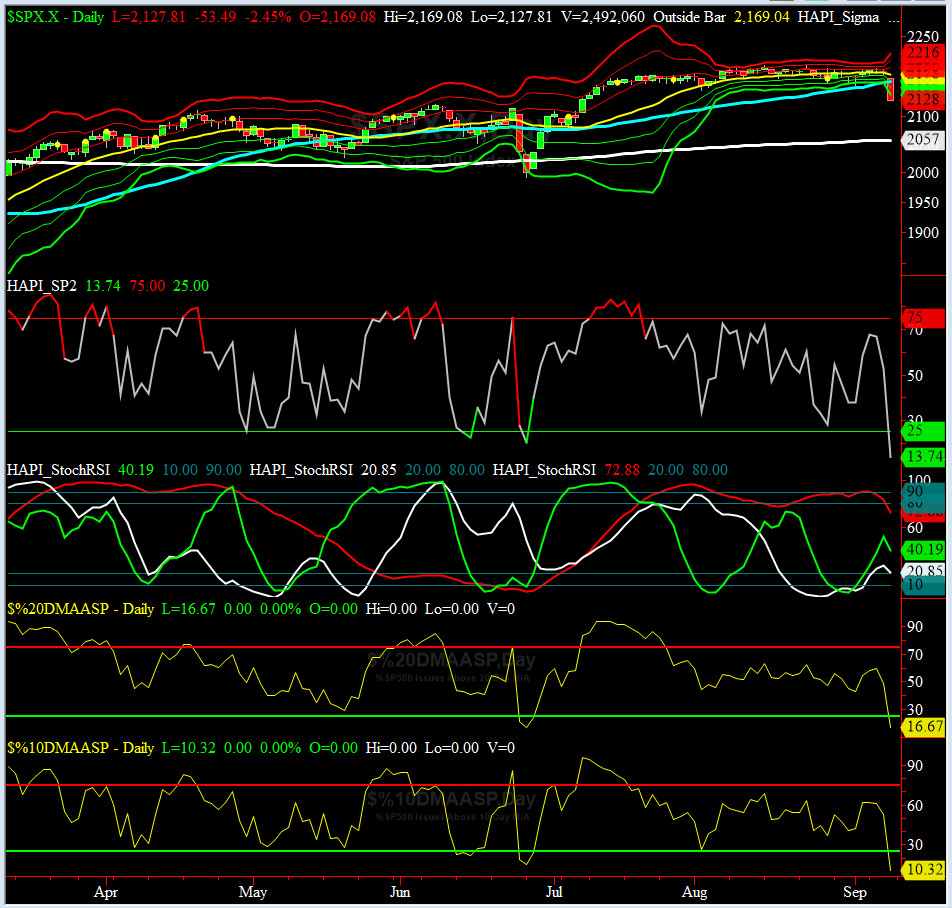
HA_SP2 Chart
HA_SP2 = 13.7 (Buy signal <= 25, Sell Signal >= 75)
This indicator says we are way oversold.
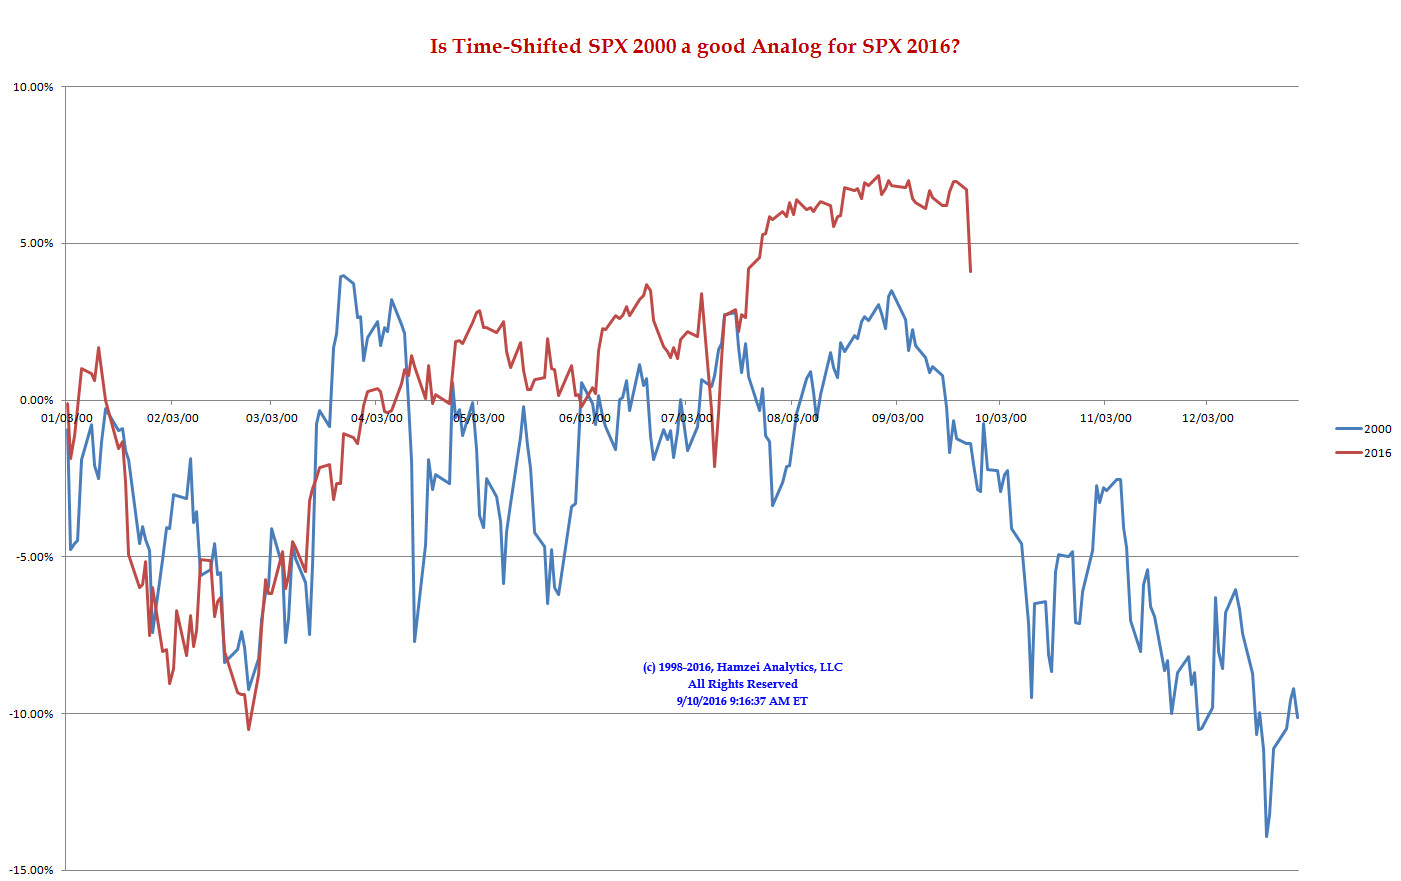
SPX 2000 Analog for SPX 2016
As Capt_Tiko warned us: This market is getting ready to Rock 'N Roll.
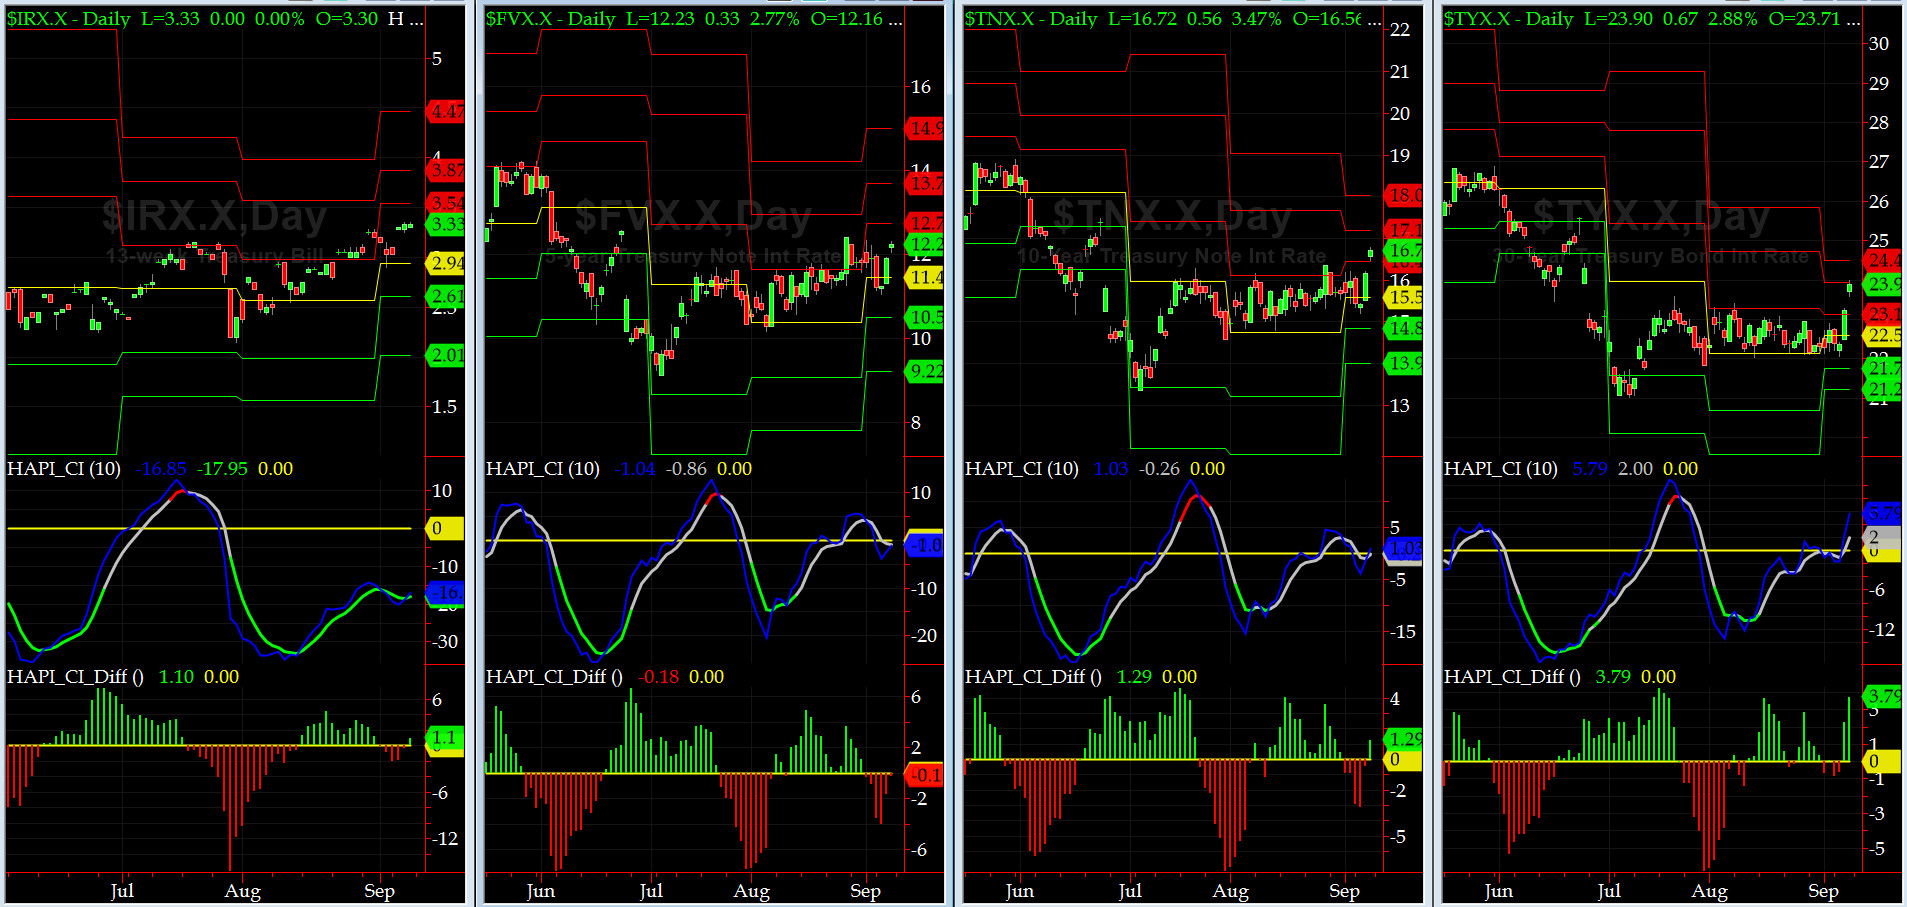
US Treasury T-Notes & T-Bonds Yields Chart
The jump in YTM for the 5-year & 10-yr T-Note, in last two trading session was simply awesome (as warned before).
Fari Hamzei
|
|
|
|
|
|
Saturday, September 10, 2016, 1220ET
Notice of Change of Market Bias with Timer Digest
Dear Jim,
What a day it was yesterday and we went from new month high (and closing only 4 handles below ATCH) on Wednesday to dropping a whopping 2.5% to 2128.
Friday�s Down Volume was 97% with Up Volume being only 3%.
Three succinct comments from my dear friend, Jason Geopfert, of www.SentimenTrader.com is worth noting here:
A) �The S&P 500 managed to last more than 50 days without a 1% decline and that ended in a big way on Friday.
B) Friday was only the 3rd time in history that the S&P wiped away two months worth of gains the day after being within 1% of a multi-year high.
C) The S&P suffered its worst drop in two months on a September Friday. Since 1928, that led to follow-through selling on Monday 5 out of 6 times.�
Our short-term Advance/Decline and Price momo indicators are also in the toilet. This normally leads to a short-term dead-cat bounce before the melt-down resumes.
Therefore,
We are getting LONG SPX at 2127.81 after booking over 43 handles from our Aug 1st SHORT SPX Signal.
This is a very short-term signal. Expected life = 1 week.
Cheers��
Fari Hamzei
|
|
|
|
|
|
Customer Care:
|
|
|
|
|
|
|
 |
 |
|
 |
|
 |
 |
 |
HA YouTube Channel ::: HA Blog ::: Testimonials ::: Tutorials & FAQs ::: Privacy Policy
|
Trading Derivatives (Options & Futures) contains substantial risk and is not for every investor. An investor could potentially lose all or more than his/her initial investment.
Only risk capital should be used for trading and only those with sufficient risk capital should consider trading derivatives. Past performance is not
necessarily indicative of future results. Testimonials appearing on this website may not be representative of other clients or customers
and are not a guarantee of future performance or success.
|
| (c) 1998-2025, Hamzei Analytics, LLC.® All Rights Reserved. |
|
|