|
Saturday, September 24, 2016, 2230ET
Market Timing Charts, Analysis & Commentary for Issue #160
Timer Charts of S&P-500 Cash Index (SPX) + NASDAQ-100 Cash Index (NDX)
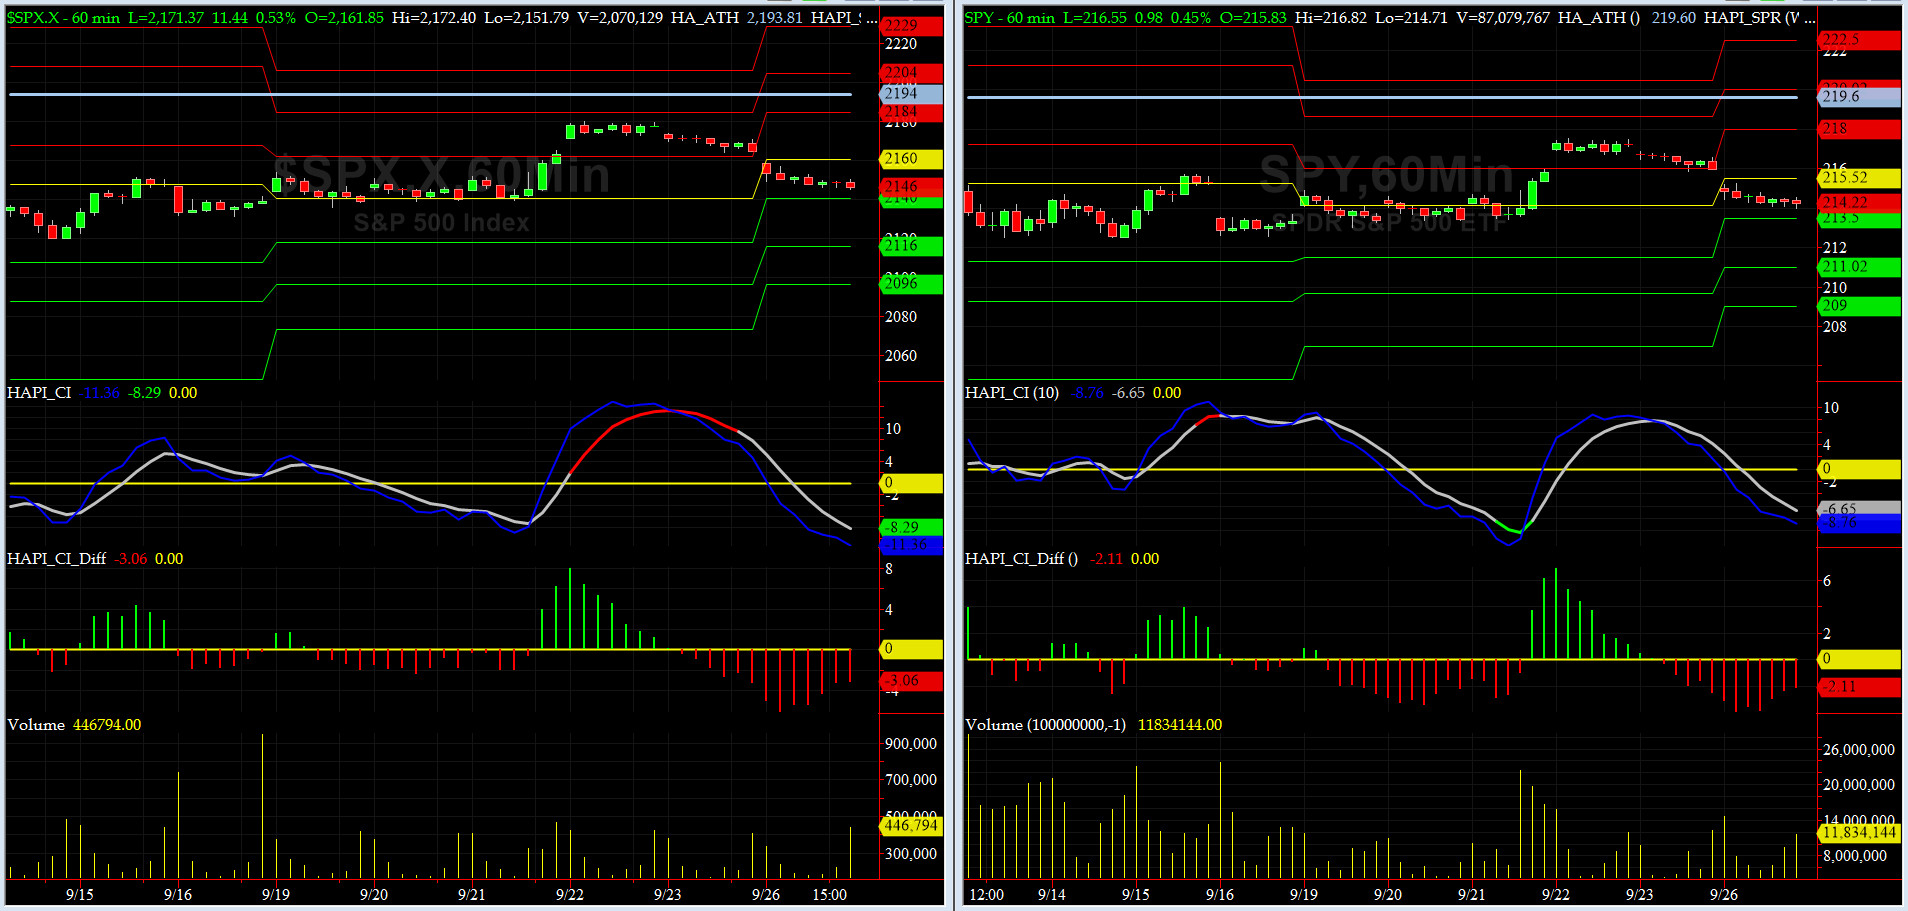
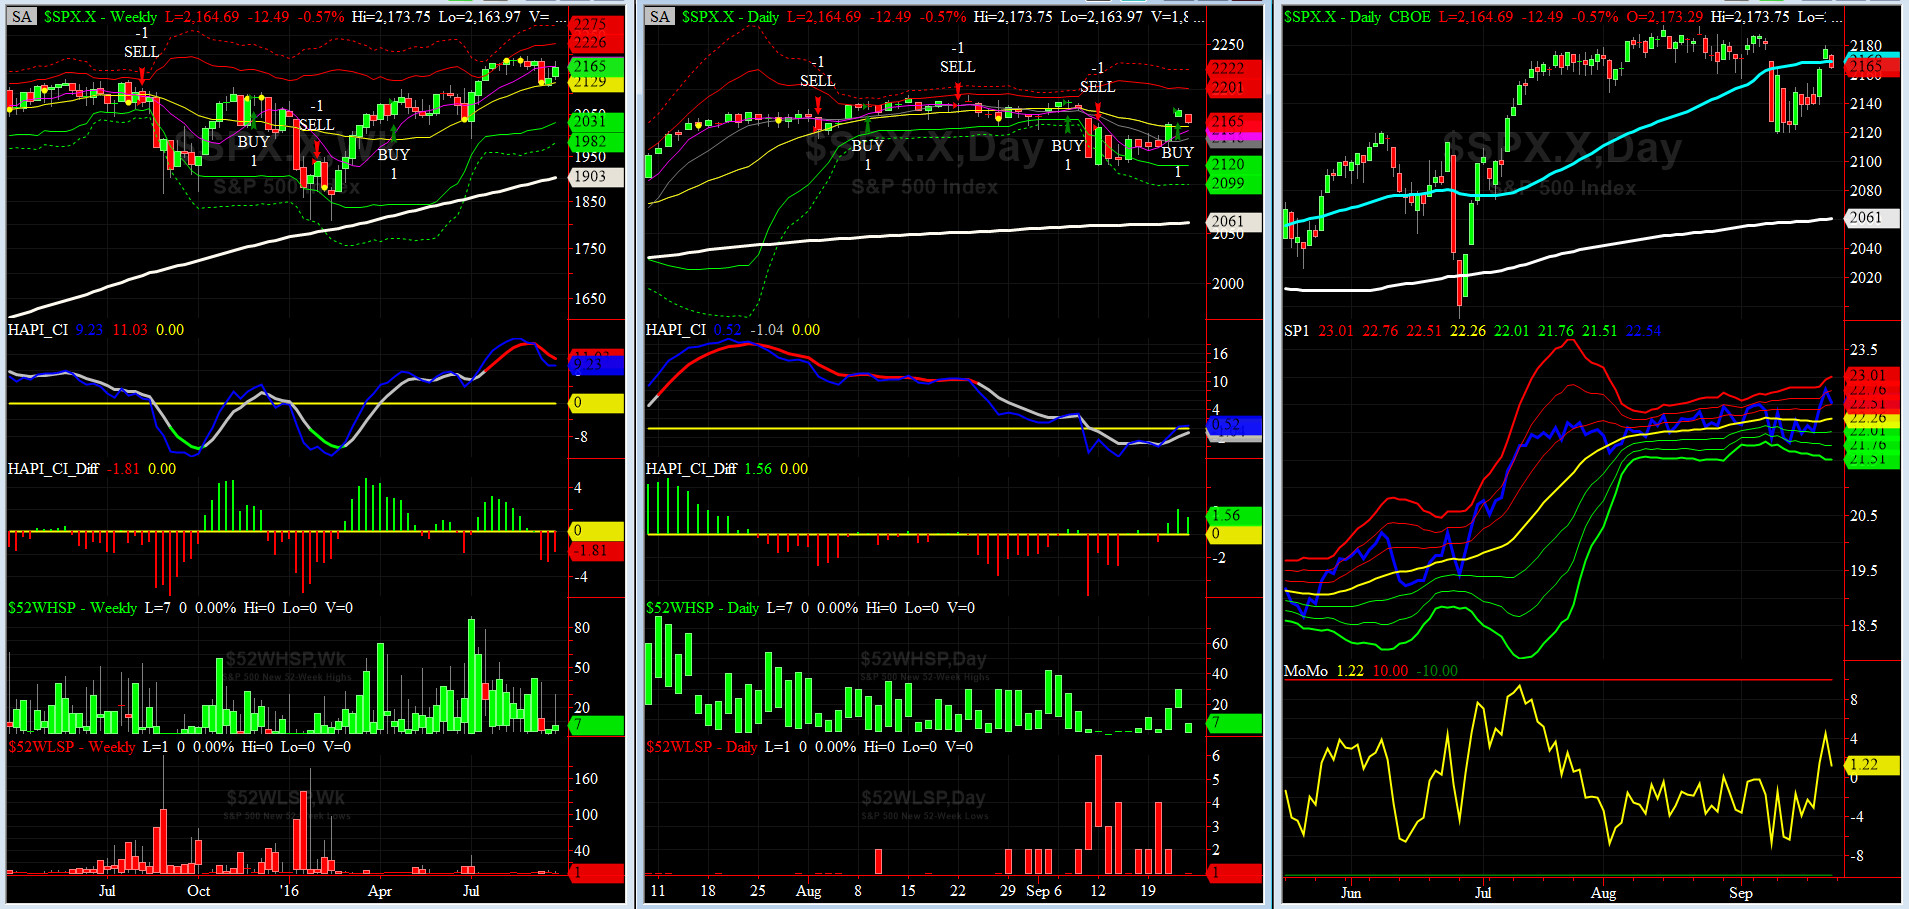
Most recent S&P-500 Cash Index (SPX): 2164.69 up +25.53 (up +1.2%) for the week ending on Friday, September 23rd, 2016, which closed above its zero sigma.
SPX ALL TIME INTRADAY HIGH = 2193.81 (reached on Monday, August 15, 2016)
SPX ALL TIME CLOSING HIGH = 2190.15 (reached on Monday, August 15, 2016)
Current DAILY +2 Sigma SPX = 2201 with WEEKLY +2 Sigma = 2226
Current DAILY 0 Sigma (20 day MA) SPX = 2161 with WEEKLY 0 Sigma = 2129
Current DAILY -2 Sigma SPX = 2120 with WEEKLY -2 Sigma = 2031
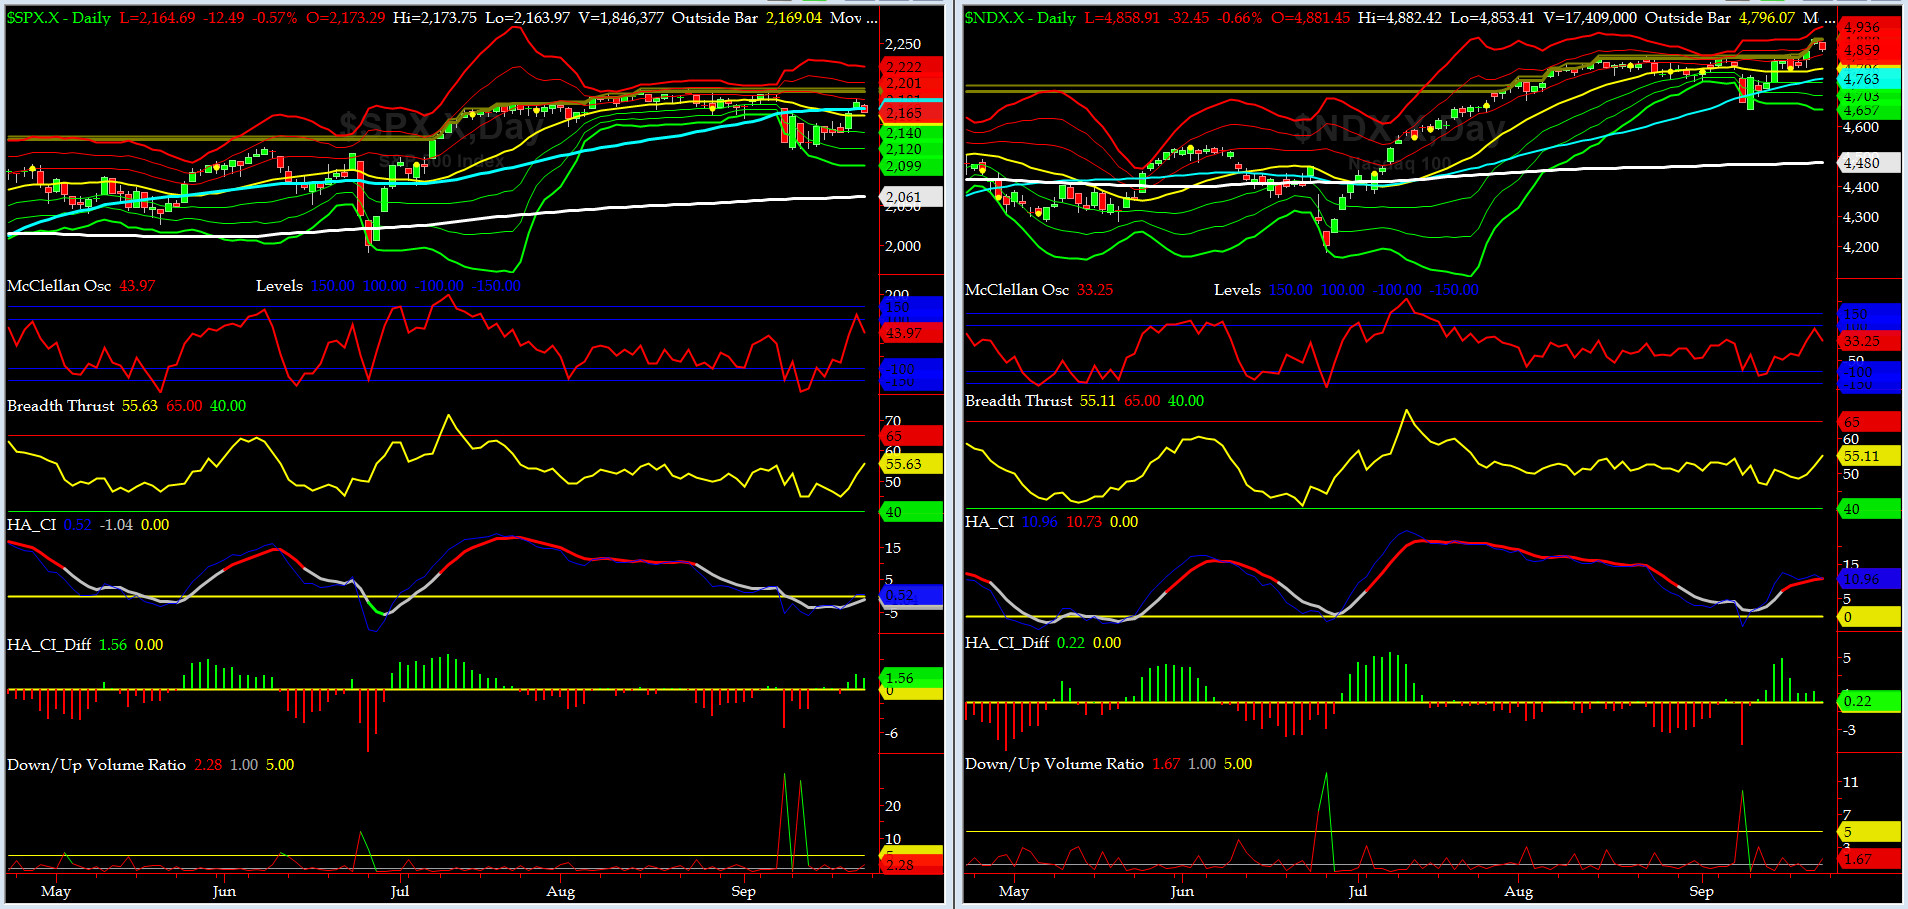
NYSE McClellan Oscillator = +44 (-150 is start of the O/S area; around -275 to -300 area or lower, we go into the �launch-pad� mode, over +150, we are in O/B area)
NYSE Breadth Thrust = 55.6(40 is considered as oversold and 65 as overbought)
On Wednesday, NDX traded at fresh new All-Time-Highs. Our fearless leader, Brad Sullivan, warned us (aboard his flight back from NYC at 40k ft) that the current price
action should be respected with follow through expected in the next few sessions. Unfortunately, late Friday, NDXs' biggest component, AAPL had a disappointing close (based on unconfirmed rumors about its iPhone7 sales).
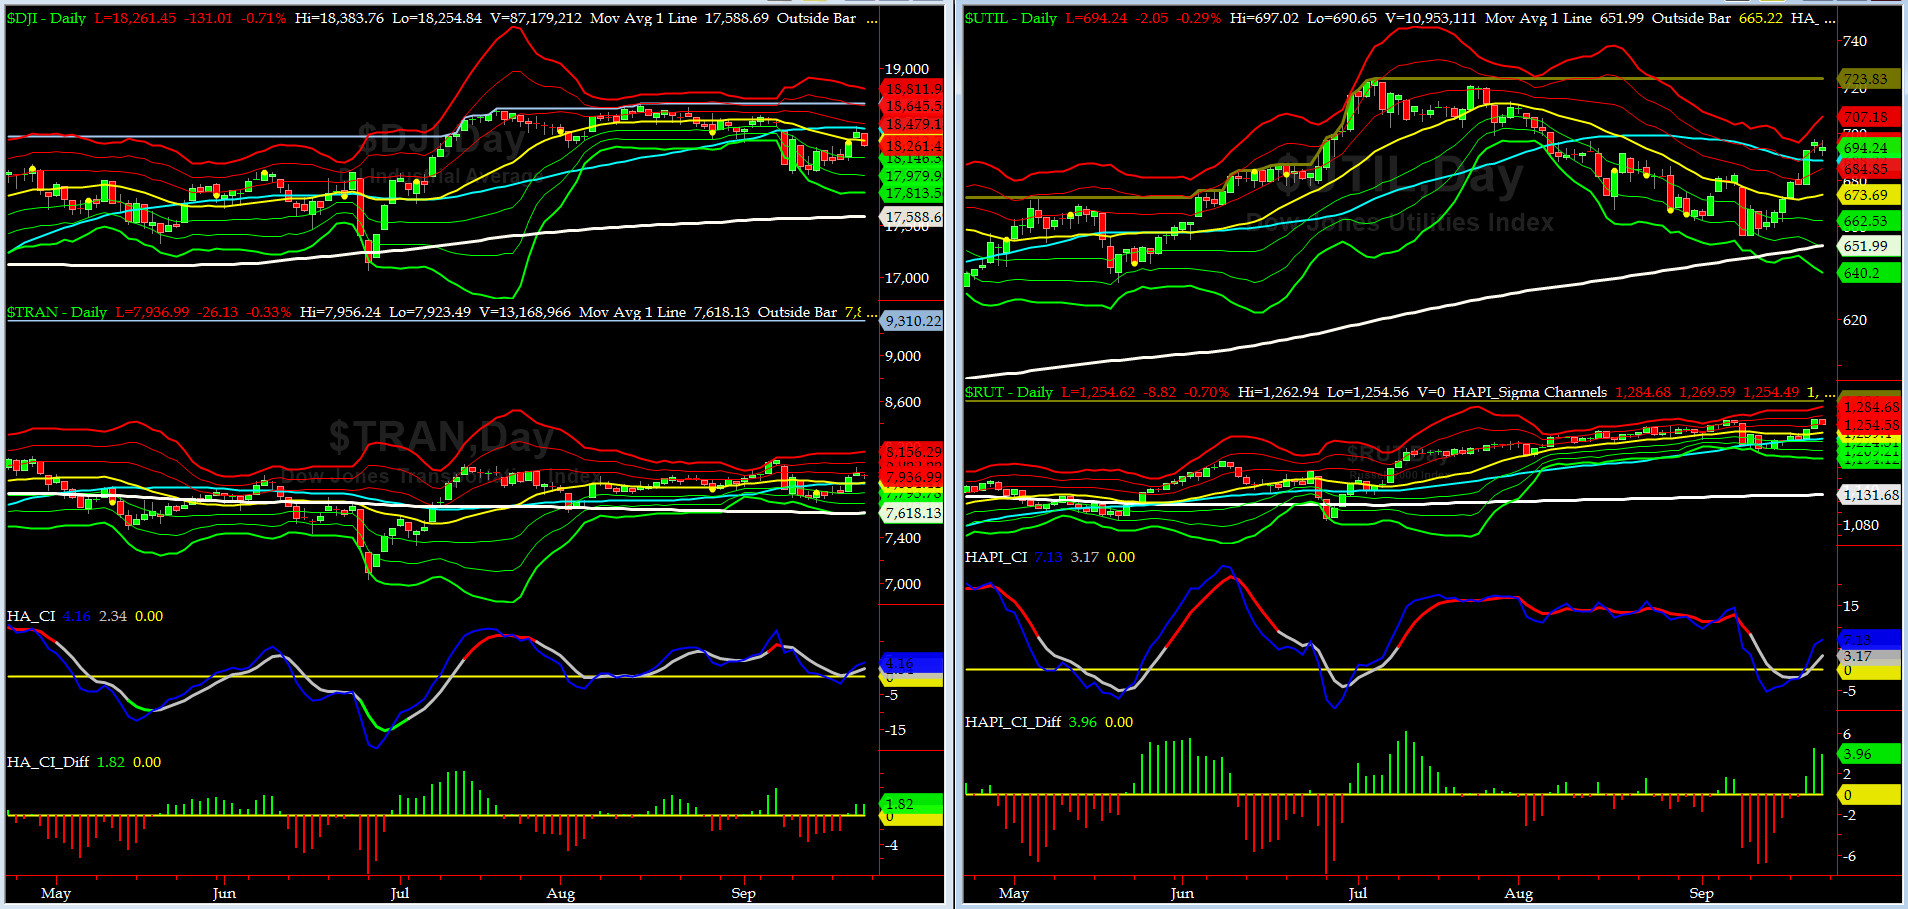
Canaries [in the Coal Mine] Chart for DJ TRAN & RUT Indices
200-Day MA DJ TRAN = 7618 or 4.2% below DJ TRAN (max observed in last 5 yrs = 20.2%, min = -20.3%)
200-Day MA RUT = 1131 or 10.9% below RUT (max observed in last 5 yrs = 21.3%, min = -22.6%)
DJ Transports (proxy for economic conditions 6 to 9 months hence) had a mixed week other than on Wednesday (FOMC).
Russell 2000 Small Caps (proxy for RISK ON/OFF) had a huge rally thanks to AuntieJanet.... RISK is ON.
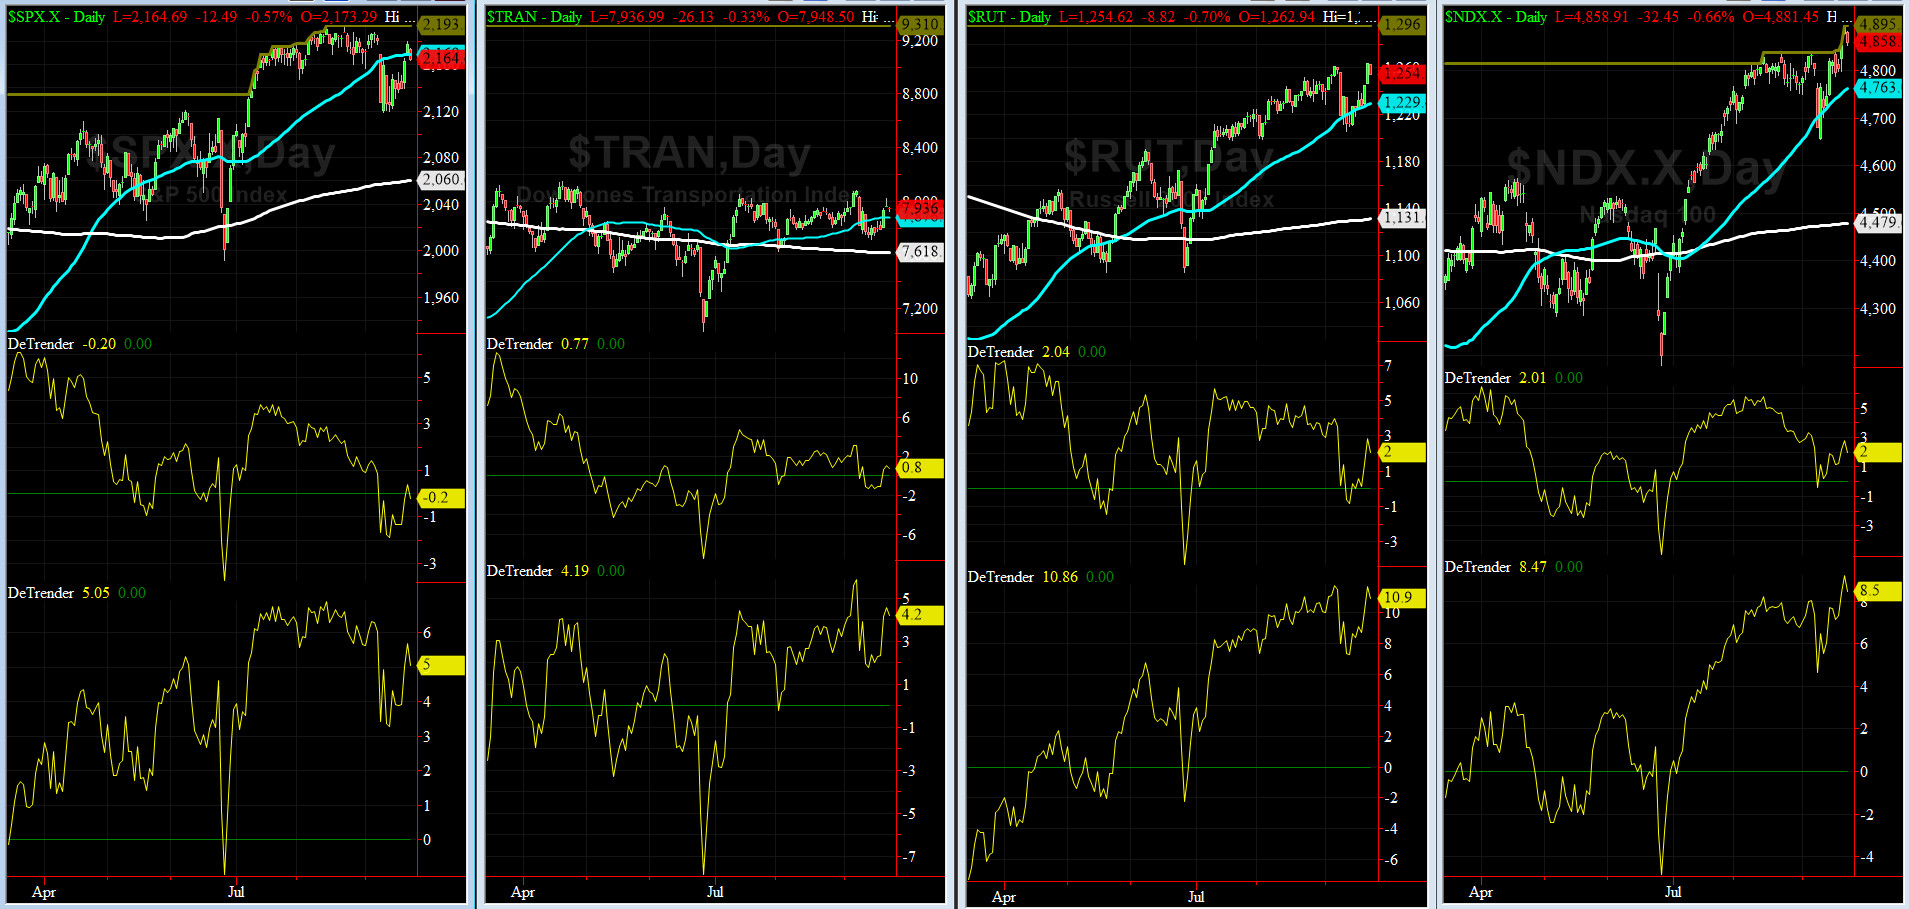
DeTrenders Charts for SPX, NDX, TRAN & RUT Indices
50-Day MA SPX = 2168 or 1.3% above SPX (max observed in last 5 yrs = +8.6%, min = -9.3%)
200-Day MA SPX = 2058 or 3.9% below SPX (max observed in last 5 yrs = 15.2%, min = -14%)
Currently, only 1 of our 8 DeTrenders is negative. And as in recent past, the DeTrenders for TRAN & RUT continue to remain on our radar as we monitor their price action with caution.
HA_SP1_Momo Chart
WEEKLY Timing Model = on a BUY Signal since Friday 4/15/16 CLOSE at 2081
DAILY Timing Model = on a BUY Signal since Thursday 9/22/16 CLOSE at 2177
Max SPX 52wk-highs reading last week = 30 (over 120-140, the local maxima is in)
Max SPX 52wk-Lows reading last week = 4 (over 40-60, the local minima is in)
HA_SP1 = just above its +1 sigma channels
HA_Momo = +1.22 (reversals most likely occur above +10 or below -10)
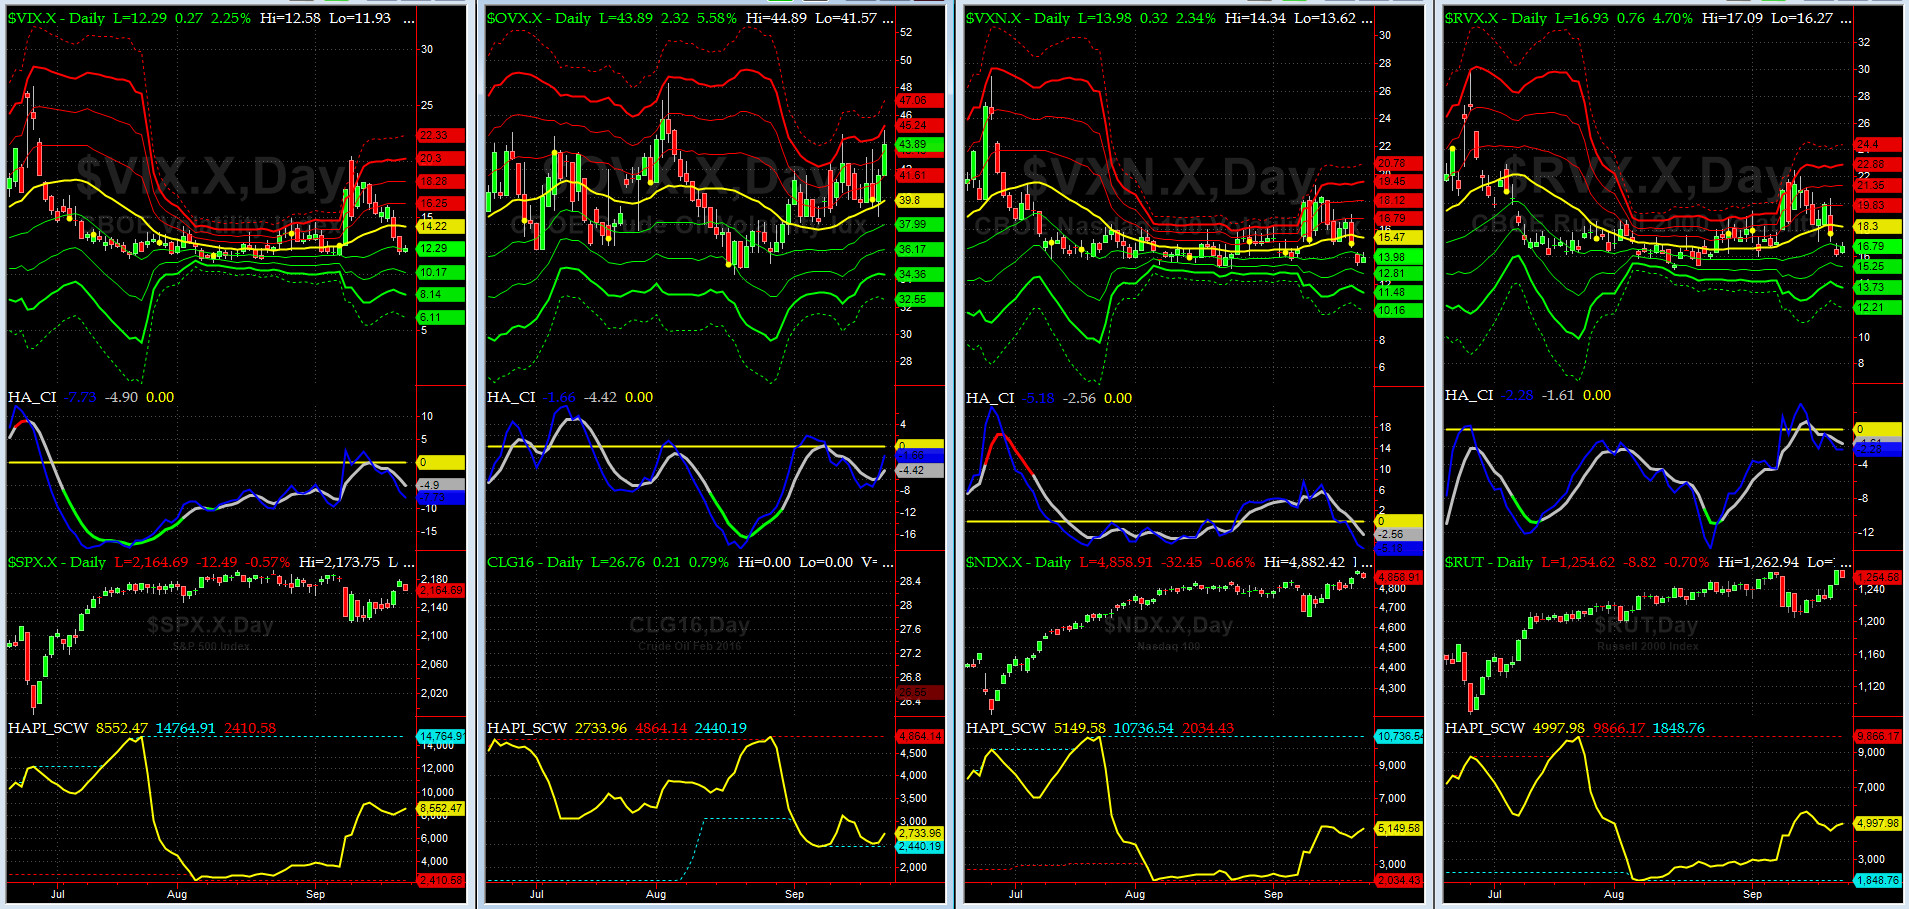
Vol of the Vols Chart
VIX = 12.3 is almost at its +0.5 sigma (remember it�s the VIX�s vol pattern (its sigma channels) that matters, and not the level of VIX itself (this is per Dr. Robert Whaley, a great mentor and the inventor of original VIX, now called VXO). VIX usually peaks around a test of its +4 sigma).
The current shockwave is OVER.
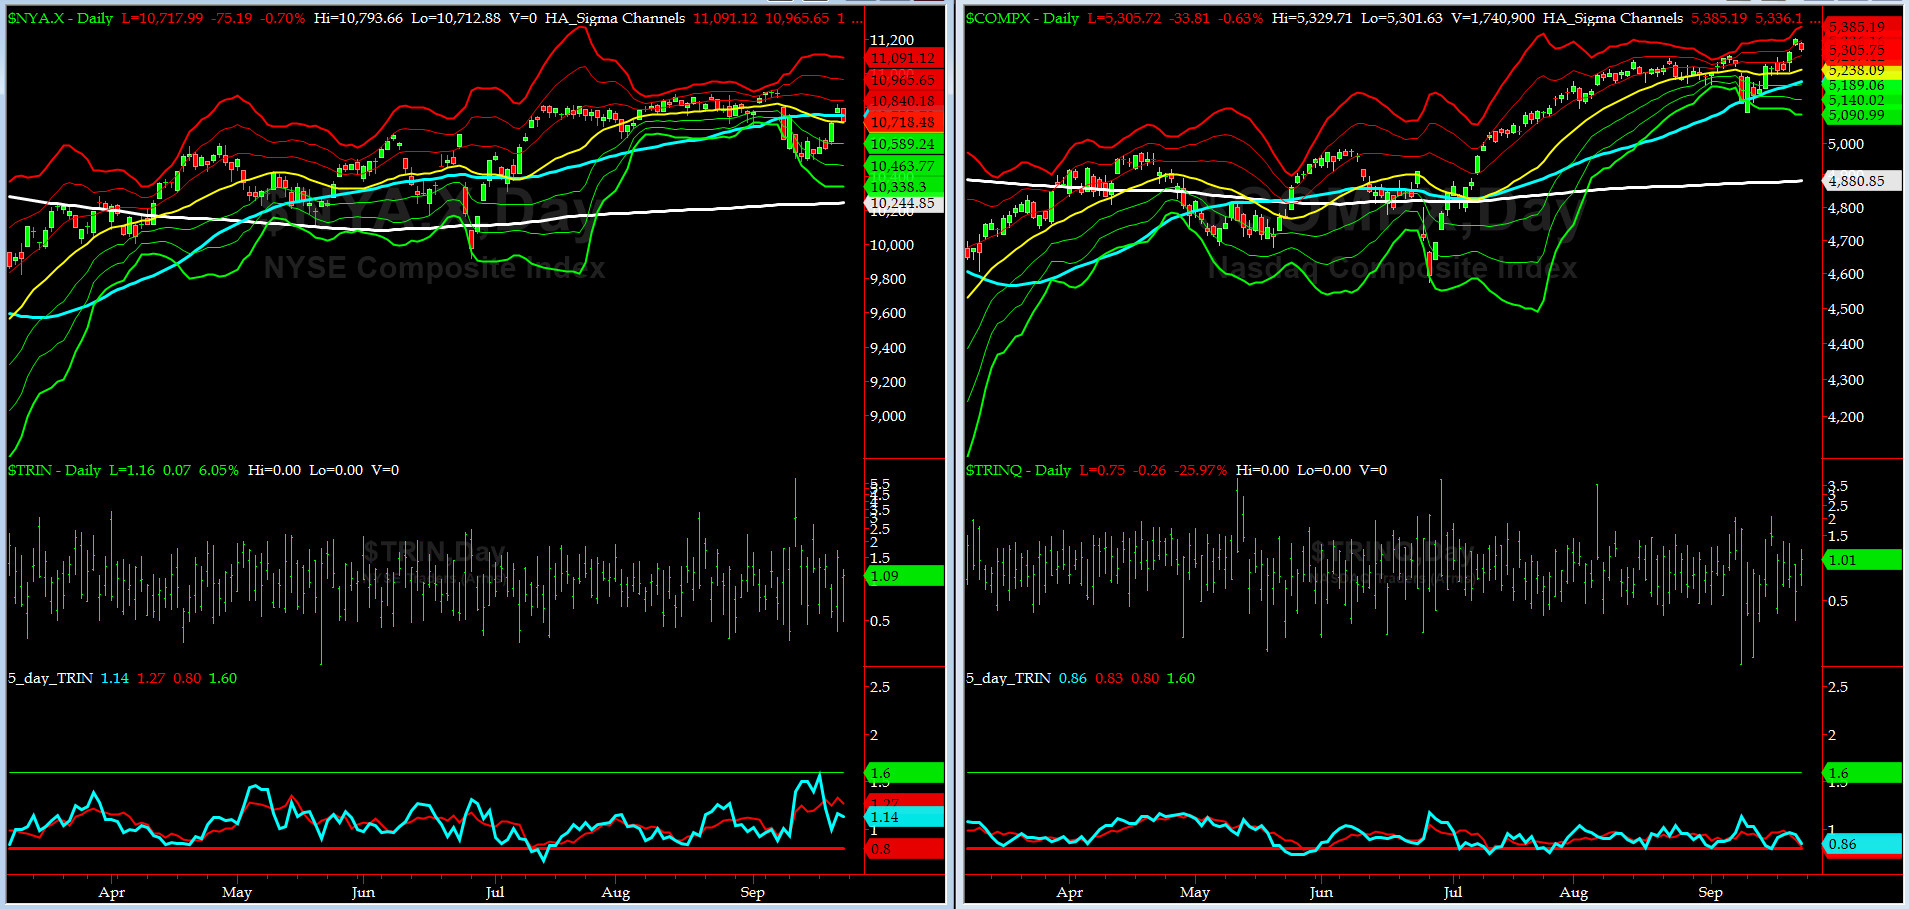
5-day TRIN & TRINQ Charts
NYSE 5-day TRIN BUY Signal was very nice... covered the soup money and then some.... only in America.

Components of SPX above their respective 200day MA Chart
This scoring indicator rose up to 77% but failed to get over its 50day bar. We expect that next move is to test the 60%-65% area.

SPX SKEW (Tail Risk) Chart
SPX SKEW (Tail Risk) settled at 125 which is about its -1 sigma (normal = 120-125, range 100-150)
All is getting Quieter on the Mid-Western Front. What will Smart Money bet on next? Contested General Election in all battleground states?
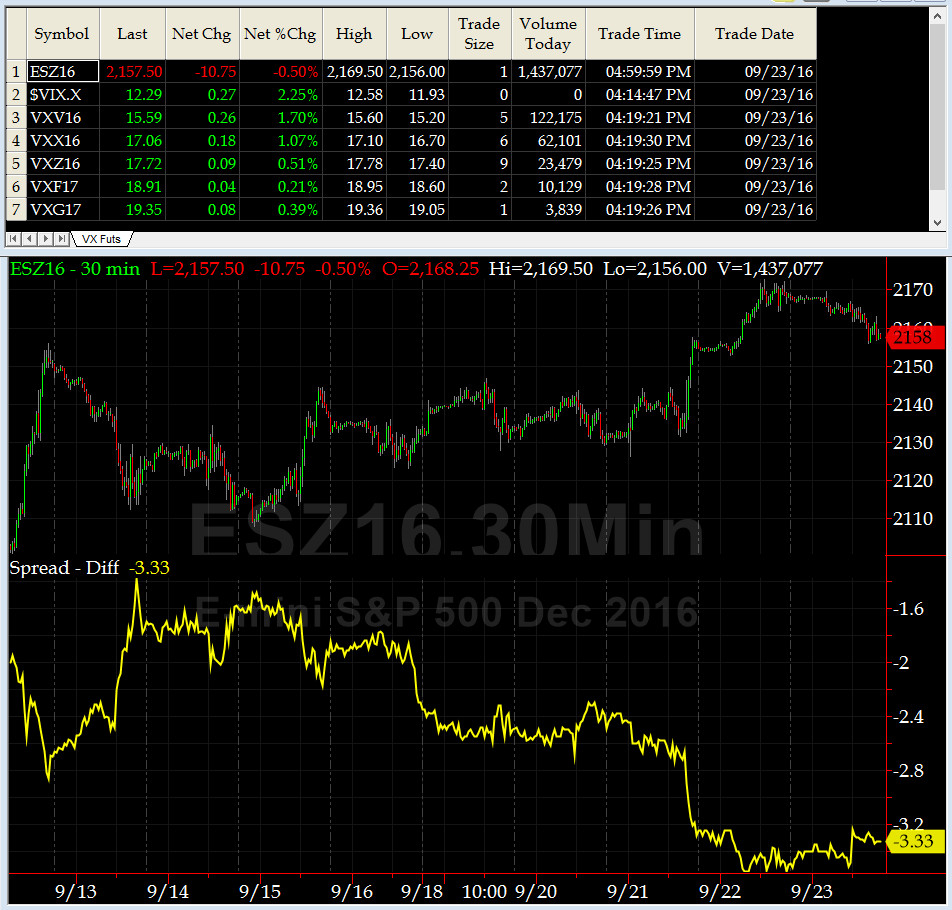
3-month VIX Futures Spread(VX) Chart
Our 3-month VIX Futures Spread (LONG OCT16 & SHORT JAN17) closed at -3.33 on Friday. No clear signal here. My XO, @Capt_Tiko, now recommending more iced tea for all sailors.
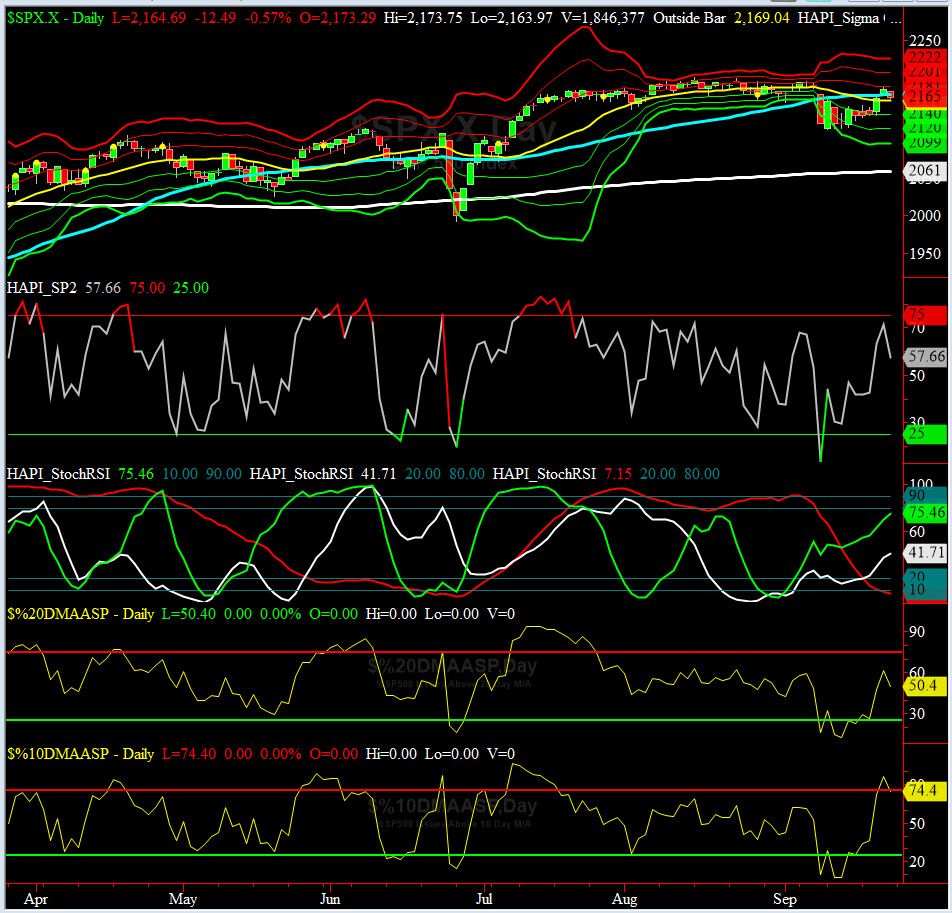
HA_SP2 Chart
HA_SP2 = 57 (Buy signal <= 25, Sell Signal >= 75)
This indicator is neutral again after pulling back from 71.4 on Thursday.
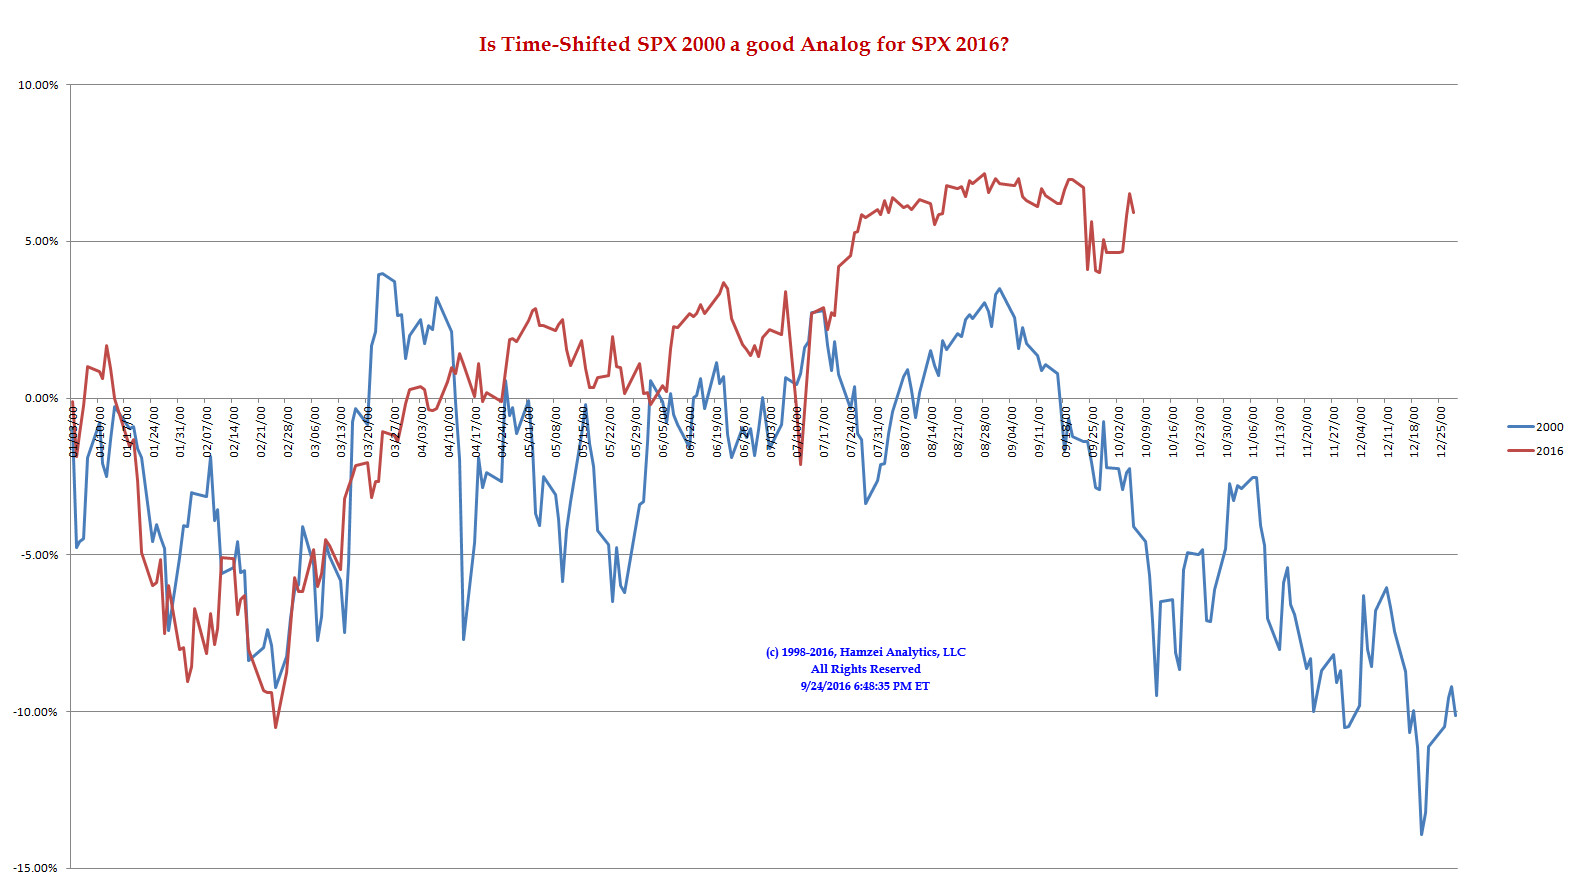
SPX 2000 Analog for SPX 2016
The $64K question from our beloved @Capt_Tiko still remains unanswered: When will the other shoe drop?
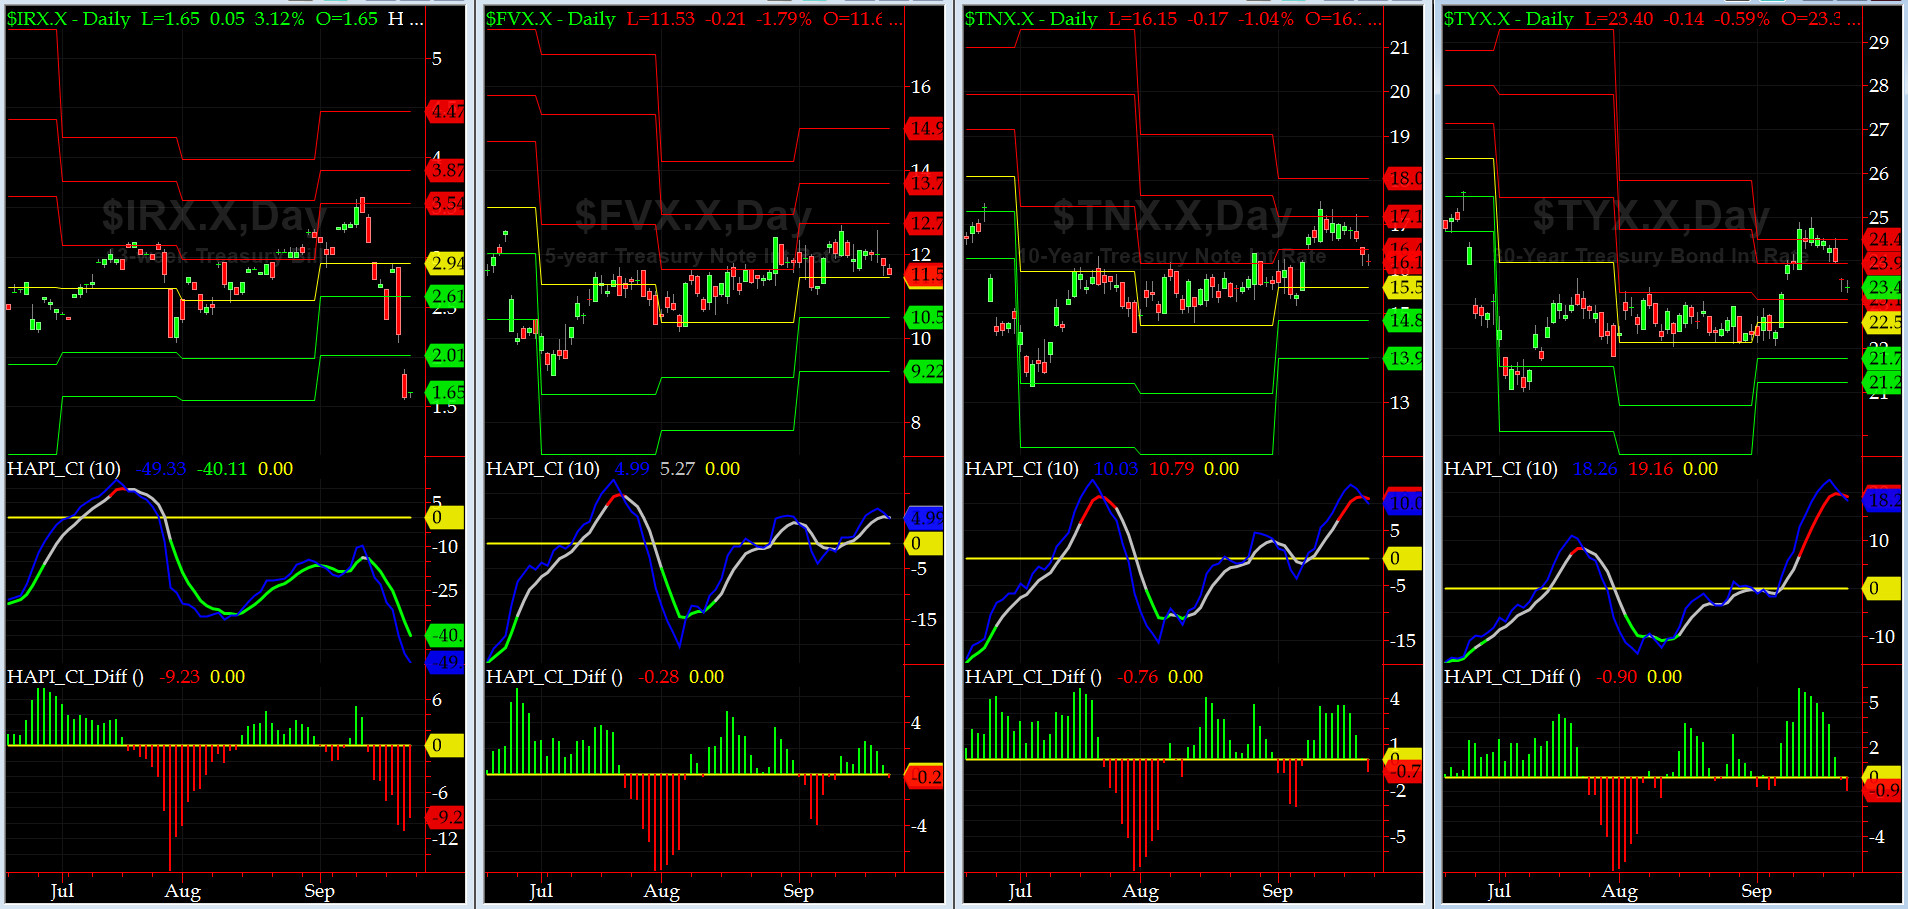
US Treasury T-Notes & T-Bonds Yields Chart
The drop in 91-day discount rate continues to impress us beyond belief, rest of the yield curve was fairly docile.
Fari Hamzei
|


 Proactive Market Timing