|
Saturday, October 1, 2016, 2330ET
Market Timing Charts, Analysis & Commentary for Issue #161
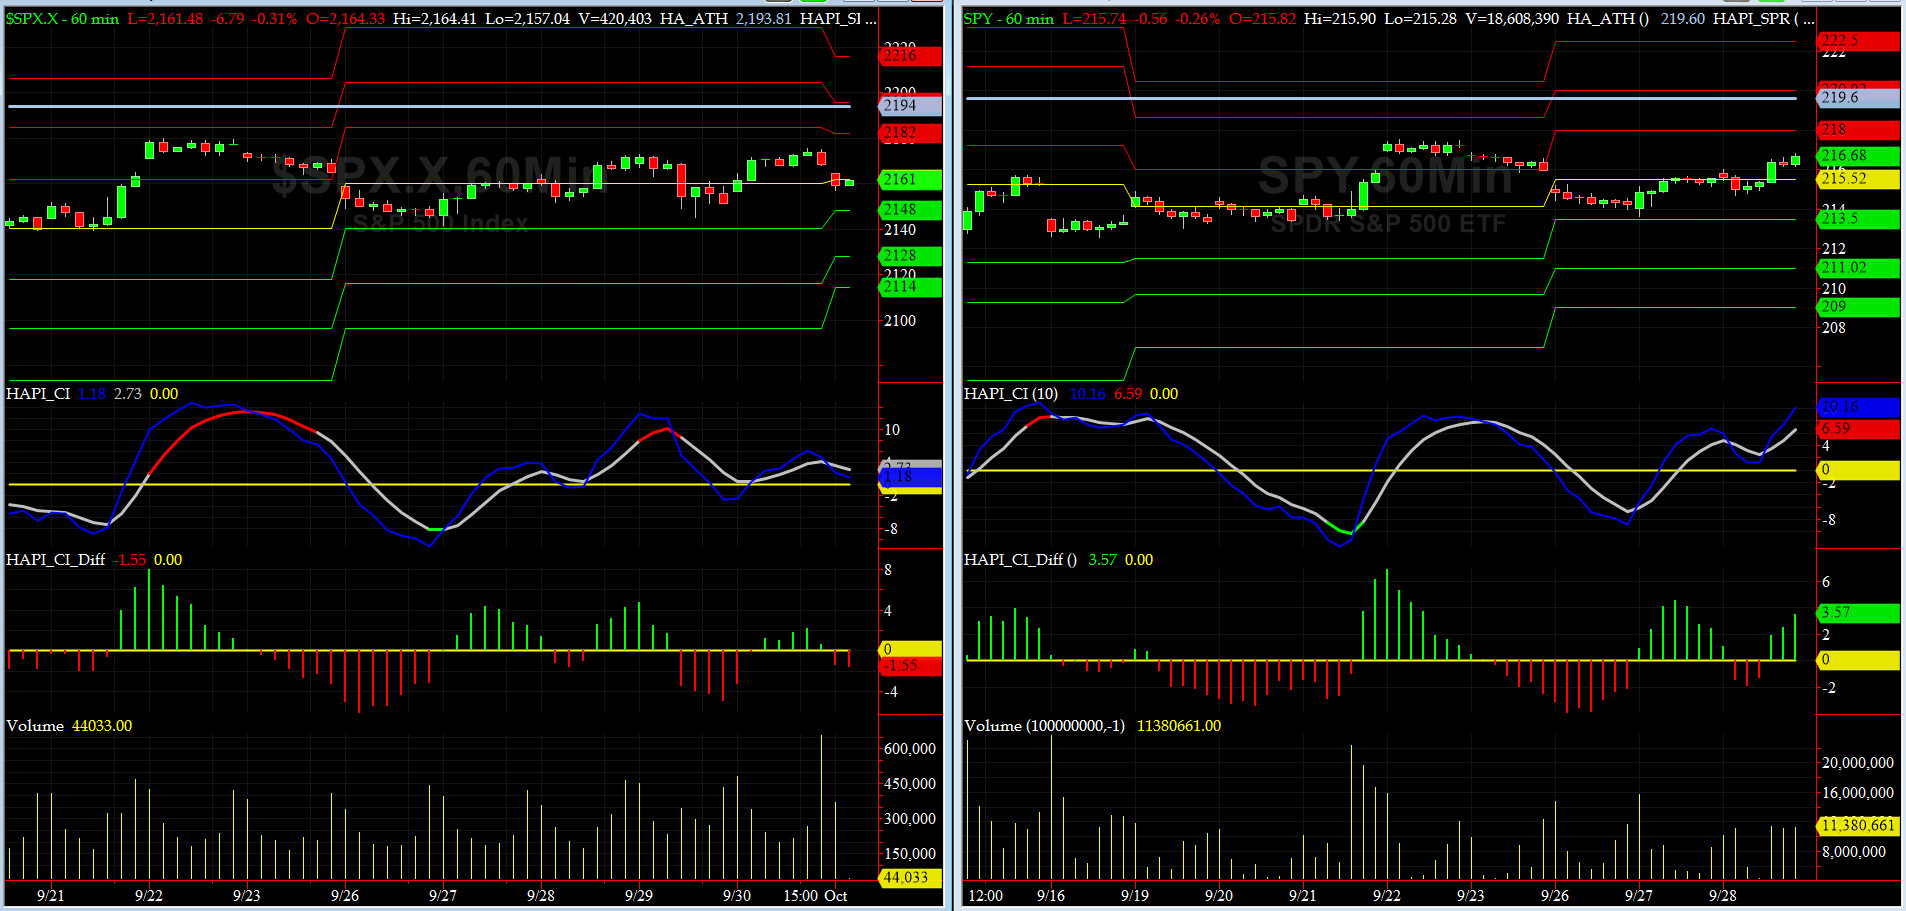
Timer Charts of S&P-500 Cash Index (SPX) + NASDAQ-100 Cash Index (NDX)
Most recent S&P-500 Cash Index (SPX): 2168.27 up +3.58 (up +0.17%) for the week ending on Friday, September 30th, 2016, which closed above its 50-day bar.
SPX ALL TIME INTRADAY HIGH = 2193.81 (reached on Monday, August 15, 2016)
SPX ALL TIME CLOSING HIGH = 2190.15 (reached on Monday, August 15, 2016)
Current DAILY +2 Sigma SPX = 2196 with WEEKLY +2 Sigma = 2226
Current DAILY 0 Sigma (20 day MA) SPX = 2157 with WEEKLY 0 Sigma = 2135
Current DAILY -2 Sigma SPX = 2118 with WEEKLY -2 Sigma = 2044
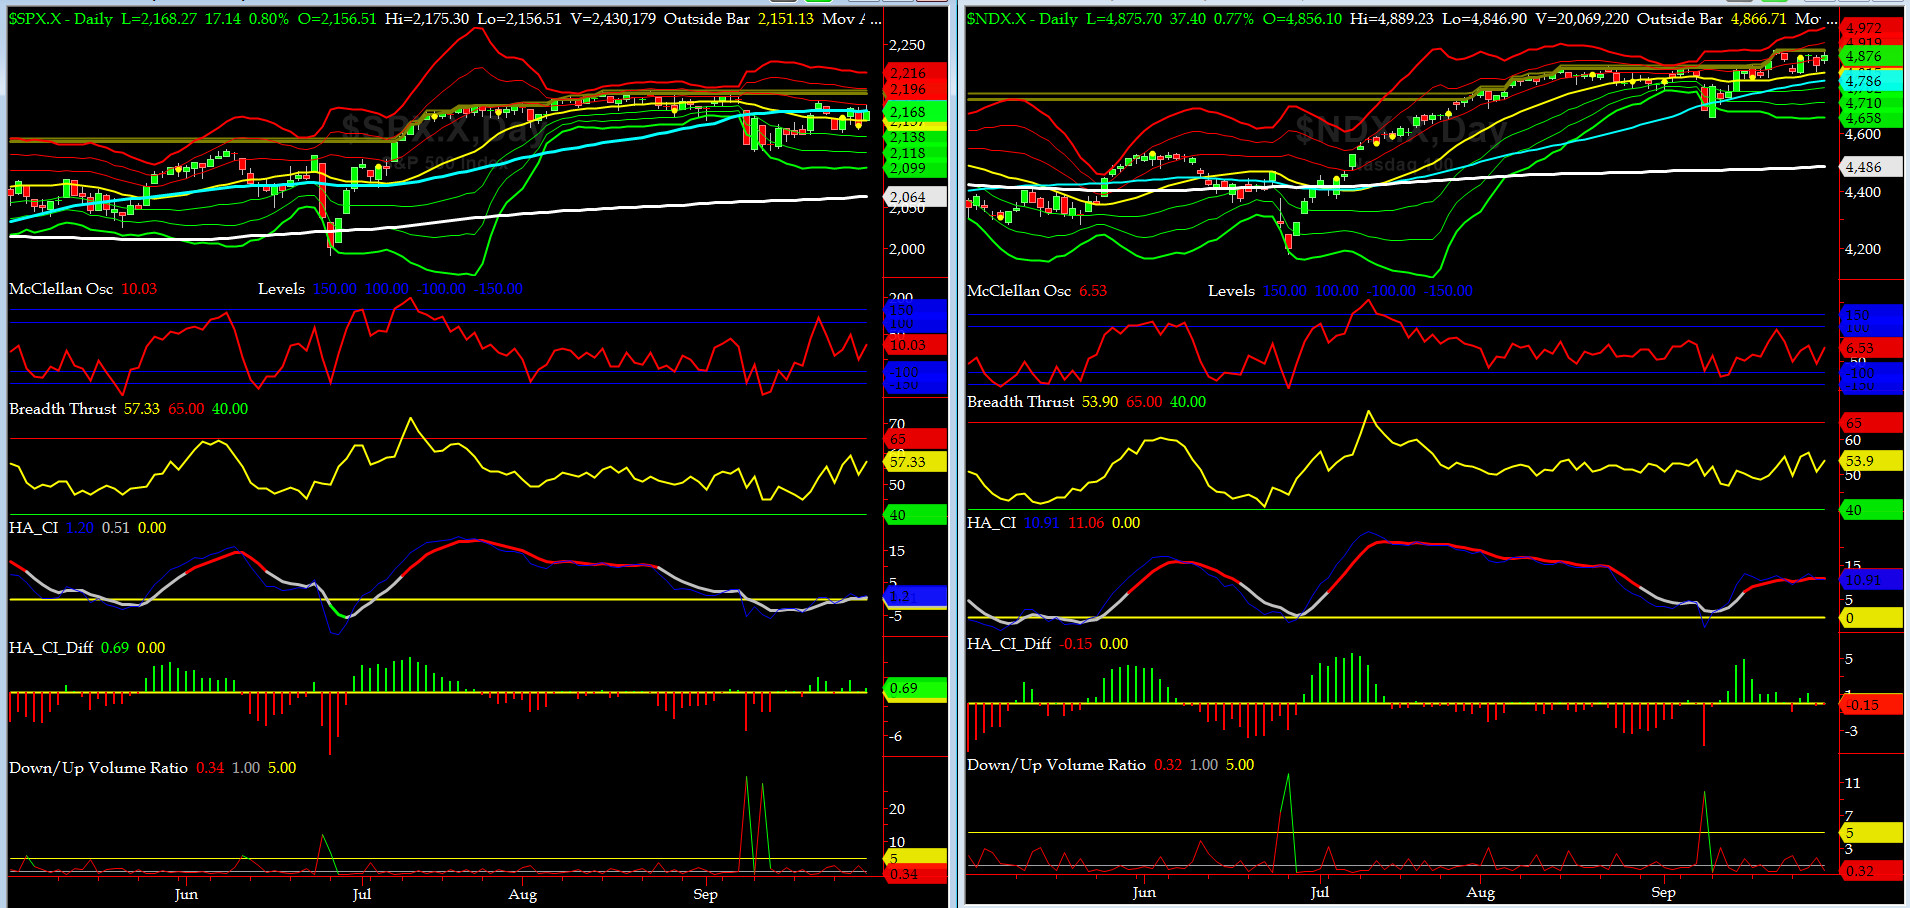
NYSE McClellan Oscillator = +10 (-150 is start of the O/S area; around -275 to -300 area or lower, we go into the �launch-pad� mode, over +150, we are in O/B area)
NYSE Breadth Thrust = 57.3(40 is considered as oversold and 65 as overbought)
Trading this past week was very challenging compared to previous weeks. After aggressive selloffs on Friday Sept 23rd and Monday Sept 25th, the Jumbo Sausage Ops took over. Further gyrations were fueled by rumors and leaks of Known Unknowns on both side of the spectrum. The demise of Deutsche Bank was front and center coupled with the start of long-term pressure on USD due to Chinese Renminbi beginning to trade at 10.9% of SDR Basket at IMF (as the new Global Reserve Currency) starting today.
And do not forget: �Sell on Rosh Hashanah and Buy on Yom Kippur,� a favorite of Art Cashin, Director of NYSE Floor Operations for UBS.
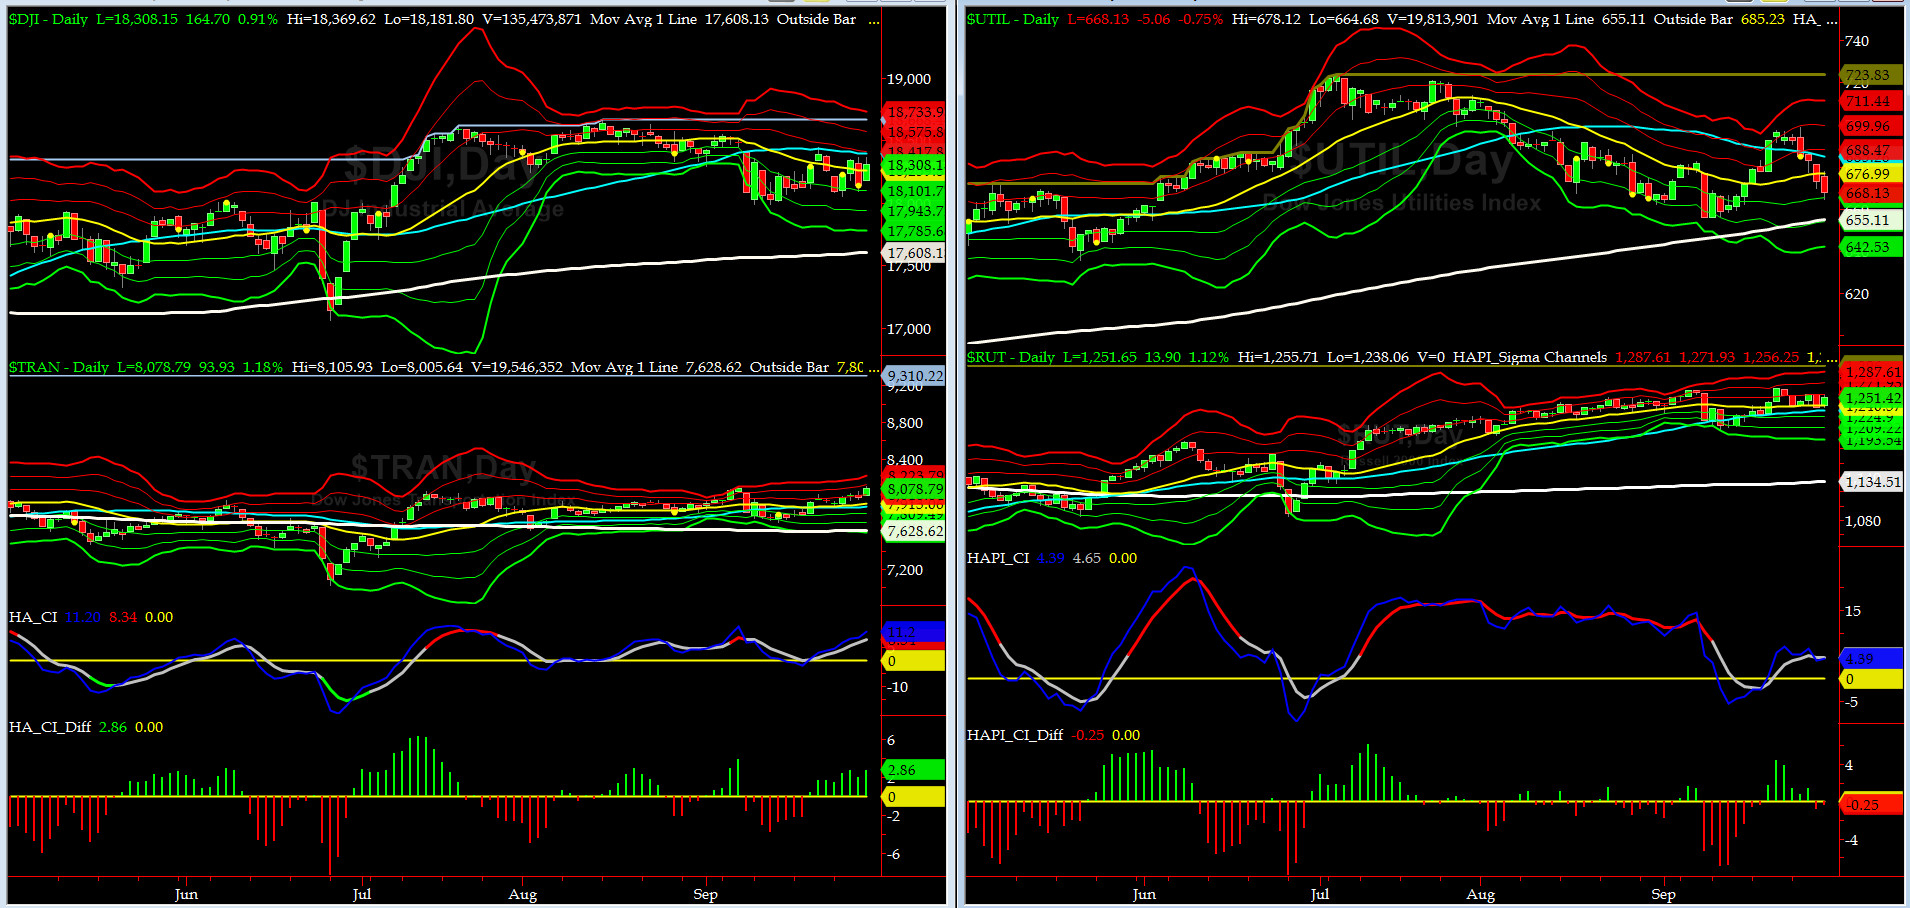
Canaries [in the Coal Mine] Chart for DJ TRAN & RUT Indices
200-Day MA DJ TRAN = 7618 or 5.9% below DJ TRAN (max observed in last 5 yrs = 20.2%, min = -20.3%)
200-Day MA RUT = 1134 or 10.3% below RUT (max observed in last 5 yrs = 21.3%, min = -22.6%)
DJ Transports (proxy for economic conditions 6 to 9 months hence) had a nice rally neared its +2 sigma. This most likely will continue given a chartpattern but keep in mind DJ TRAN is about 13% below its All-Time-High while SPX is only less than 1% below its ATH. Over-all economy, 6 to 9 month hence, does not look as promising as you & I think, @Capt_Tiko reminds us.
Russell 2000 Small Caps (proxy for RISK ON/OFF) went nowhere fast and close just above its zero sigma.... RISK is CONFUSED here.
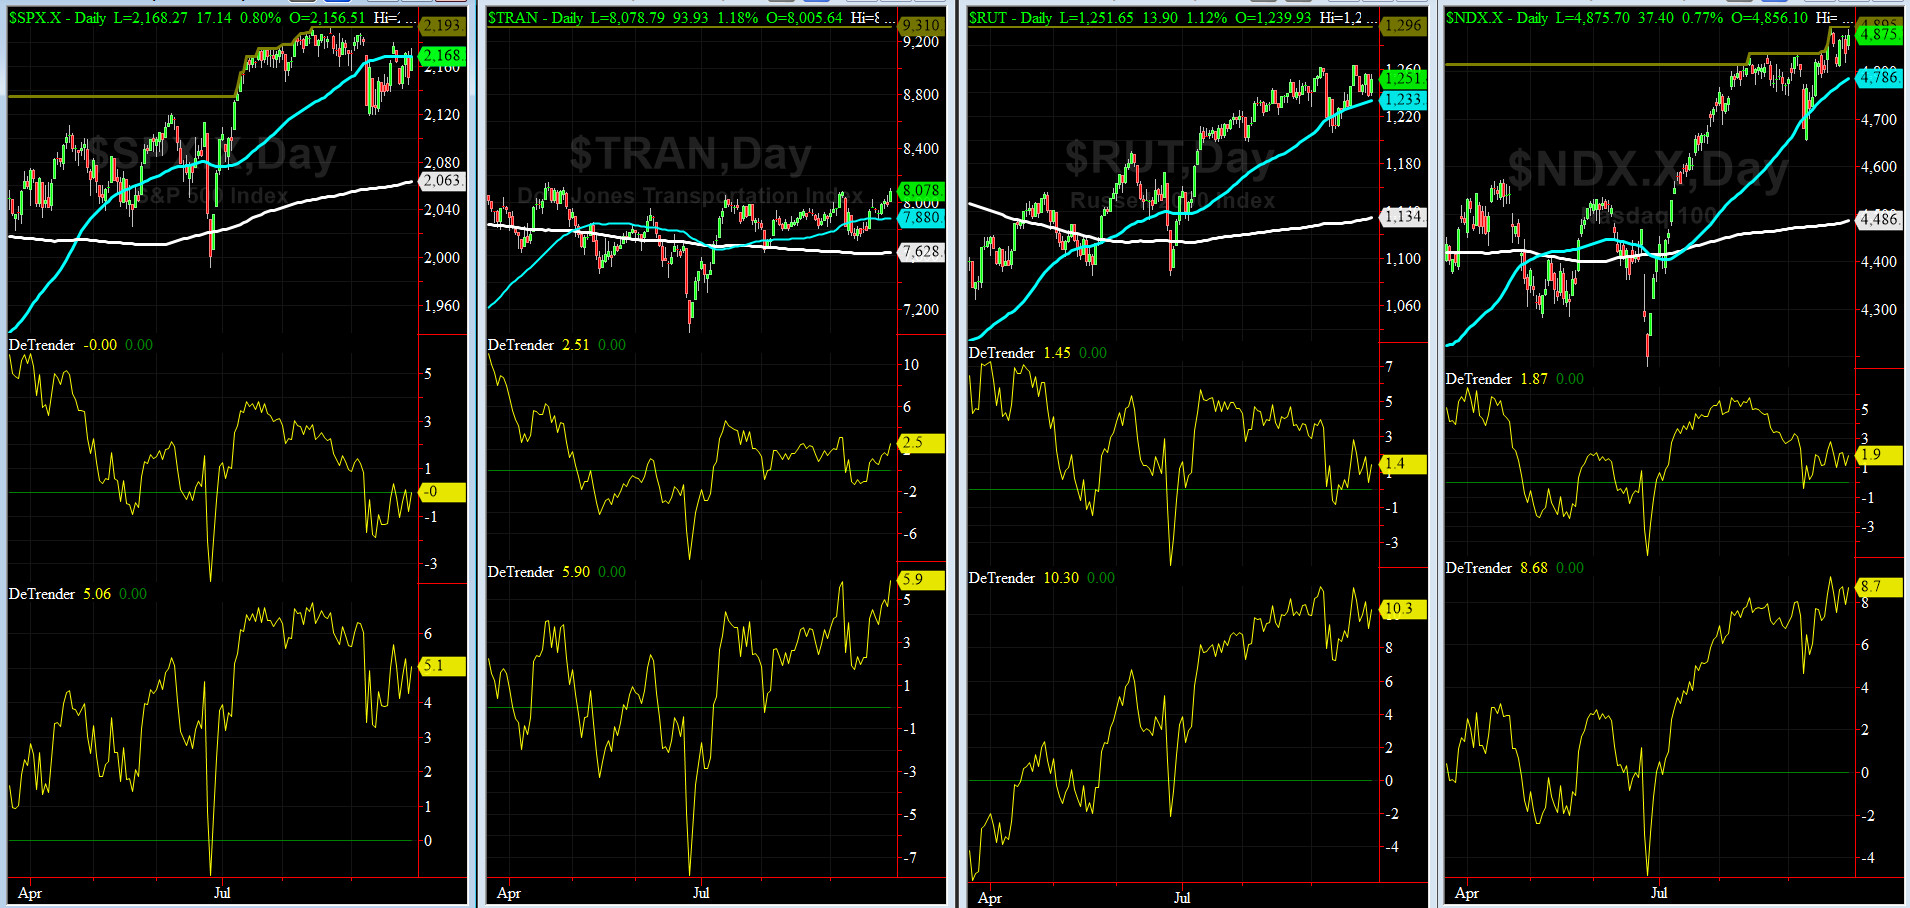
DeTrenders Charts for SPX, NDX, TRAN & RUT Indices
50-Day MA SPX = 2168 where SPX closed on Friday (max observed in last 5 yrs = +8.6%, min = -9.3%)
200-Day MA SPX = 2063 or 5.1% below SPX (max observed in last 5 yrs = 15.2%, min = -14%)
Currently, only 1 of our 8 DeTrenders is negative. The DeTrenders for DJ TRAN & RUT continue to remain on our radar.
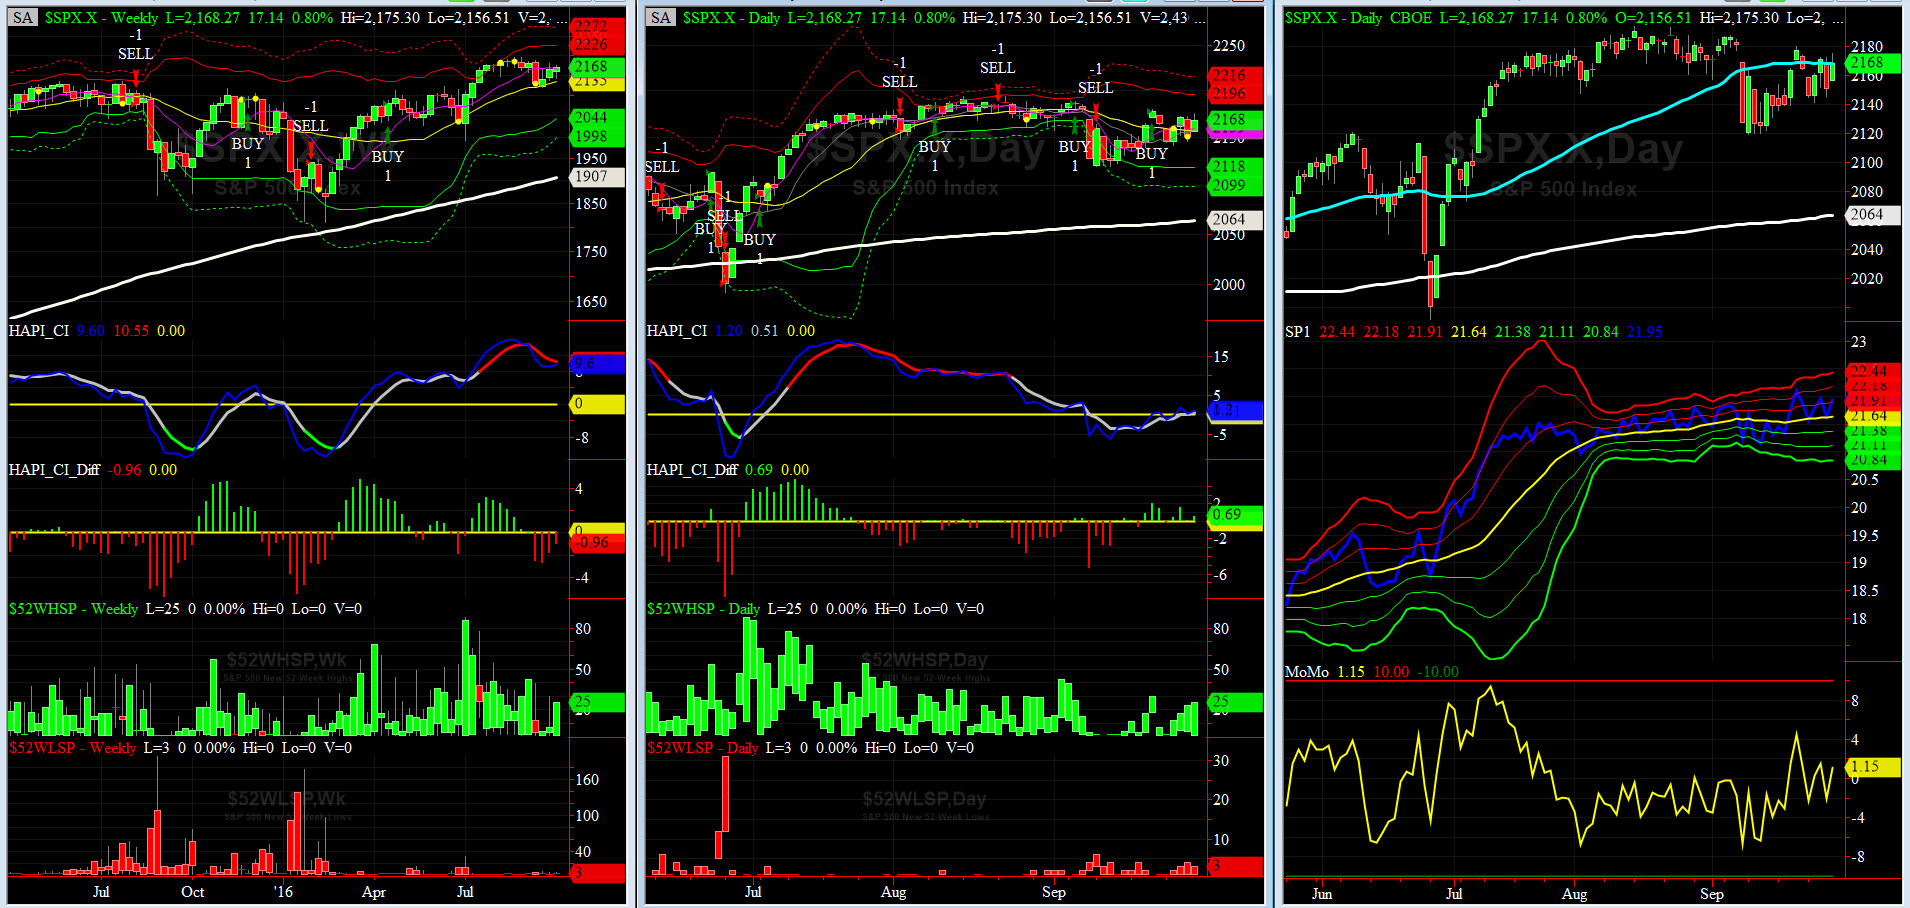
HA_SP1_Momo Chart
WEEKLY Timing Model = on a BUY Signal since Friday 4/15/16 CLOSE at 2081
DAILY Timing Model = on a BUY Signal since Thursday 9/22/16 CLOSE at 2186
Max SPX 52wk-highs reading last week = 25 (over 120-140, the local maxima is in)
Max SPX 52wk-Lows reading last week = 3 (over 40-60, the local minima is in)
HA_SP1 = at its +1 sigma channels
HA_Momo = +1.15 (reversals most likely occur above +10 or below -10)
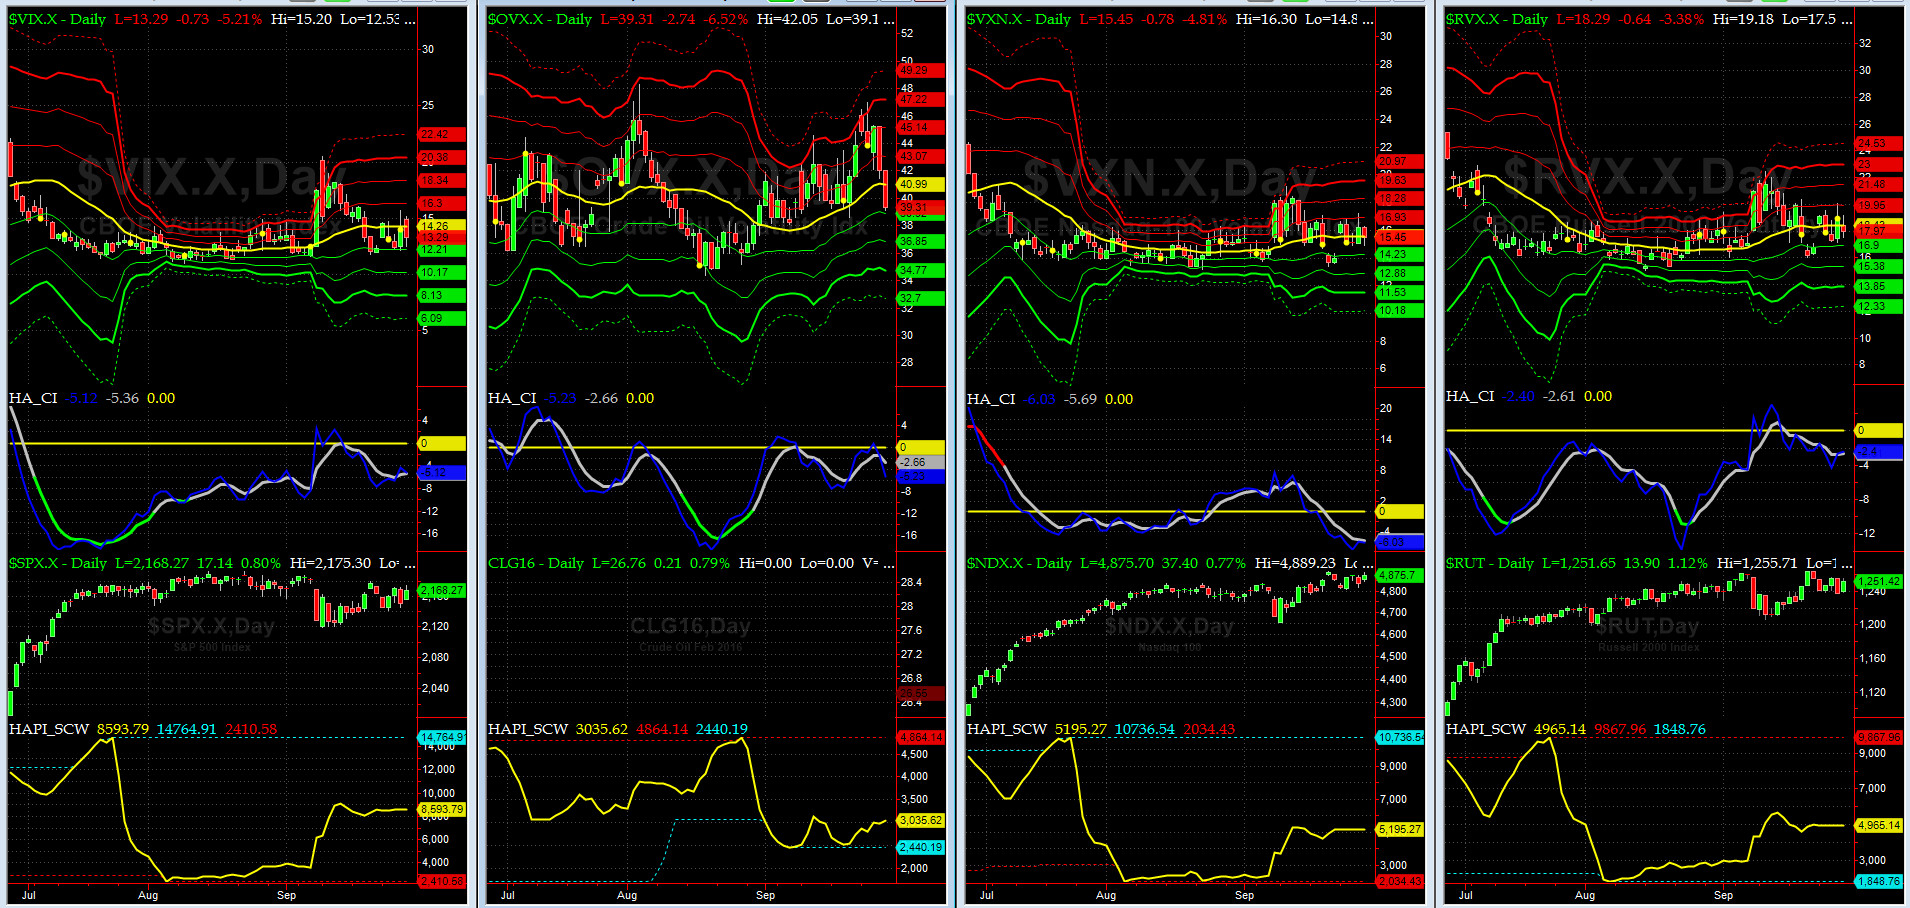
Vol of the Vols Chart
VIX = 13.3 is almost at its -0.5 sigma (remember it�s the VIX�s vol pattern (its sigma channels) that matters, and not the level of VIX itself (this is per Dr. Robert Whaley, a great mentor and the inventor of original VIX, now called VXO). VIX usually peaks around a test of its +4 sigma).
The current shockwave is over for now. The big vol move this week was in the Oil (OVX), thanks to rumors of Saudi cutting back in production (after burning thru 20% of their sovereign fund in just 2 years).
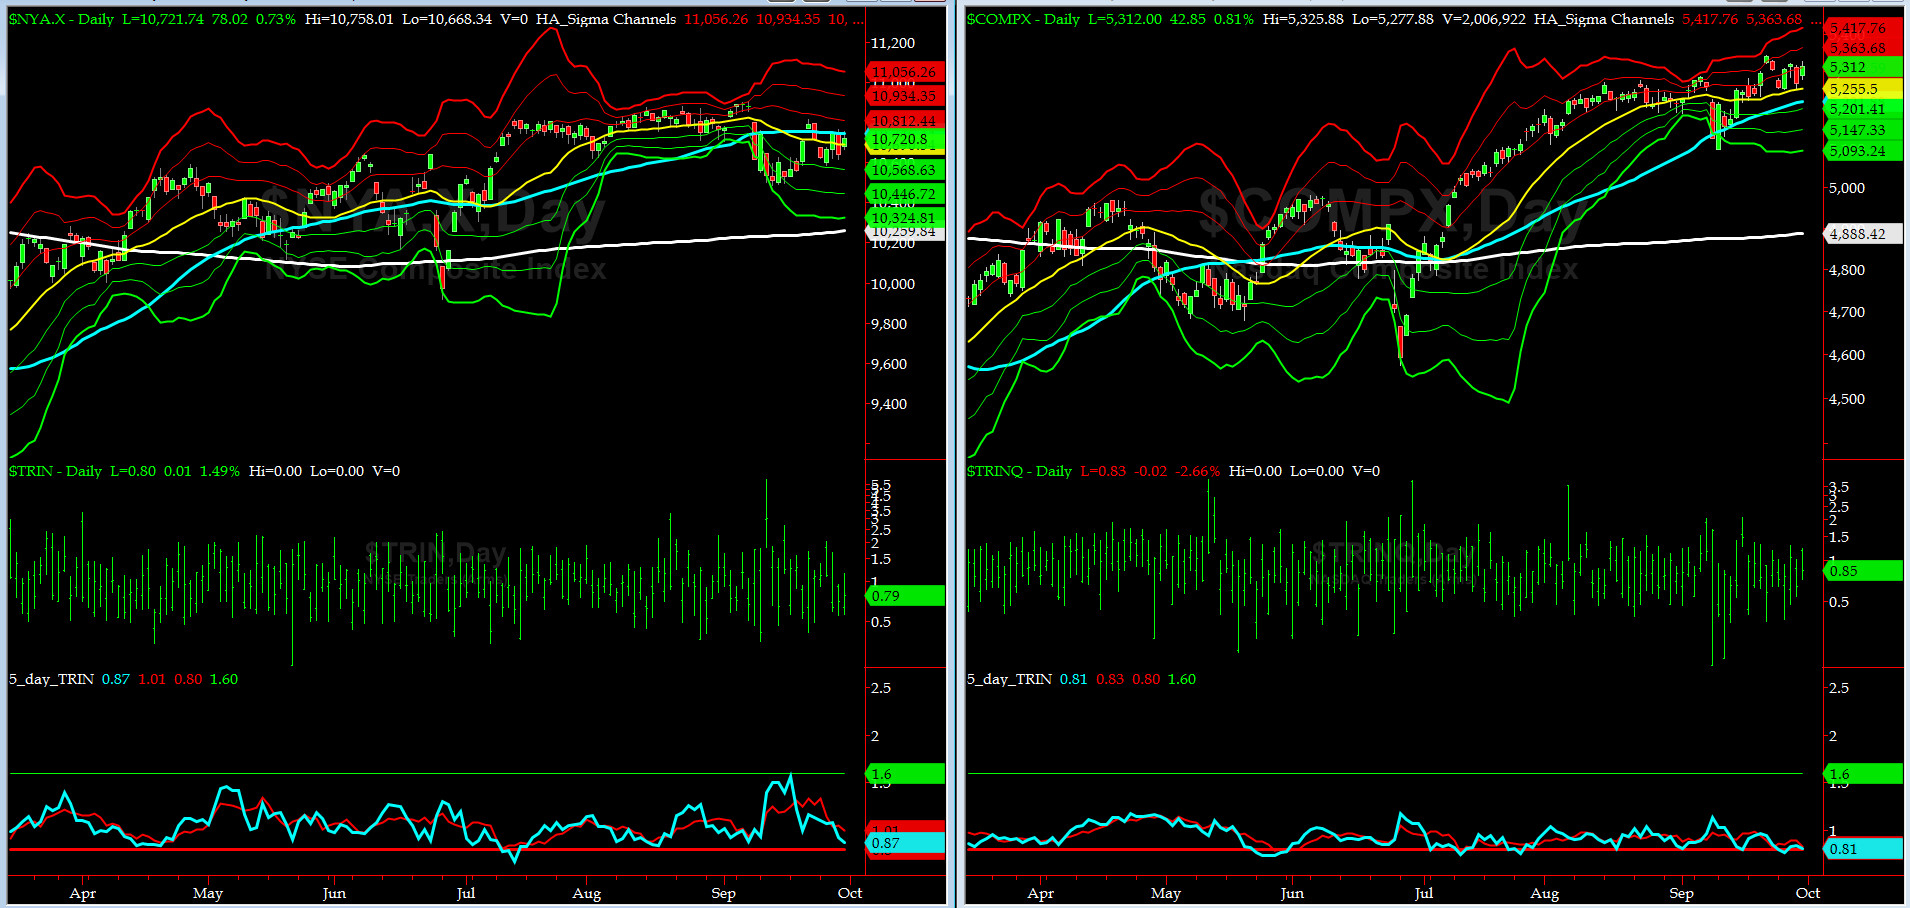
5-day TRIN & TRINQ Charts
NYSE & NASDAQ 5-day TRINs are each now nearing a SELL signal. NOTE: This indicator has tendency of giving false positive signal every now and then.

Components of SPX above their respective 200day MA Chart
This scoring indicator went back and forth and closed near 76% (last week close was 77%). Sausage Ops? for sure. Our Roman Legion were sighted everywhere LOL.

SPX SKEW (Tail Risk) Chart
SPX SKEW (Tail Risk) settled at 124 which is about its -1 sigma (normal = 120-125, range 100-150)
All is getting Quieter on the Mid-Western Front. Last week question is still open: "What will Smart Money bet on next? Contested General Election Results in all Battleground States by both sides?" Yes, we think so.
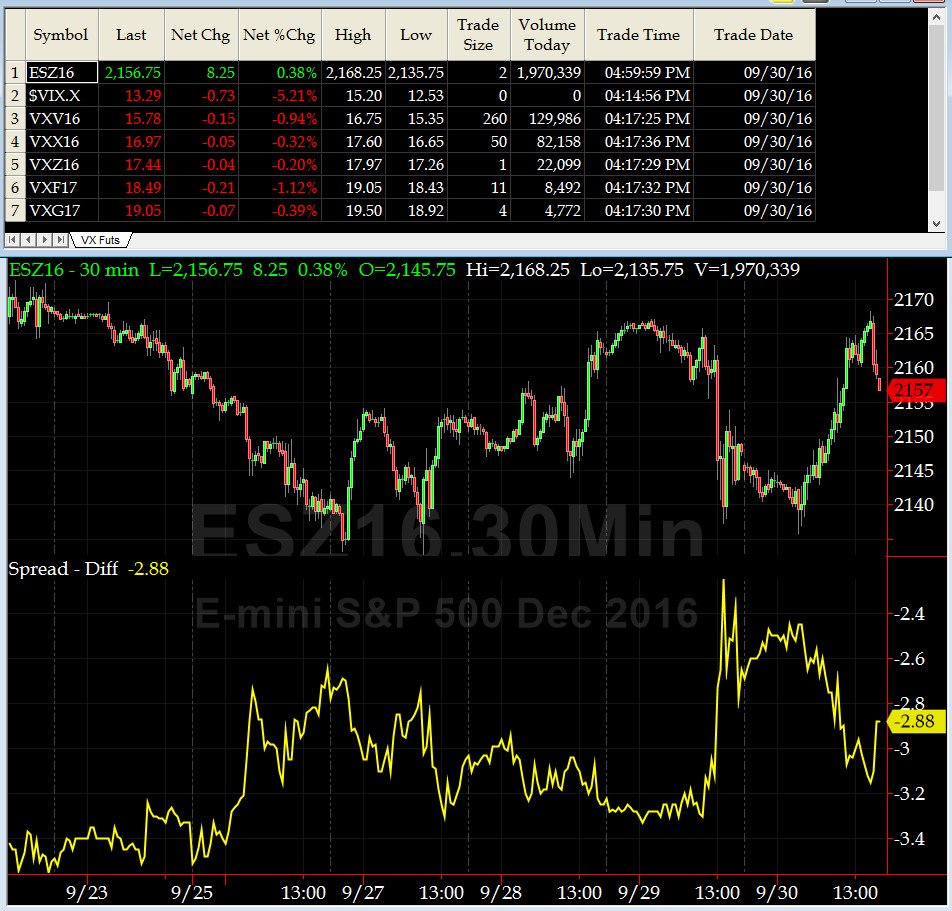
3-month VIX Futures Spread(VX) Chart
Our 3-month VIX Futures Spread (LONG OCT16 & SHORT JAN17) rose up on Thursday on Bloomberg article of DB counter-party story, we presume, and then dropped to -2.88 at Friday Close on rumers of the DoJ's fine for their subprime mortgage-backed bonds may be slashed by nearly $9 Bil. No clear signal here. Our beloved @Capt_Tiko is still recommending more iced tea for all sailors.
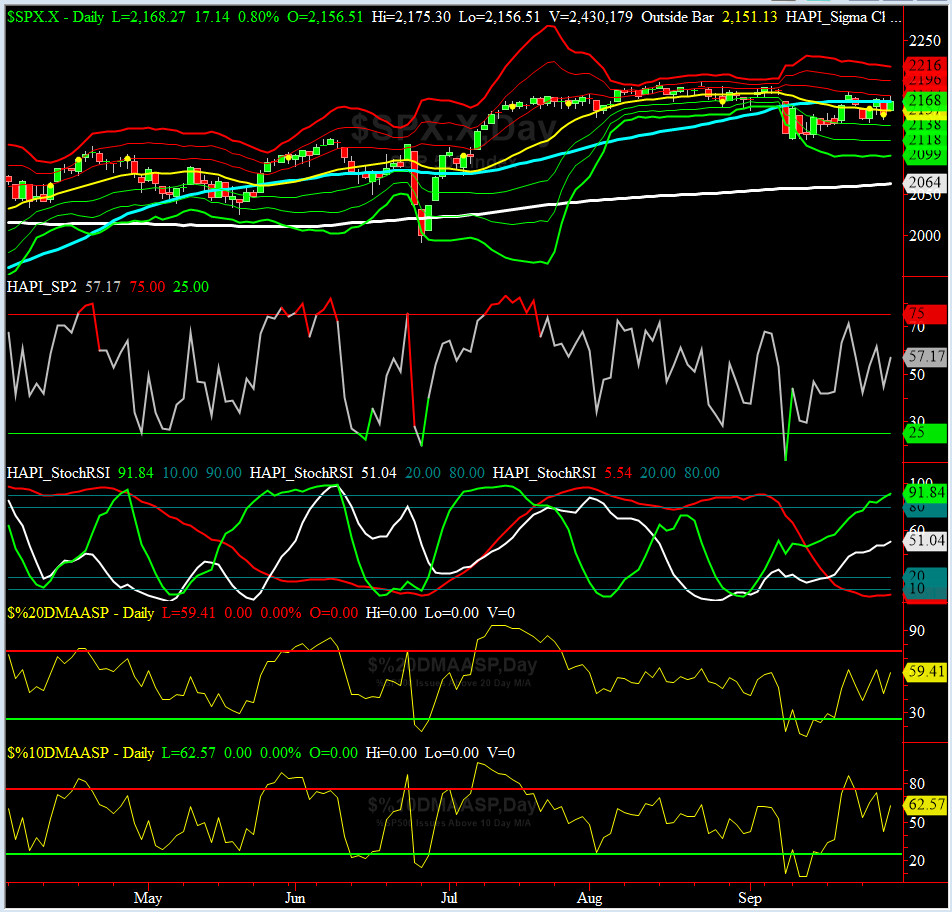
HA_SP2 Chart
HA_SP2 = 57 (Buy signal <= 25, Sell Signal >= 75)
This indicator is in neutral territory again.
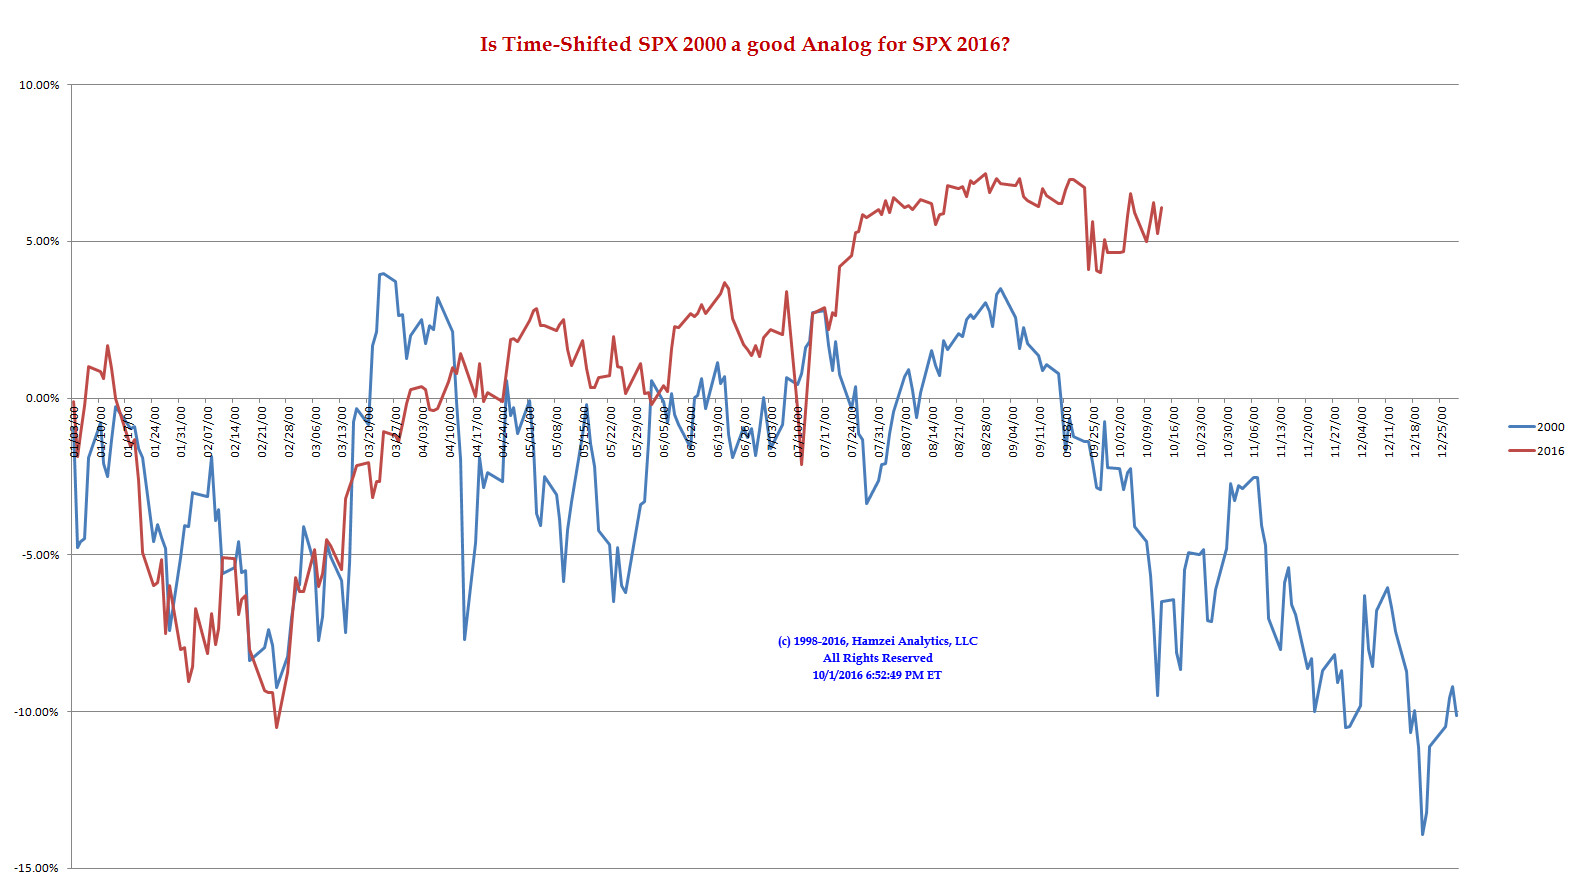
SPX 2000 Analog for SPX 2016
When will the other shoe drop, my XO, @Capt_Tiko keeps asking? Or, shall we assume that the General Election results are clear by now?
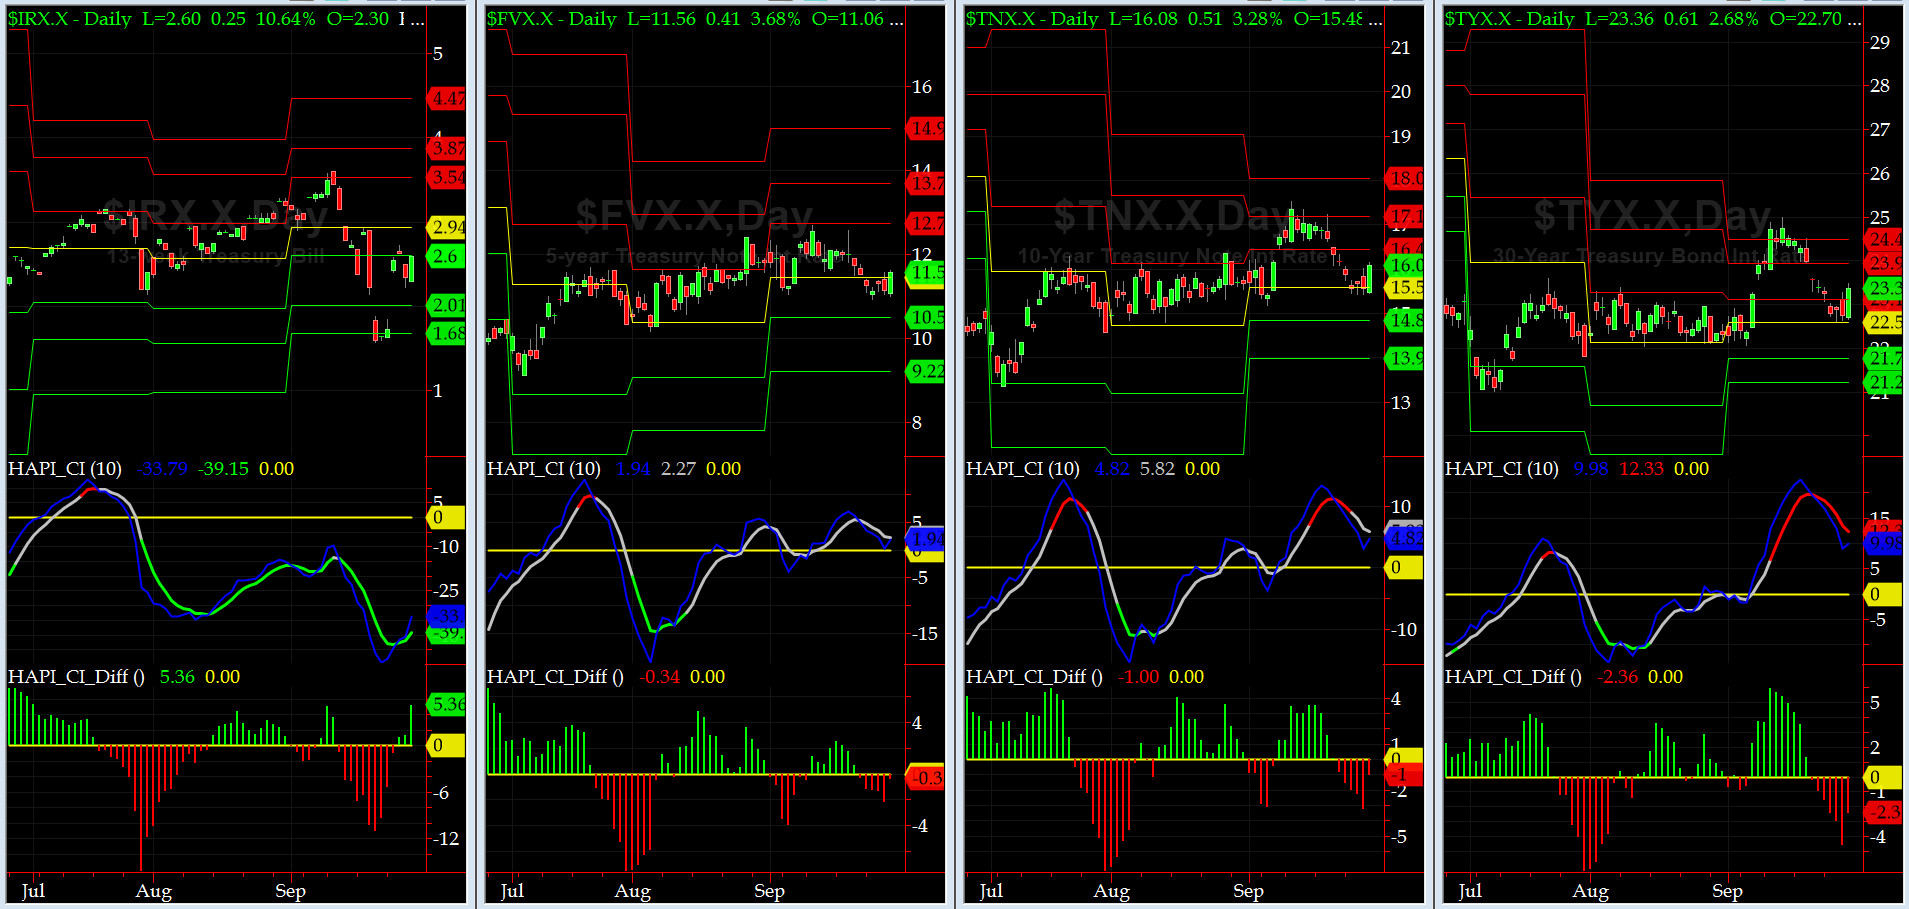
US Treasury T-Notes & T-Bonds Yields Chart
The drop in 91-day discount rate reversed back up from its MS3 Level to MS1, impressing us once again, but rest of the yield curve was fairly docile this past week.
Fari Hamzei
|


 Proactive Market Timing