|
Sunday, October 9, 2016, 1000ET
Market Timing Charts, Analysis & Commentary for Issue #162

Timer Charts of S&P-500 Cash Index (SPX) + NASDAQ-100 Cash Index (NDX)
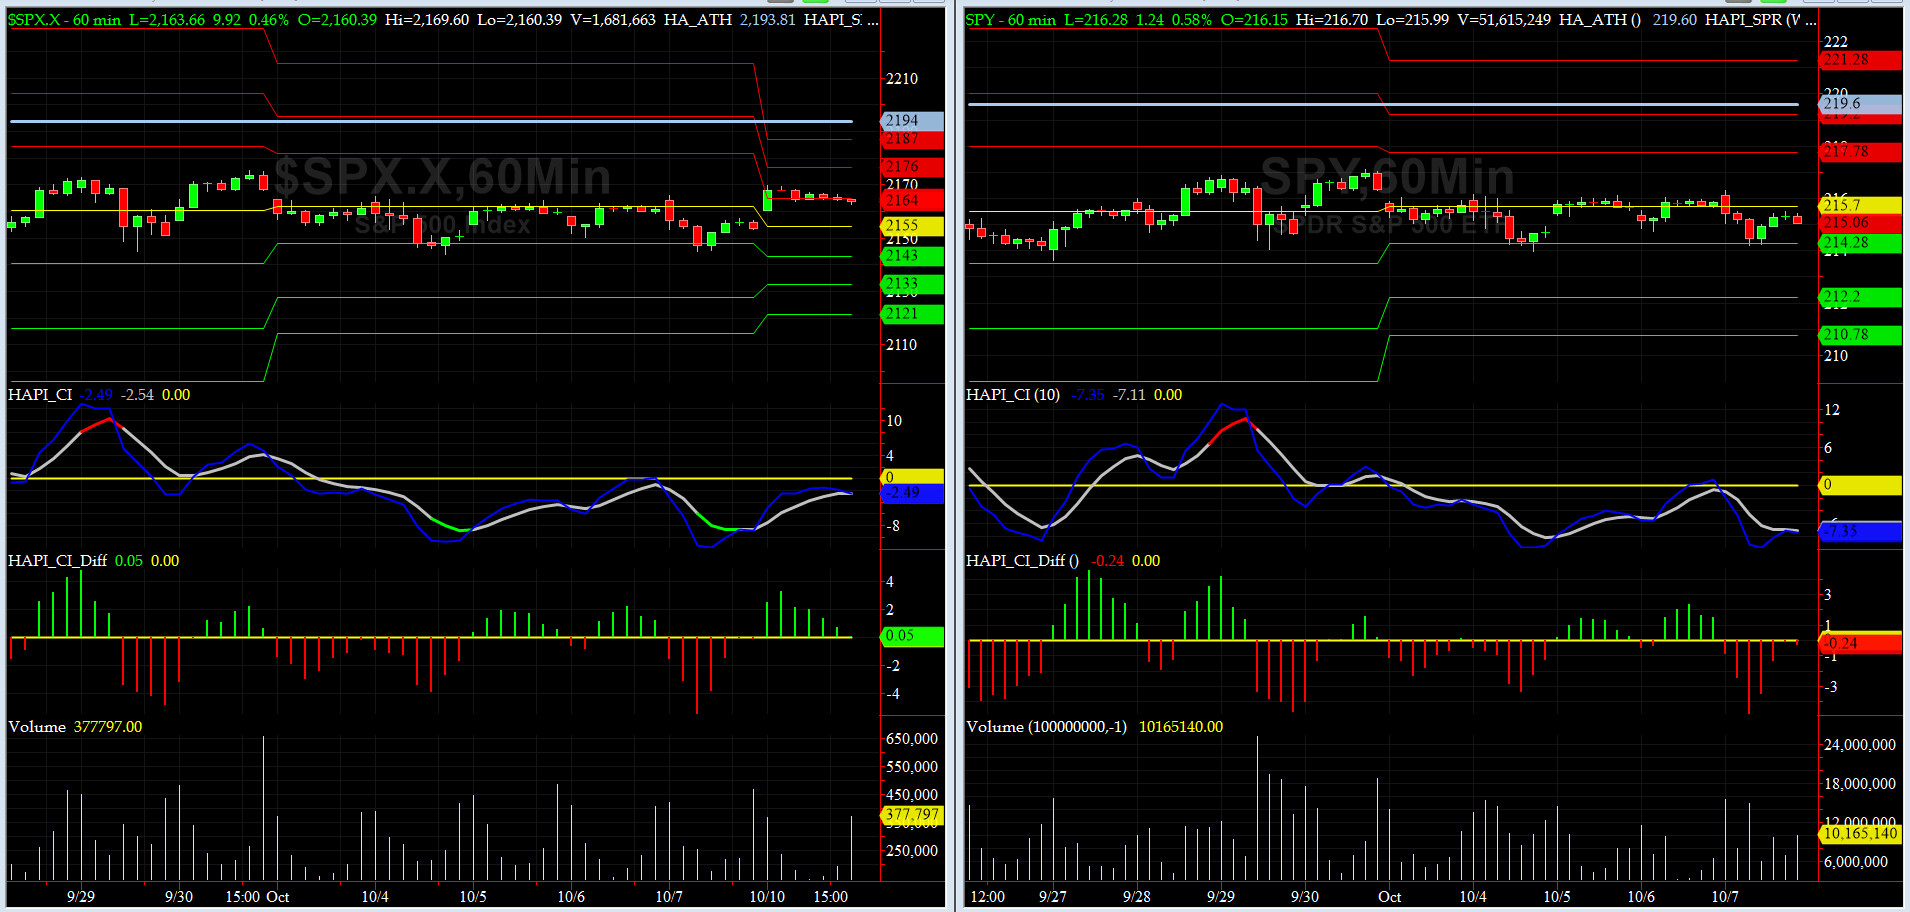
Most recent S&P-500 Cash Index (SPX): 2153.74 down -14.53 (down -0.67% ) for the week ending on Friday, October 7th, 2016, which closed at is zero sigma.
SPX ALL TIME INTRADAY HIGH = 2193.81 (reached on Monday, August 15, 2016)
SPX ALL TIME CLOSING HIGH = 2190.15 (reached on Monday, August 15, 2016)
Current DAILY +2 Sigma SPX = 2181 with WEEKLY +2 Sigma = 2223
Current DAILY 0 Sigma (20 day MA) SPX = 2153 with WEEKLY 0 Sigma = 2140
Current DAILY -2 Sigma SPX = 2126 with WEEKLY -2 Sigma = 2057
NYSE McClellan Oscillator = -119 (-150 is start of the O/S area; around -275 to -300 area or lower, we go into the �launch-pad� mode, over +150, we are in O/B area)
NYSE Breadth Thrust = 44.5(40 is considered as oversold and 65 as overbought)
Trading this past week was again quite hectic as evidenced by charts and data included hereinafter. And SPX & NDX each put in two outside bars this past week. US Presidential Election is almost here and both camps are fighting it in the gutter.
In addition, SEPT NFP came in rather soft for the second month in the row.
REMINDER: �Sell on Rosh Hashanah and Buy on Yom Kippur,� a favorite of Art Cashin, Director of NYSE Floor Operations for UBS.
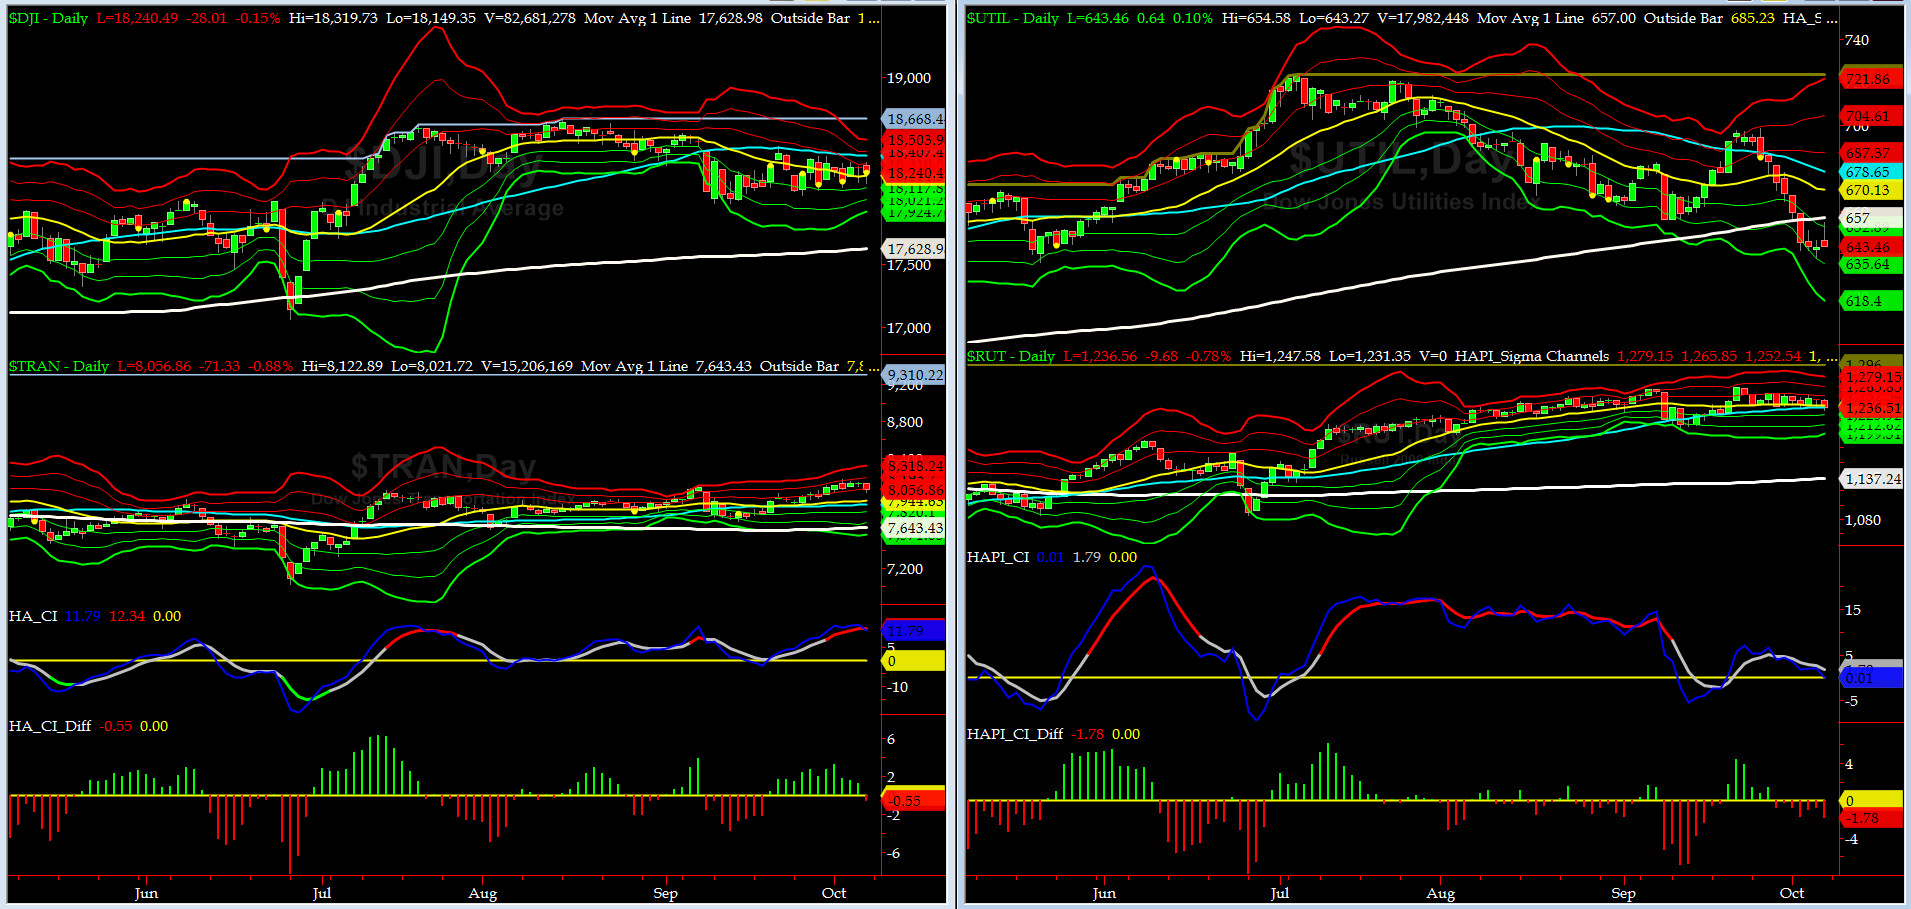
Canaries [in the Coal Mine] Chart for DJ TRAN & RUT Indices
200-Day MA DJ TRAN = 7643 or 5.4% below DJ TRAN (max observed in last 5 yrs = 20.2%, min = -20.3%)
200-Day MA RUT = 1137 or 8.7% below RUT (max observed in last 5 yrs = 21.3%, min = -22.6%)
DJ Transports (proxy for economic conditions 6 to 9 months hence) had a huge drop on Friday, about 0.9% (also BLS reported that trucking employment has contracted y/y for the last 4 months).
Russell 2000 Small Caps (proxy for RISK ON/OFF) continued to sell off in drip drip mode..... RISK continues to be CONFUSED here.
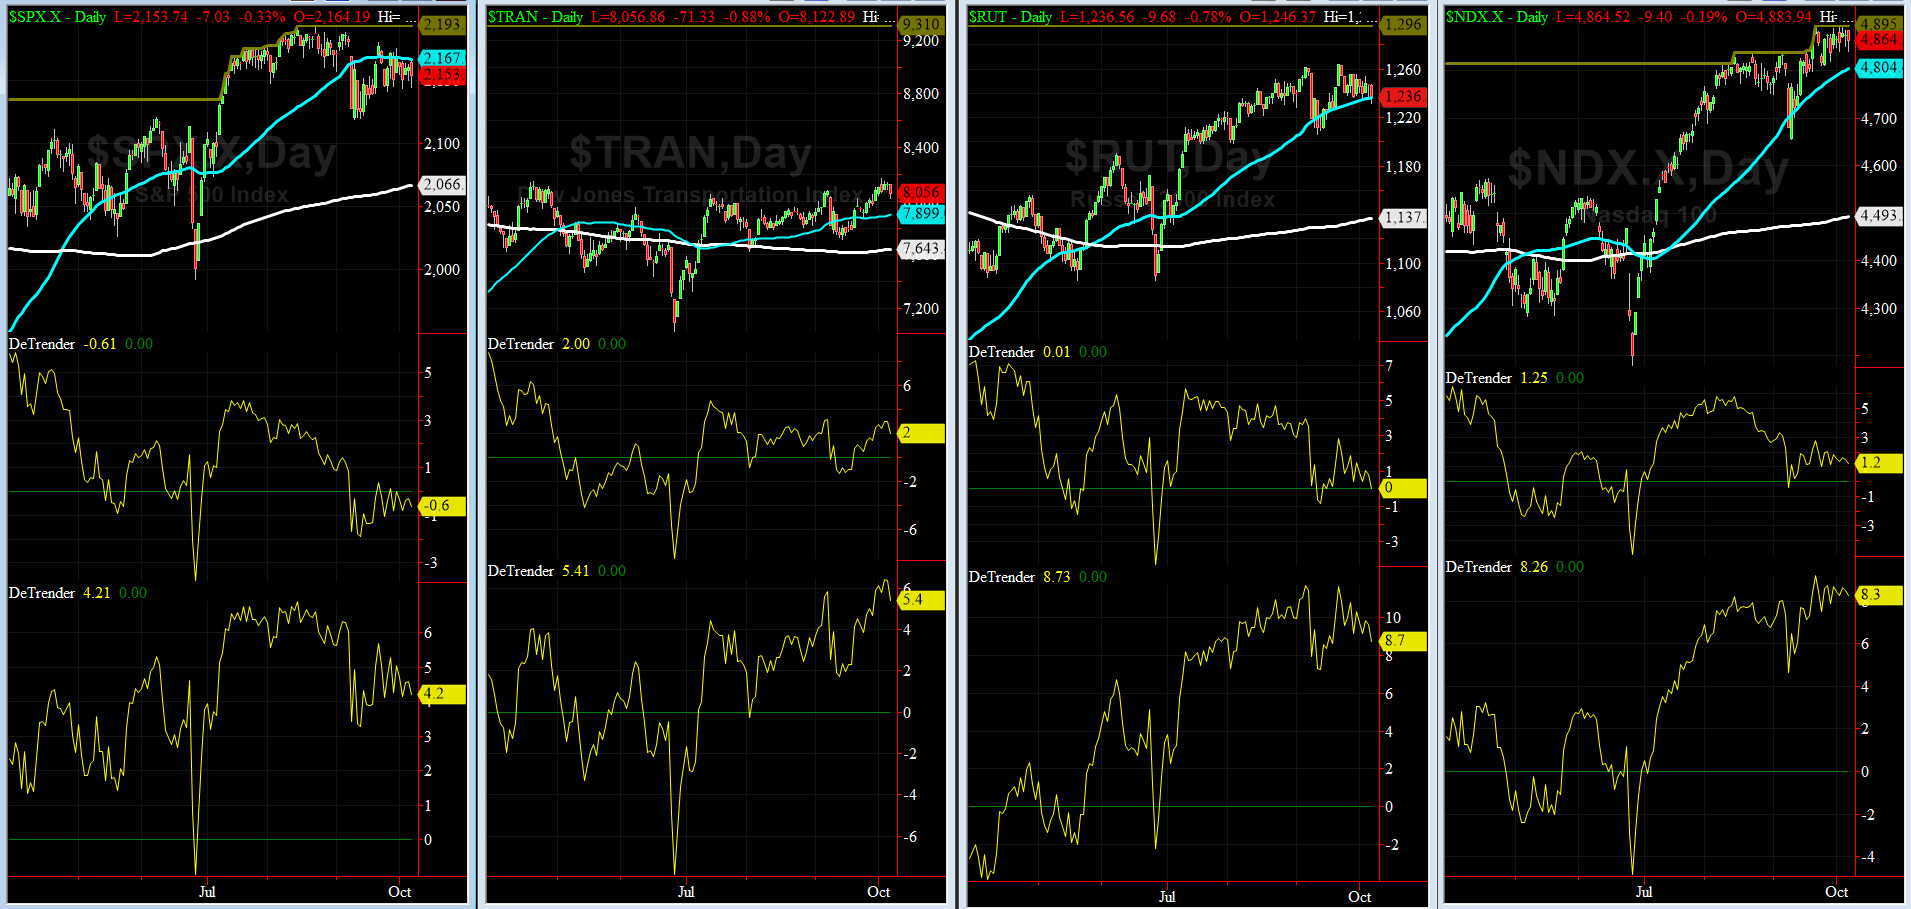
DeTrenders Charts for SPX, NDX, TRAN & RUT Indices
50-Day MA SPX = 2167 or 0.6% above SPX closed on Friday (max observed in last 5 yrs = +8.6%, min = -9.3%)
200-Day MA SPX = 2063 or 4.2% below SPX (max observed in last 5 yrs = 15.2%, min = -14%)
Currently, only 1 of our 8 DeTrenders is negative. The DeTrenders for DJ TRAN & RUT continue to remain on our radar.
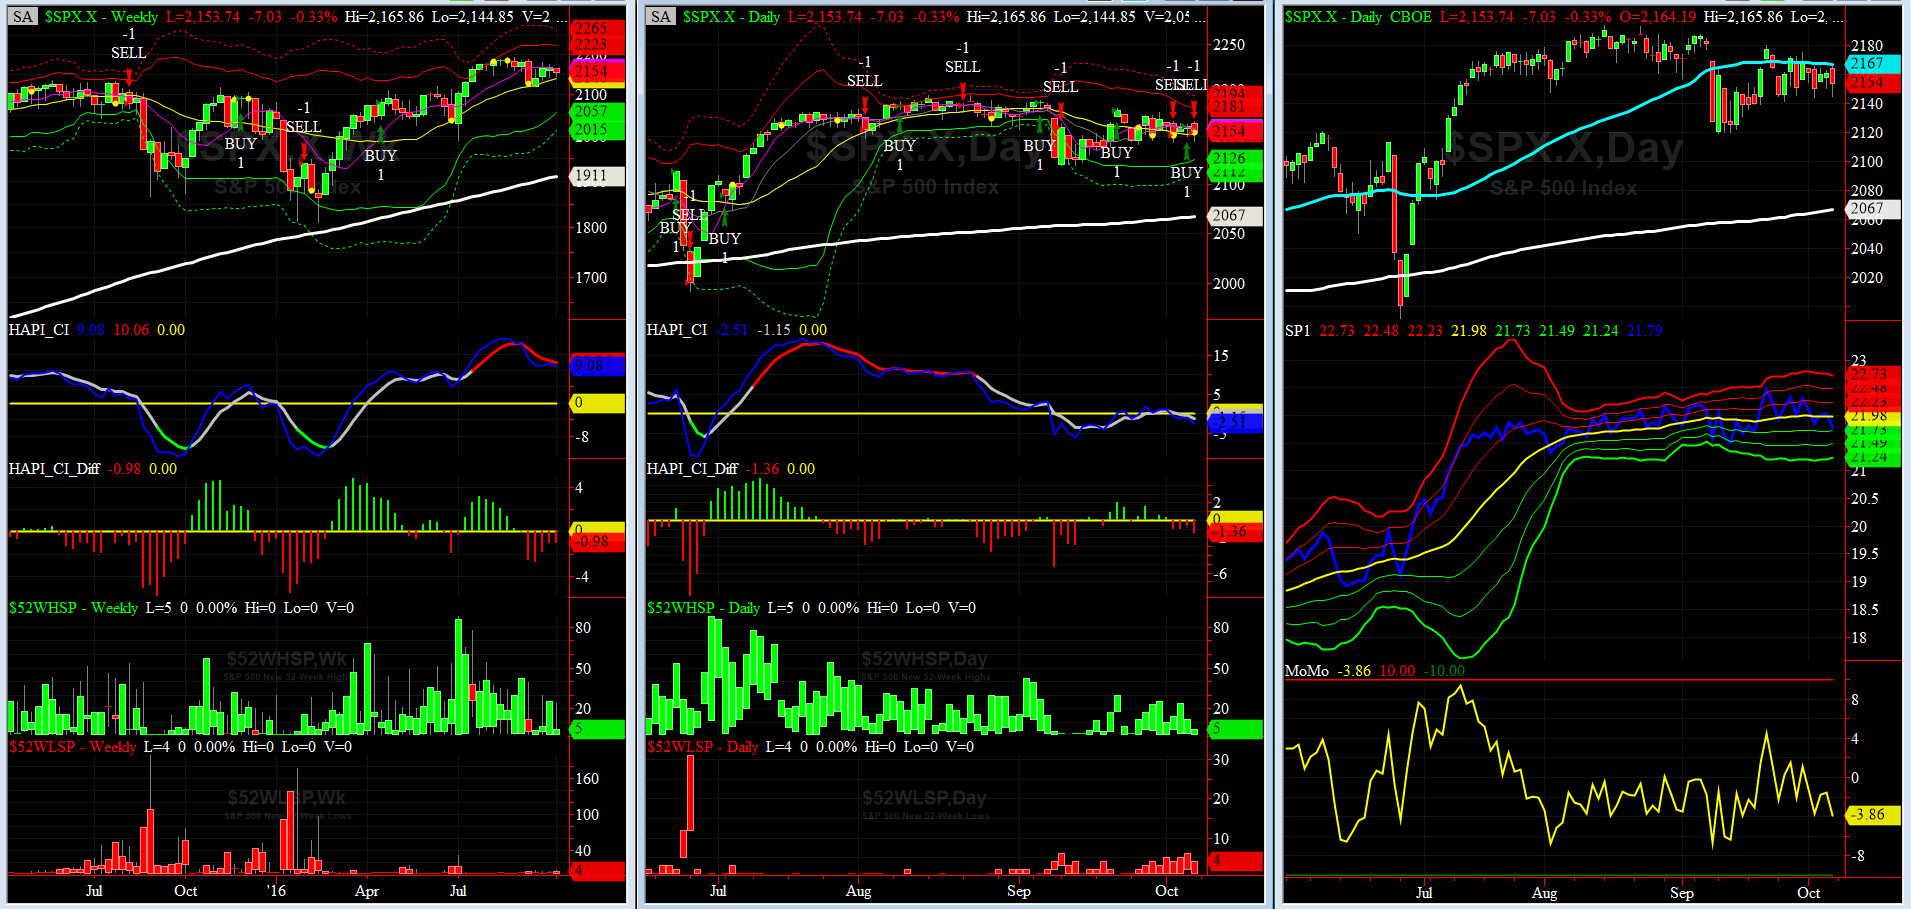
HA_SP1_Momo Chart
WEEKLY Timing Model = on a BUY Signal since Friday 4/15/16 CLOSE at 2081
DAILY Timing Model = on a SELL Signal since Friday 10/07/16 CLOSE at 2153
Max SPX 52wk-highs reading last week = 24 (over 120-140, the local maxima is in)
Max SPX 52wk-Lows reading last week = 6 (over 40-60, the local minima is in)
HA_SP1 = at its -1 sigma channels
HA_Momo = -3.86 (reversals most likely occur above +10 or below -10)
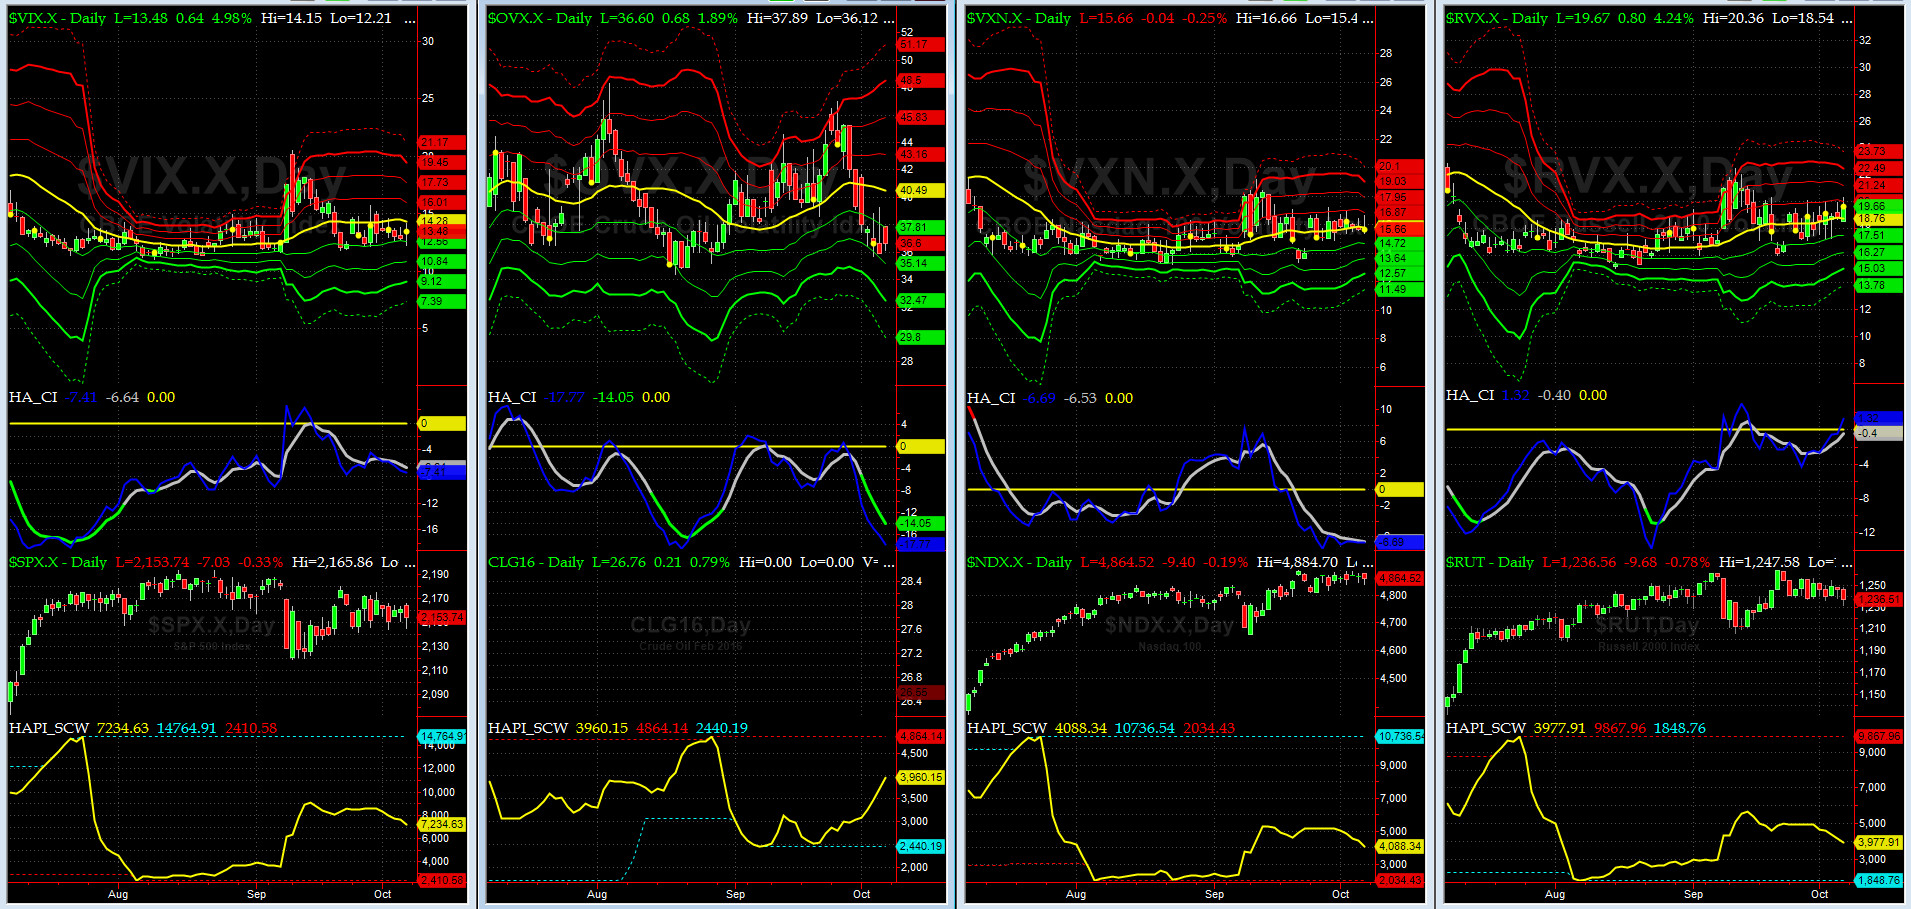
Vol of the Vols Chart
VIX = 13.5 is again at its -0.5 sigma (remember it�s the VIX�s vol pattern (its sigma channels) that matters, and not the level of VIX itself (this is per Dr. Robert Whaley, a great mentor and the inventor of original VIX, now called VXO). VIX usually peaks around a test of its +4 sigma).
The current shockwave is over for now.
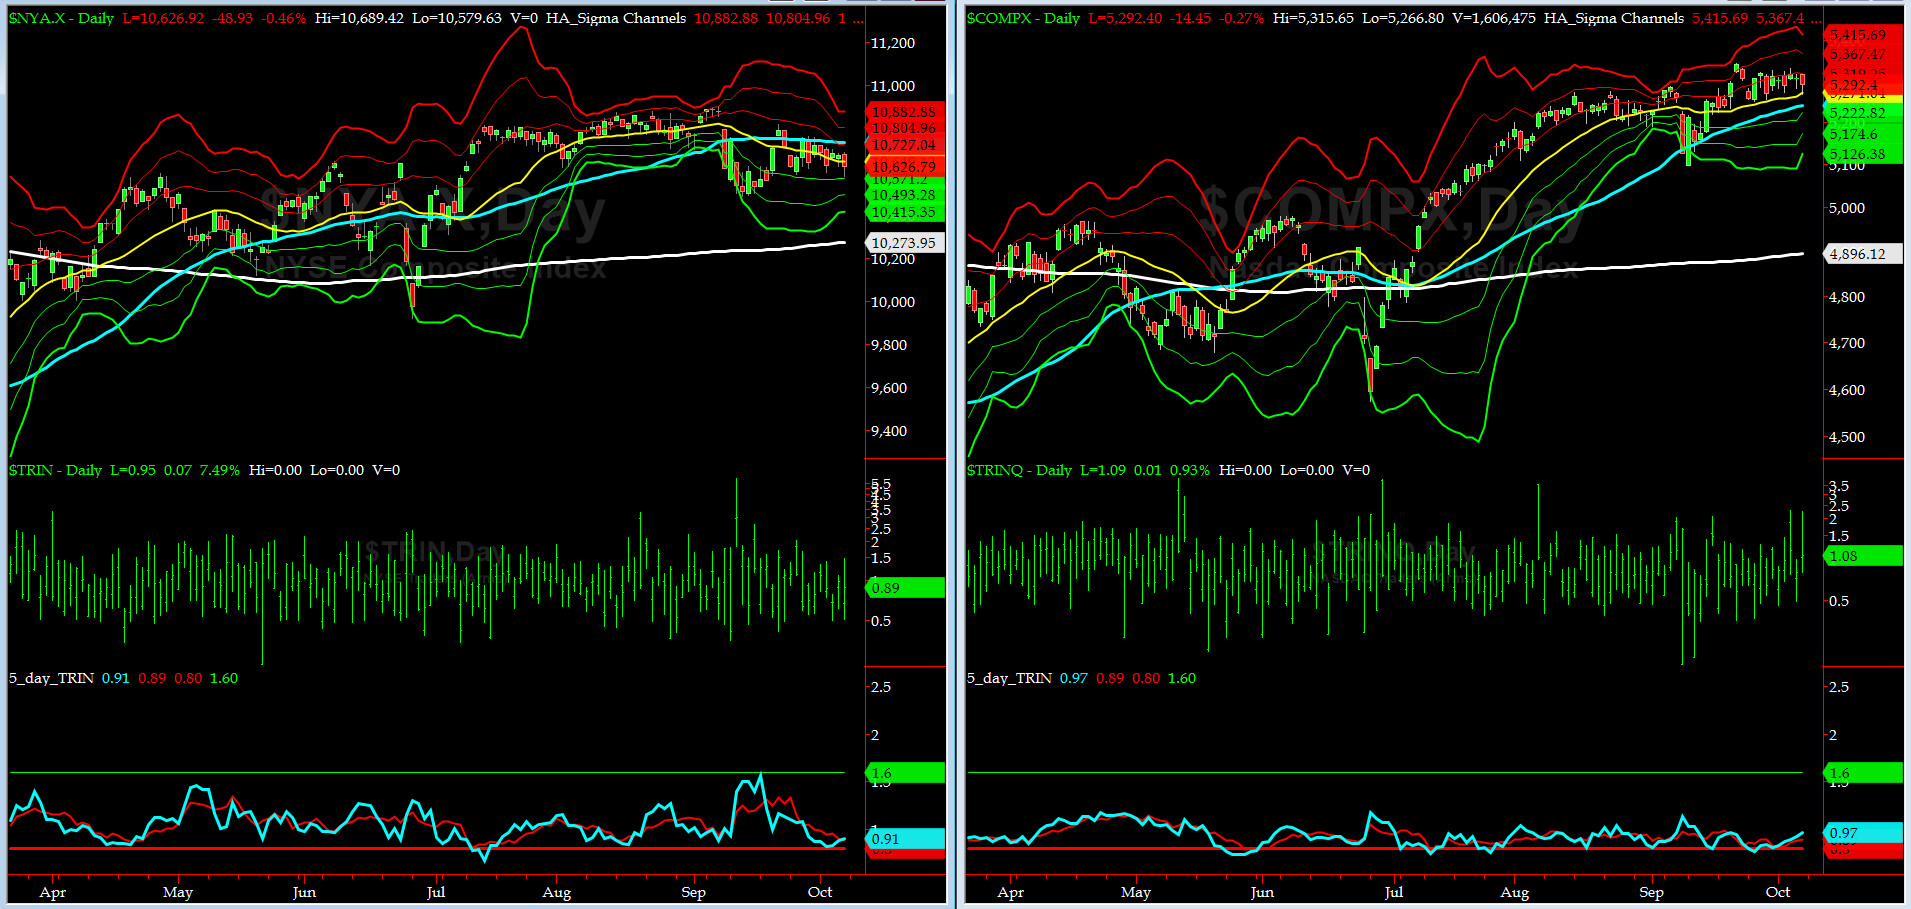
5-day TRIN & TRINQ Charts
NYSE & NASDAQ 5-day TRINs have pulled up a tad after each gave a SELL signal.
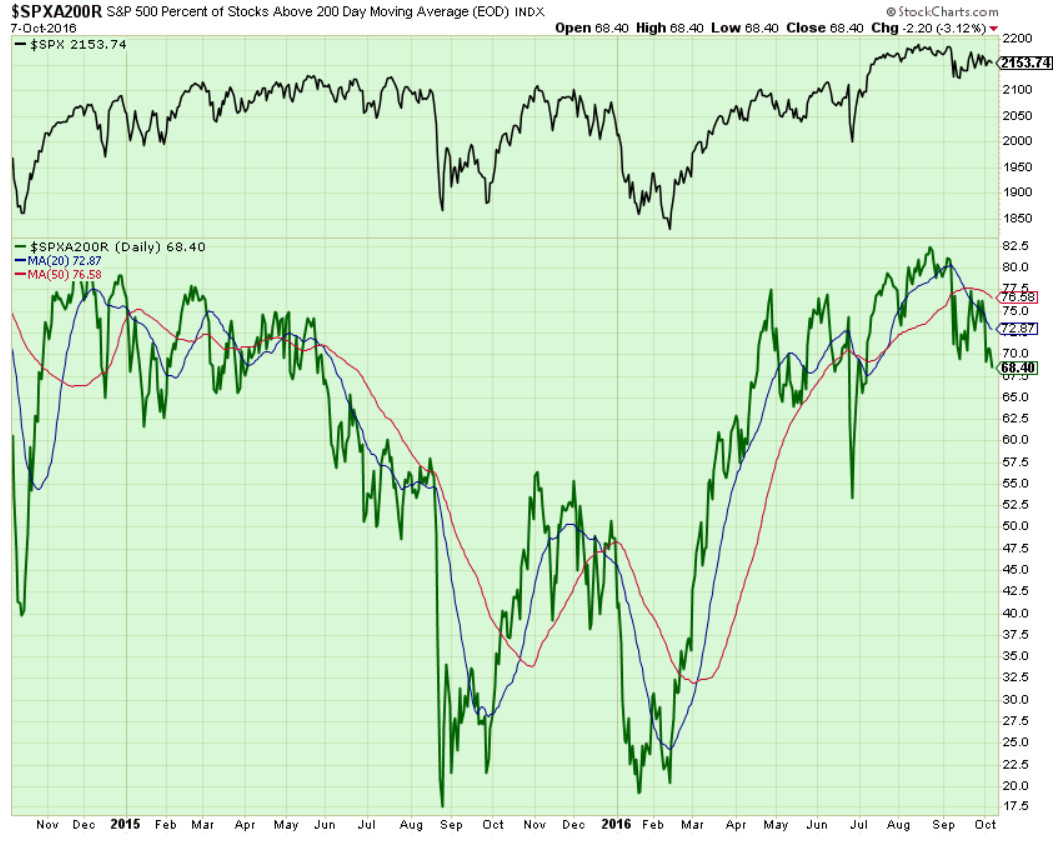
Components of SPX above their respective 200day MA Chart
This scoring indicator sank to 68% on Friday. @Capt_Tiko is next looking for 55% to 60% for this indicator.
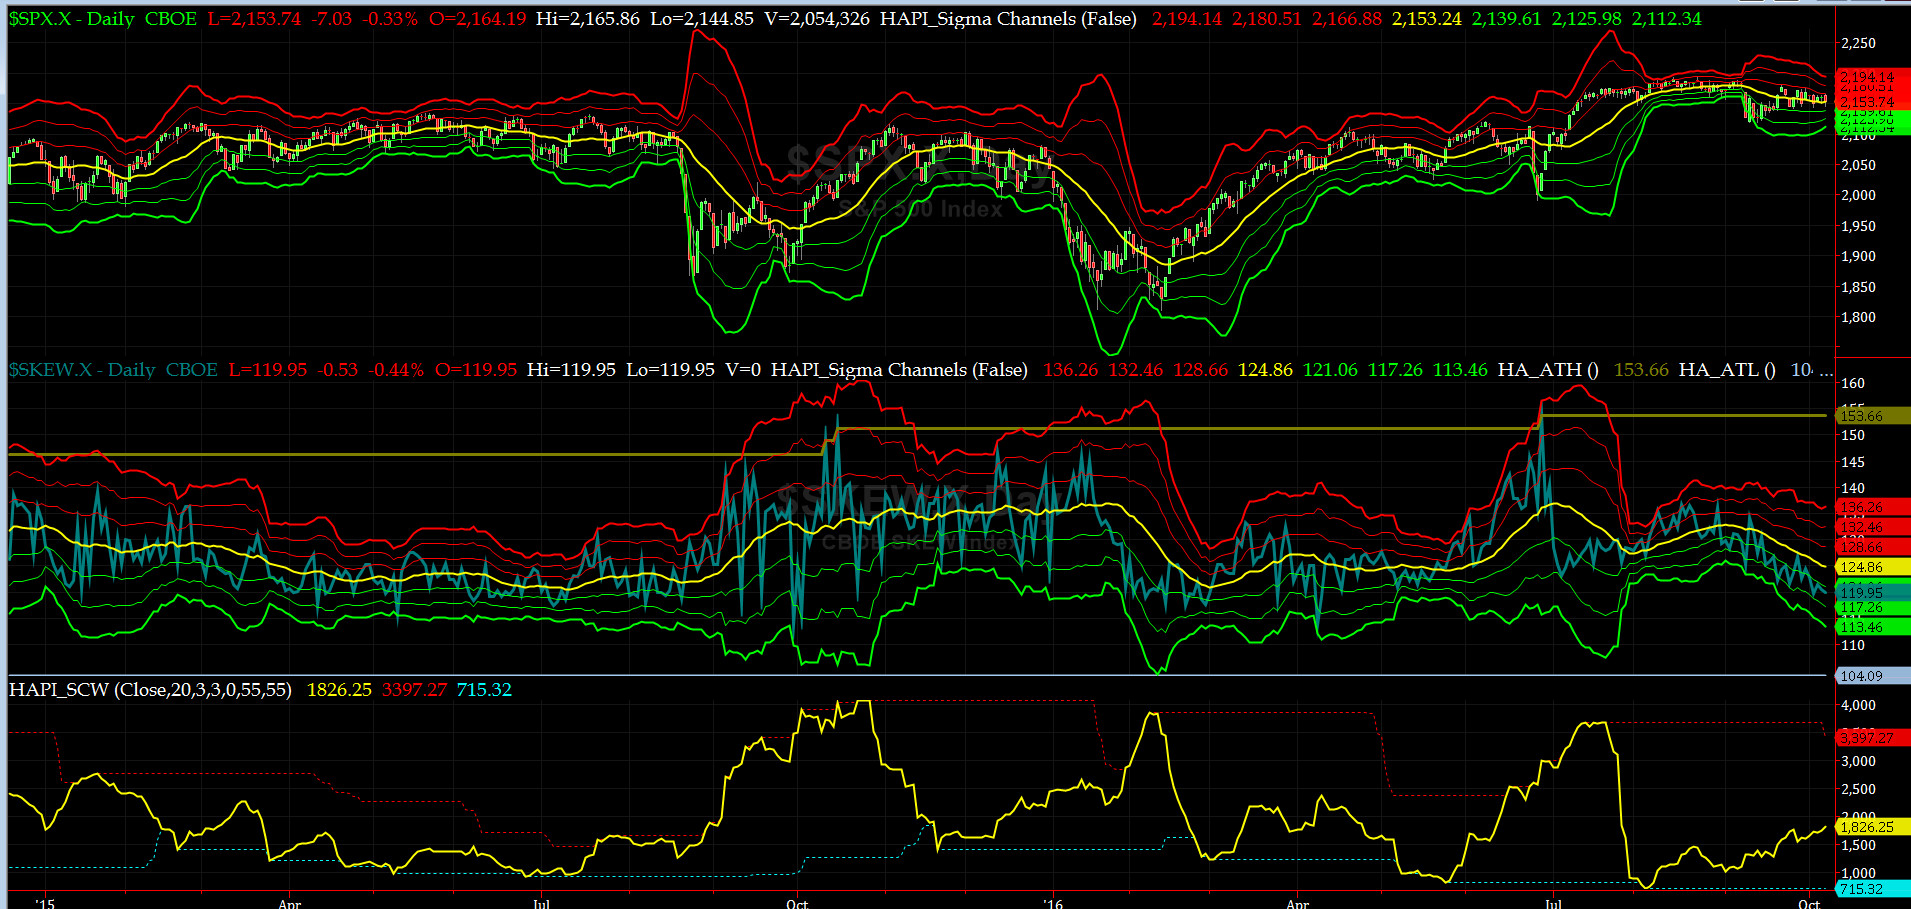
SPX SKEW (Tail Risk) Chart
SPX SKEW (Tail Risk) settled at 120 which is about its -1 sigma (normal = 120-125, range 100-150)
All is getting Quieter on the Mid-Western Front. Has Smart Money already left for Palm Beach? Stay tuned......
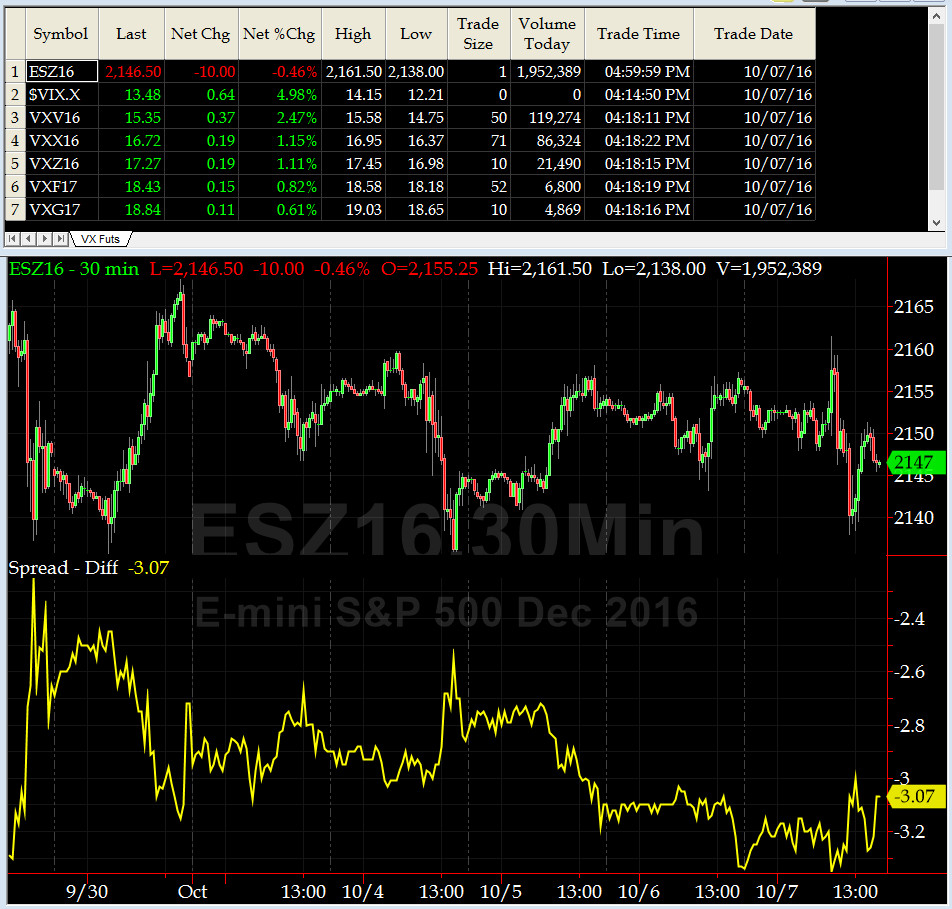
3-month VIX Futures Spread(VX) Chart
Our 3-month VIX Futures Spread (LONG OCT16 & SHORT JAN17) dropped to -3.07 resulting again in no clear signal here. Our beloved @Capt_Tiko is still recommending more iced tea for all sailors.

HA_SP2 Chart
HA_SP2 = 45 (Buy signal <= 25, Sell Signal >= 75)
This indicator is in neutral territory again.
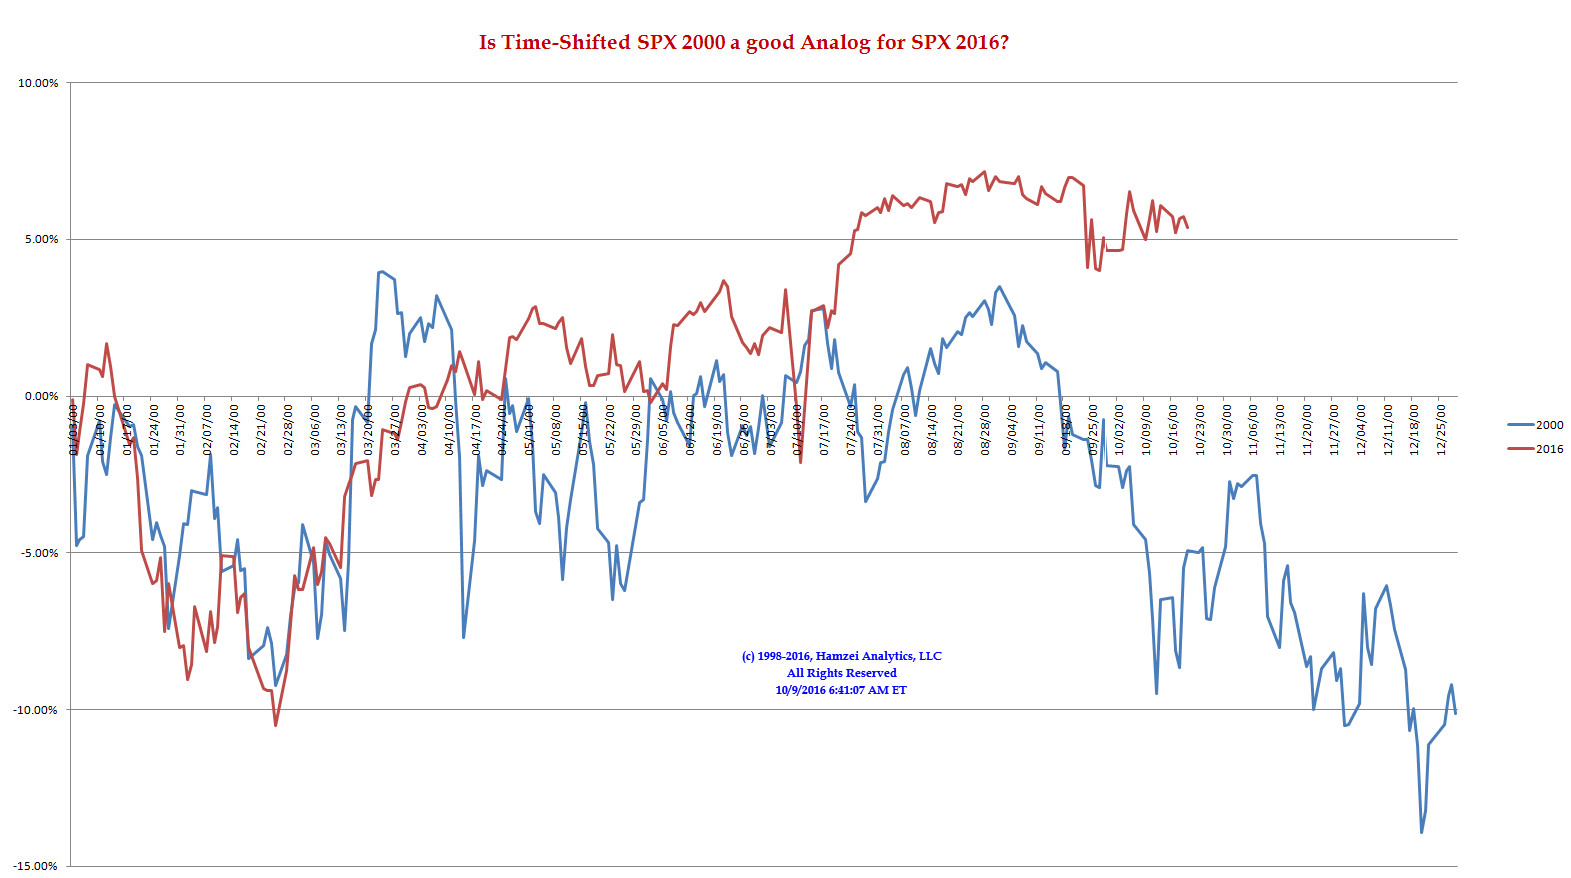
SPX 2000 Analog for SPX 2016
When will the other shoe drop, my XO, @Capt_Tiko keeps asking? Or, shall we assume that the General Election results are clear by now?
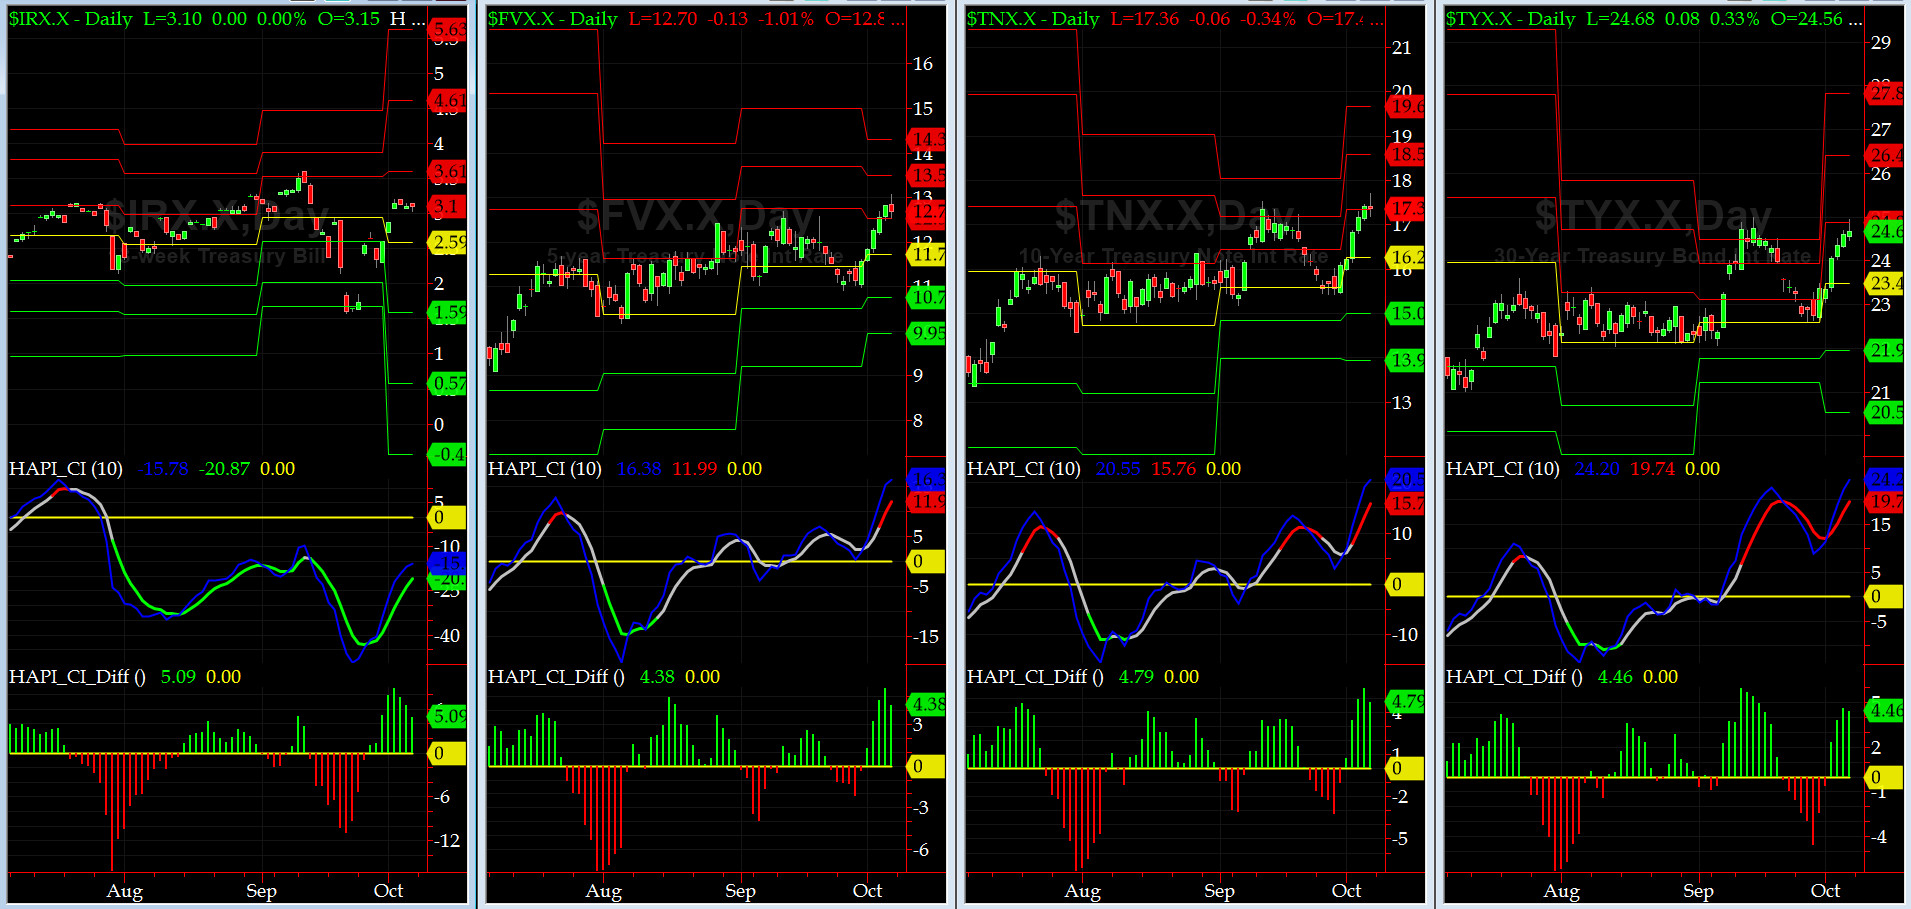
US Treasury T-Notes & T-Bonds Yields Chart
The ramp up in Treasury Yields is beginning to alarm us.
Fari Hamzei
|


 Proactive Market Timing