|
Sunday, October 23, 2016, 1845ET
Market Timing Charts, Analysis & Commentary for Issue #164
Timer Charts of S&P-500 Cash Index (SPX) + NASDAQ-100 Cash Index (NDX)
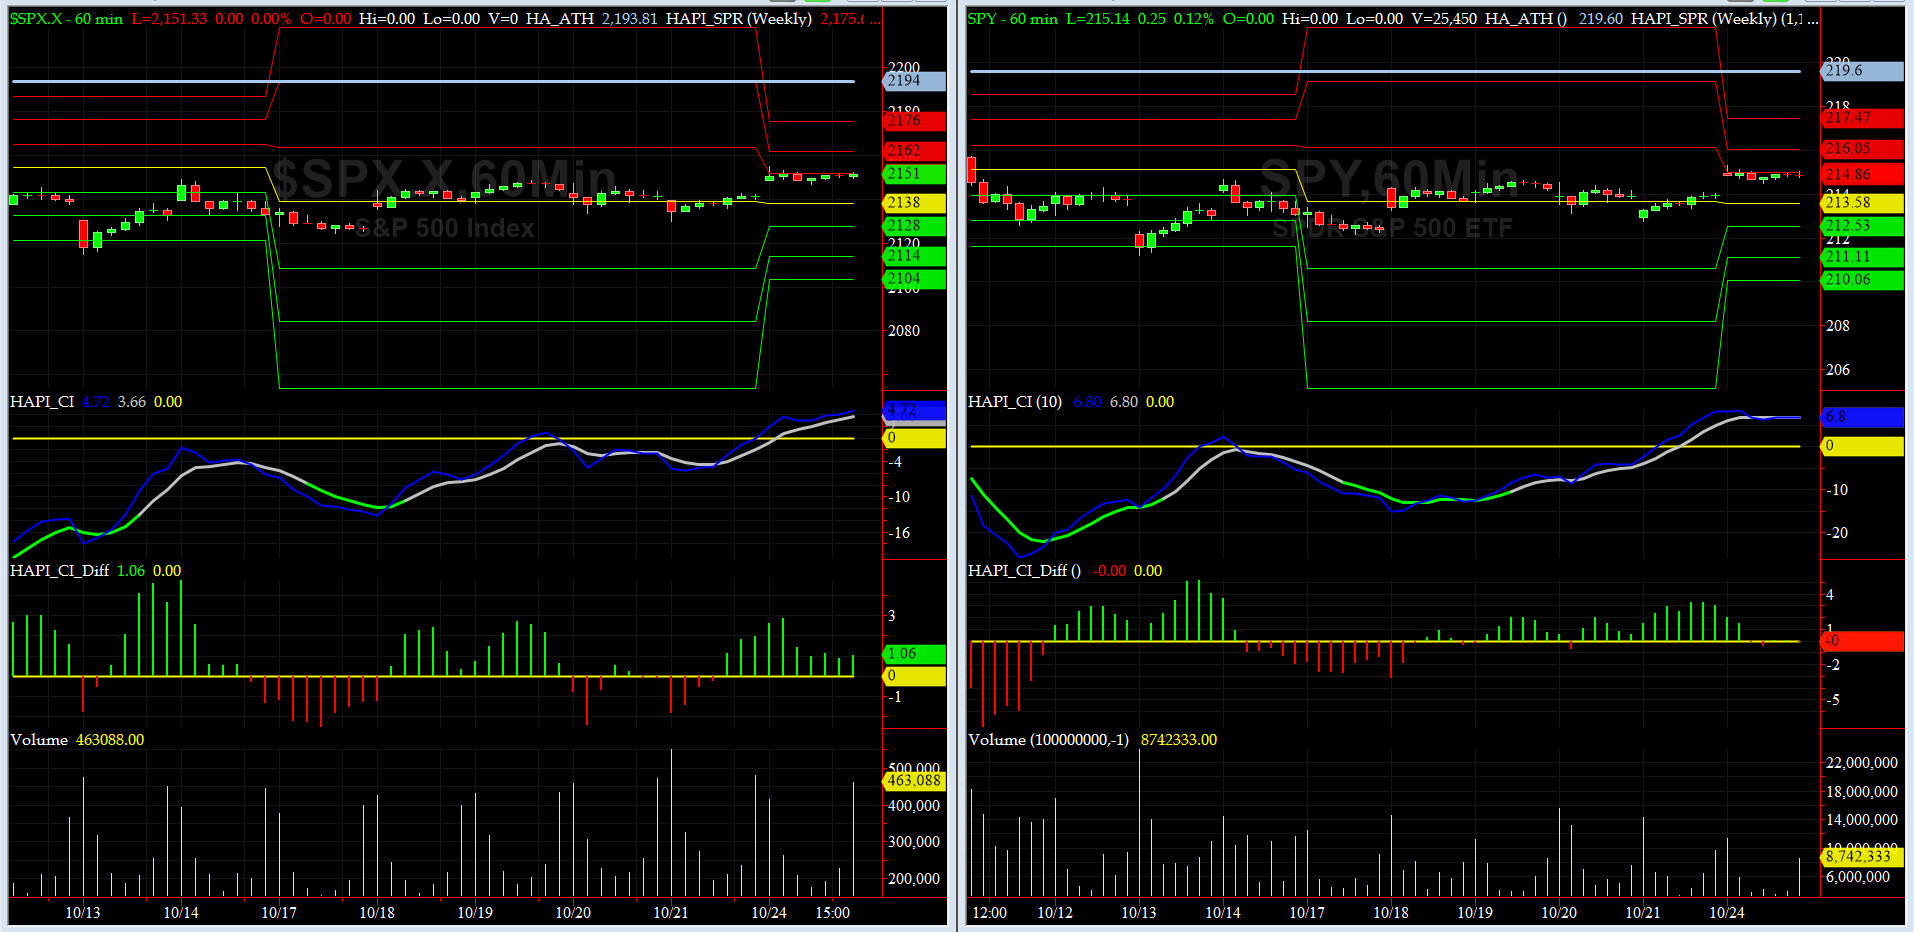
Most recent S&P-500 Cash Index (SPX): 2141.16 up +8.18 (up +0.38%) for the week ending on Friday, October 21st, 2016, which closed just above its -1 sigma.
SPX ALL TIME INTRADAY HIGH = 2193.81 (reached on Monday, August 15, 2016)
SPX ALL TIME CLOSING HIGH = 2190.15 (reached on Monday, August 15, 2016)
Current DAILY +2 Sigma SPX = 2174 with WEEKLY +2 Sigma = 2223
Current DAILY 0 Sigma (20 day MA) SPX = 2149 with WEEKLY 0 Sigma = 2144
Current DAILY -2 Sigma SPX = 2124 with WEEKLY -2 Sigma = 2065
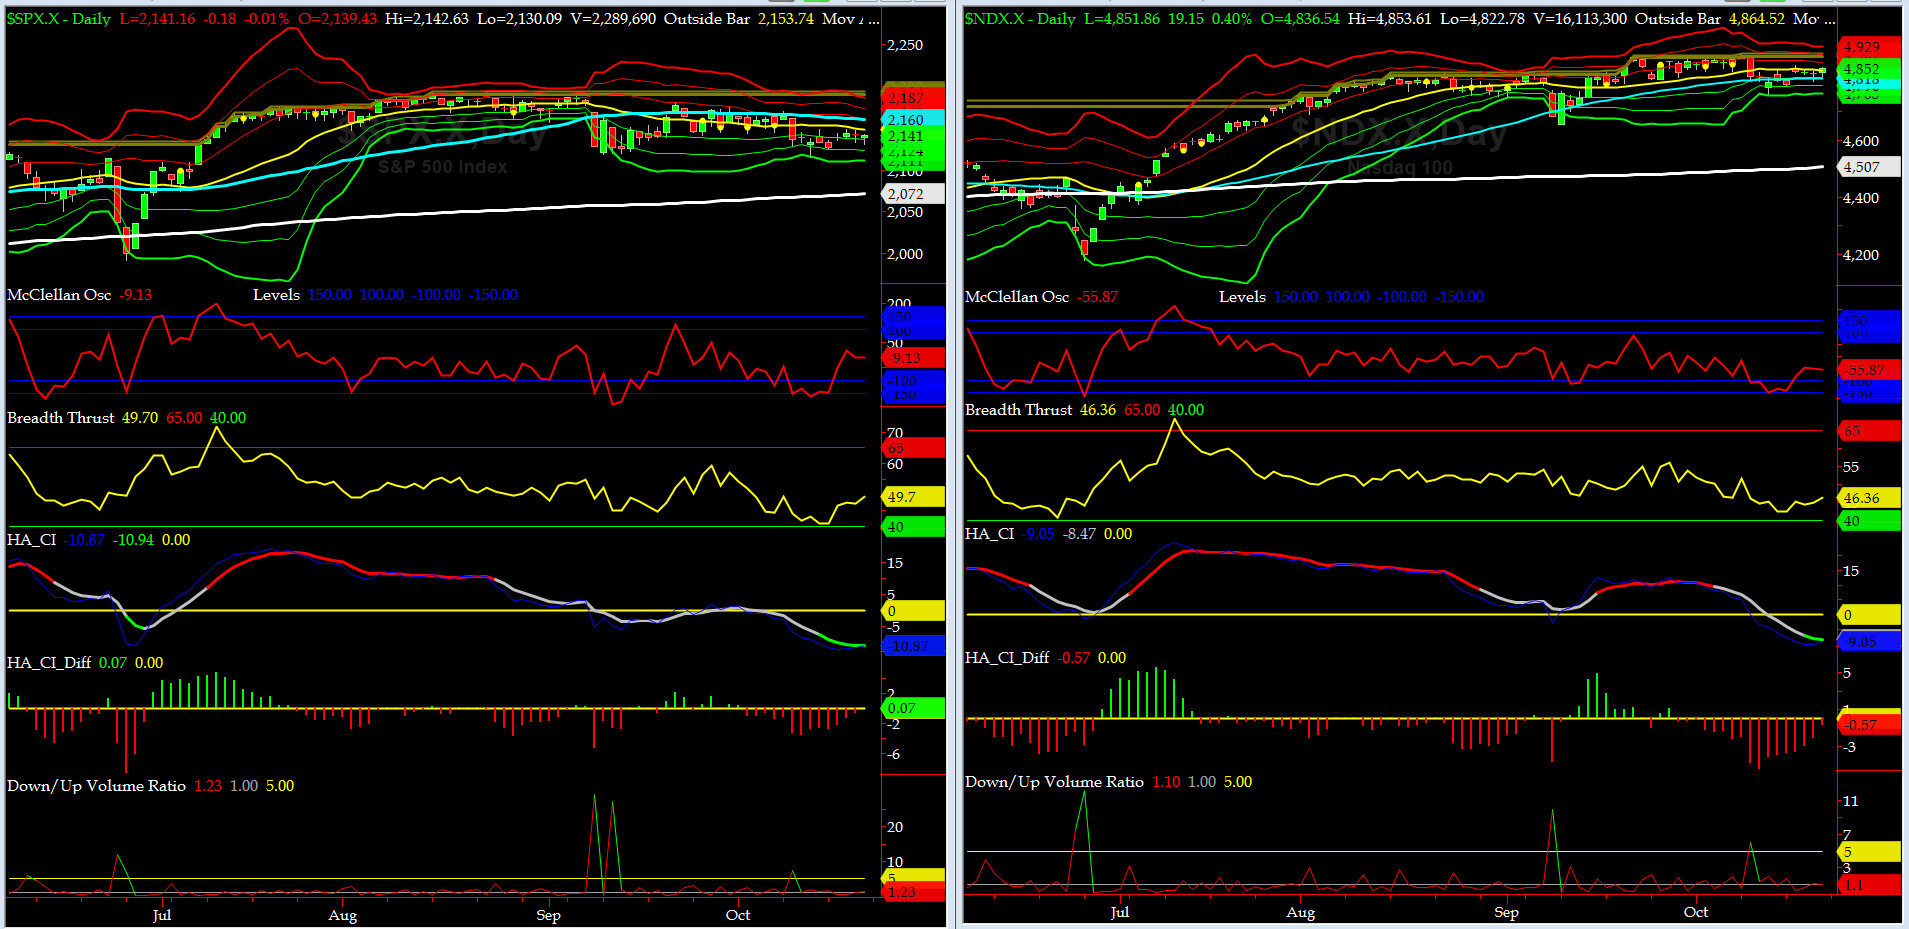
NYSE McClellan Oscillator = -9 (-150 is start of the O/S area; around -275 to -300 area or lower, we go into the �launch-pad� mode, over +150, we are in O/B area)
NYSE Breadth Thrust = 49.7 (40 is considered as oversold and 65 as overbought)
This week, we have a number of big NYSE & NASDAQ names (AAPL, CAT, BA, TSLA, AMZN, BIDU & GOOGL) reporting their Q3 Earnings and any of them could be a market mover.
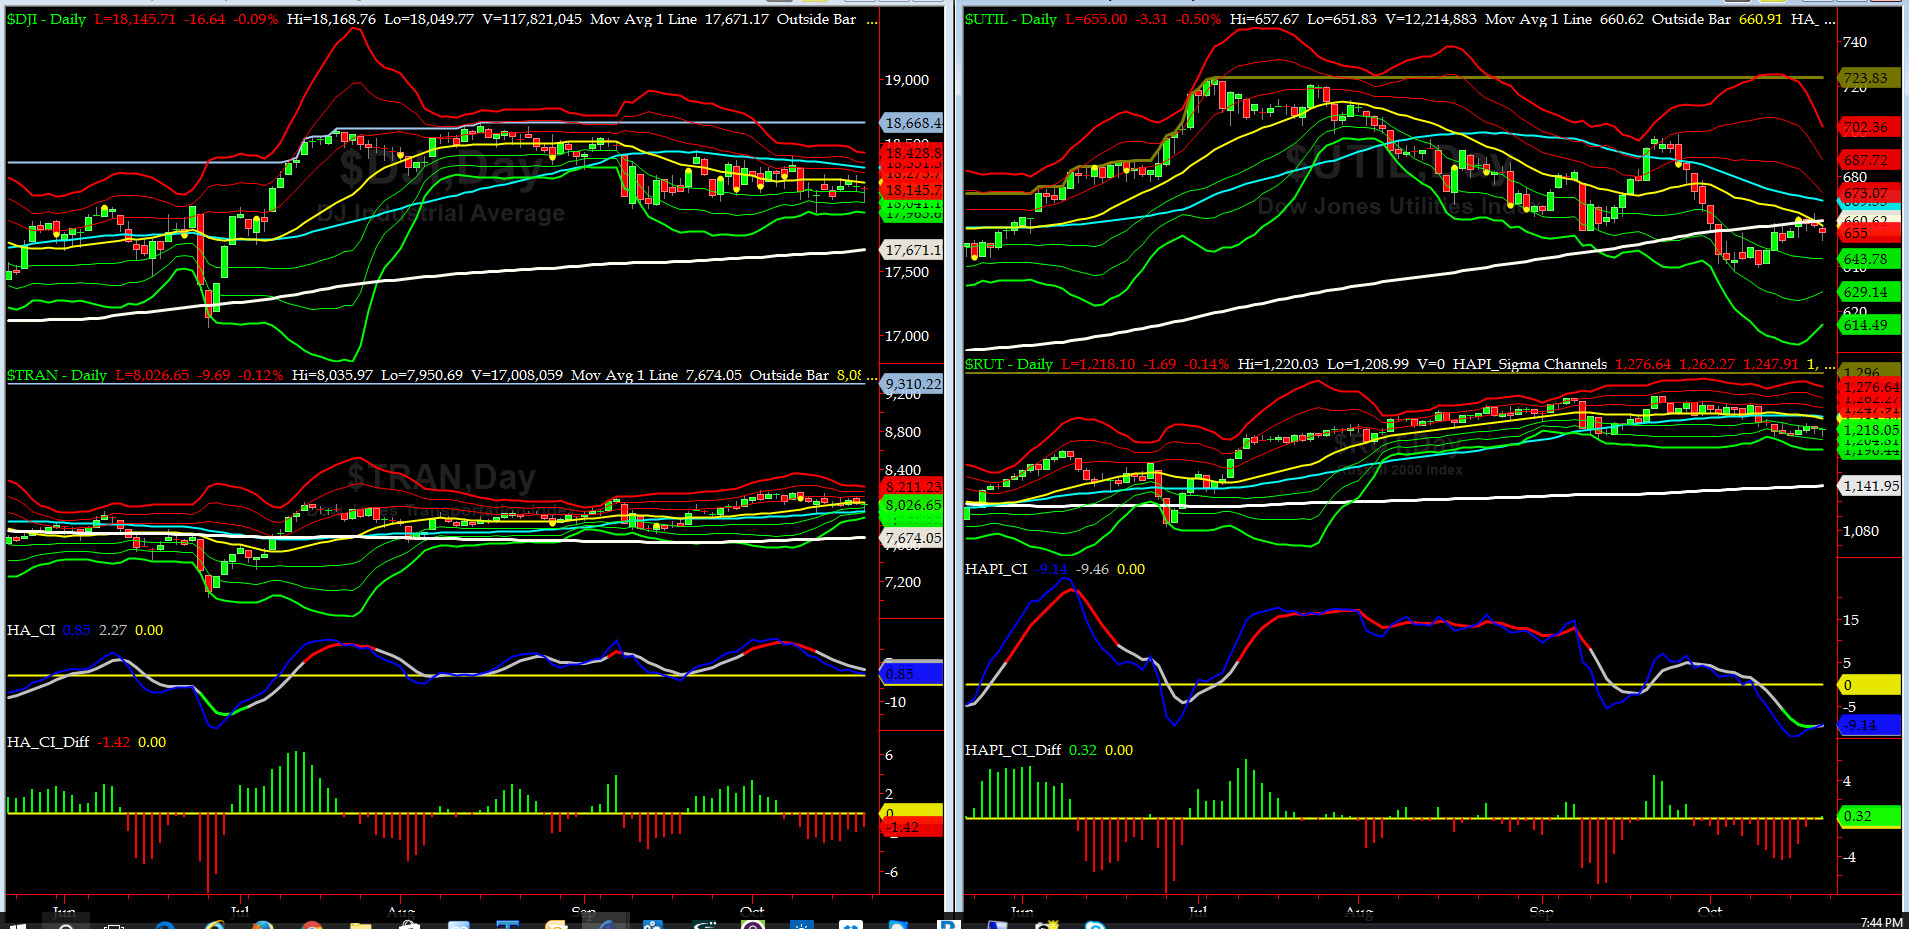
Canaries [in the Coal Mine] Chart for DJ TRAN & RUT Indices
200-Day MA DJ TRAN = 7674 or 4.6% below DJ TRAN (max observed in last 5 yrs = 20.2%, min = -20.3%)
200-Day MA RUT = 1141 or 6.7% below RUT (max observed in last 5 yrs = 21.3%, min = -22.6%)
DJ Transports (proxy for economic conditions 6 to 9 months hence) also had a lackluster week.
Russell 2000 Small Caps (proxy for RISK ON/OFF) had an uneventful week as well. But, we can always blame the Romans for that. LOL.

DeTrenders Charts for SPX, NDX, TRAN & RUT Indices
50-Day MA SPX = 2160 or 0.9 above SPX closed on Friday (max observed in last 5 yrs = +8.6%, min = -9.3%)
200-Day MA SPX = 2072 or 3.3% below SPX (max observed in last 5 yrs = 15.2%, min = -14%)
Currently, only 2 of our 8 De Trenders are negative. The De Trenders for DJ TRAN & RUT will continue to be harbingers of future price behavior in broad indices.
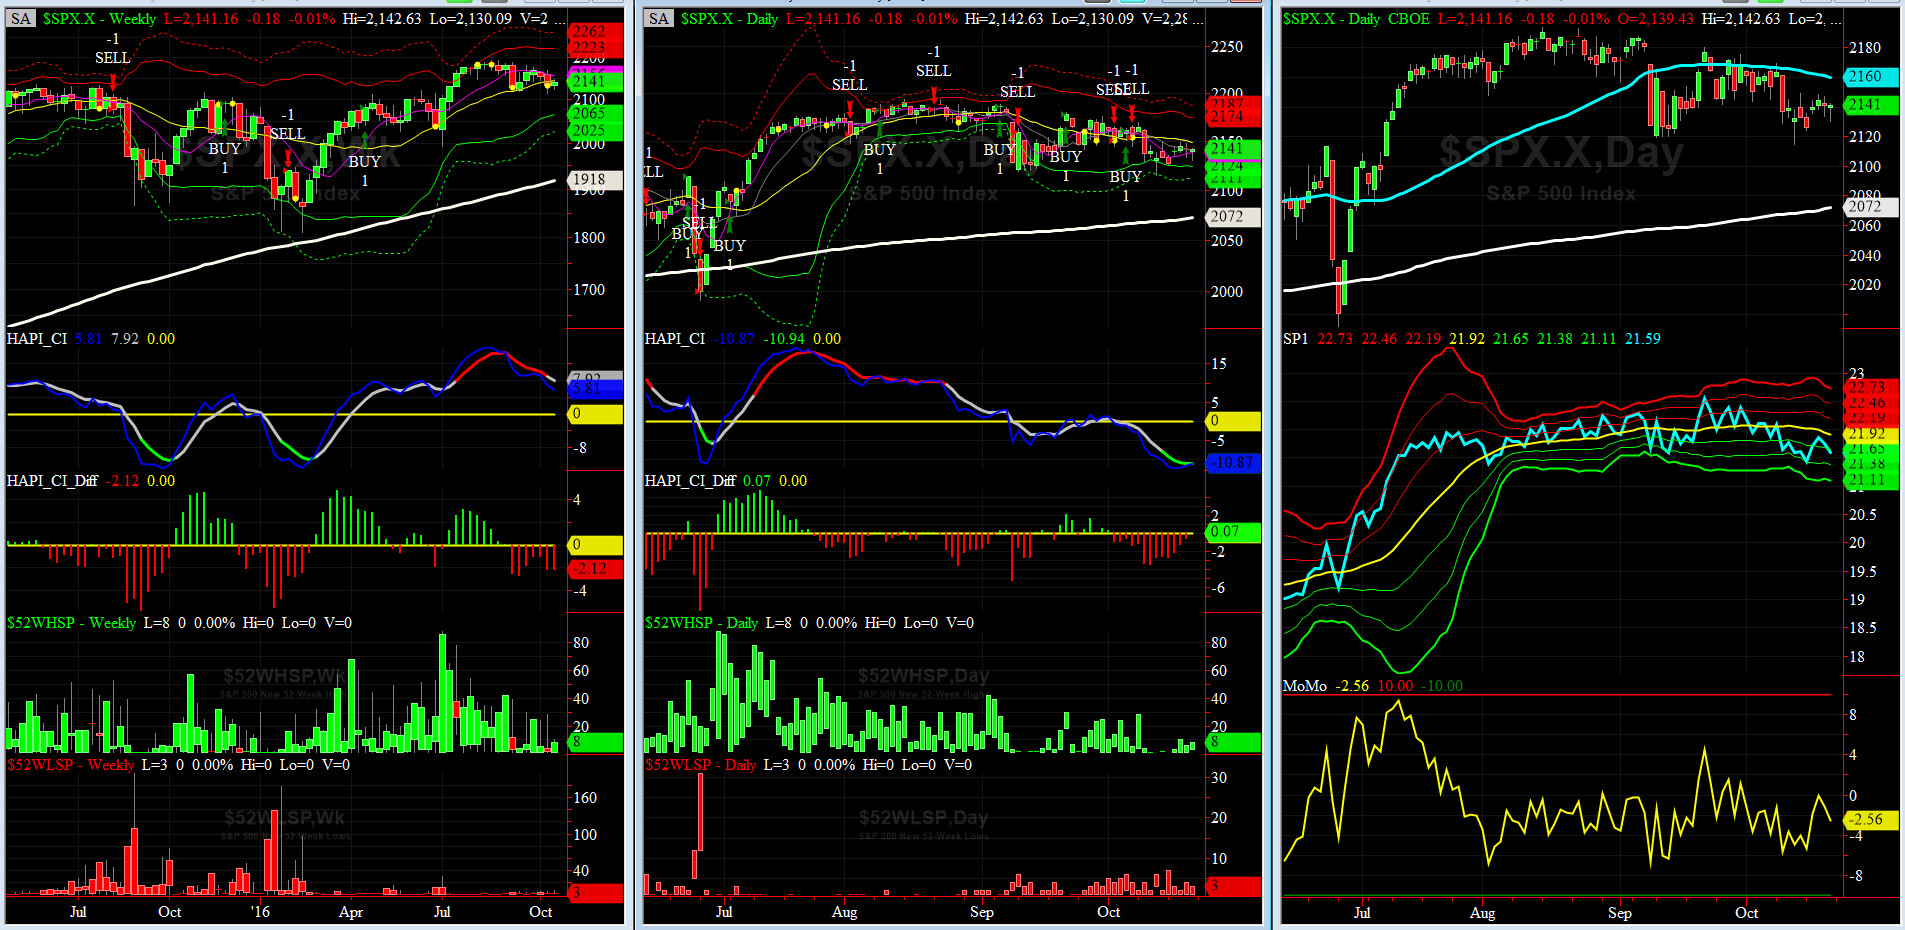
HA_SP1_Momo Chart
WEEKLY Timing Model = on a BUY Signal since Friday 4/15/16 CLOSE at 2081
DAILY Timing Model = on a SELL Signal since Friday 10/07/16 CLOSE at 2153
Max SPX 52wk-highs reading last week = 10 (over 120-140, the local maxima is in)
Max SPX 52wk-Lows reading last week = 7 (over 40-60, the local minima is in)
HA_SP1 = at its -1 sigma channels
HA_Momo = -2.56 (reversals most likely occur above +10 or below -10)
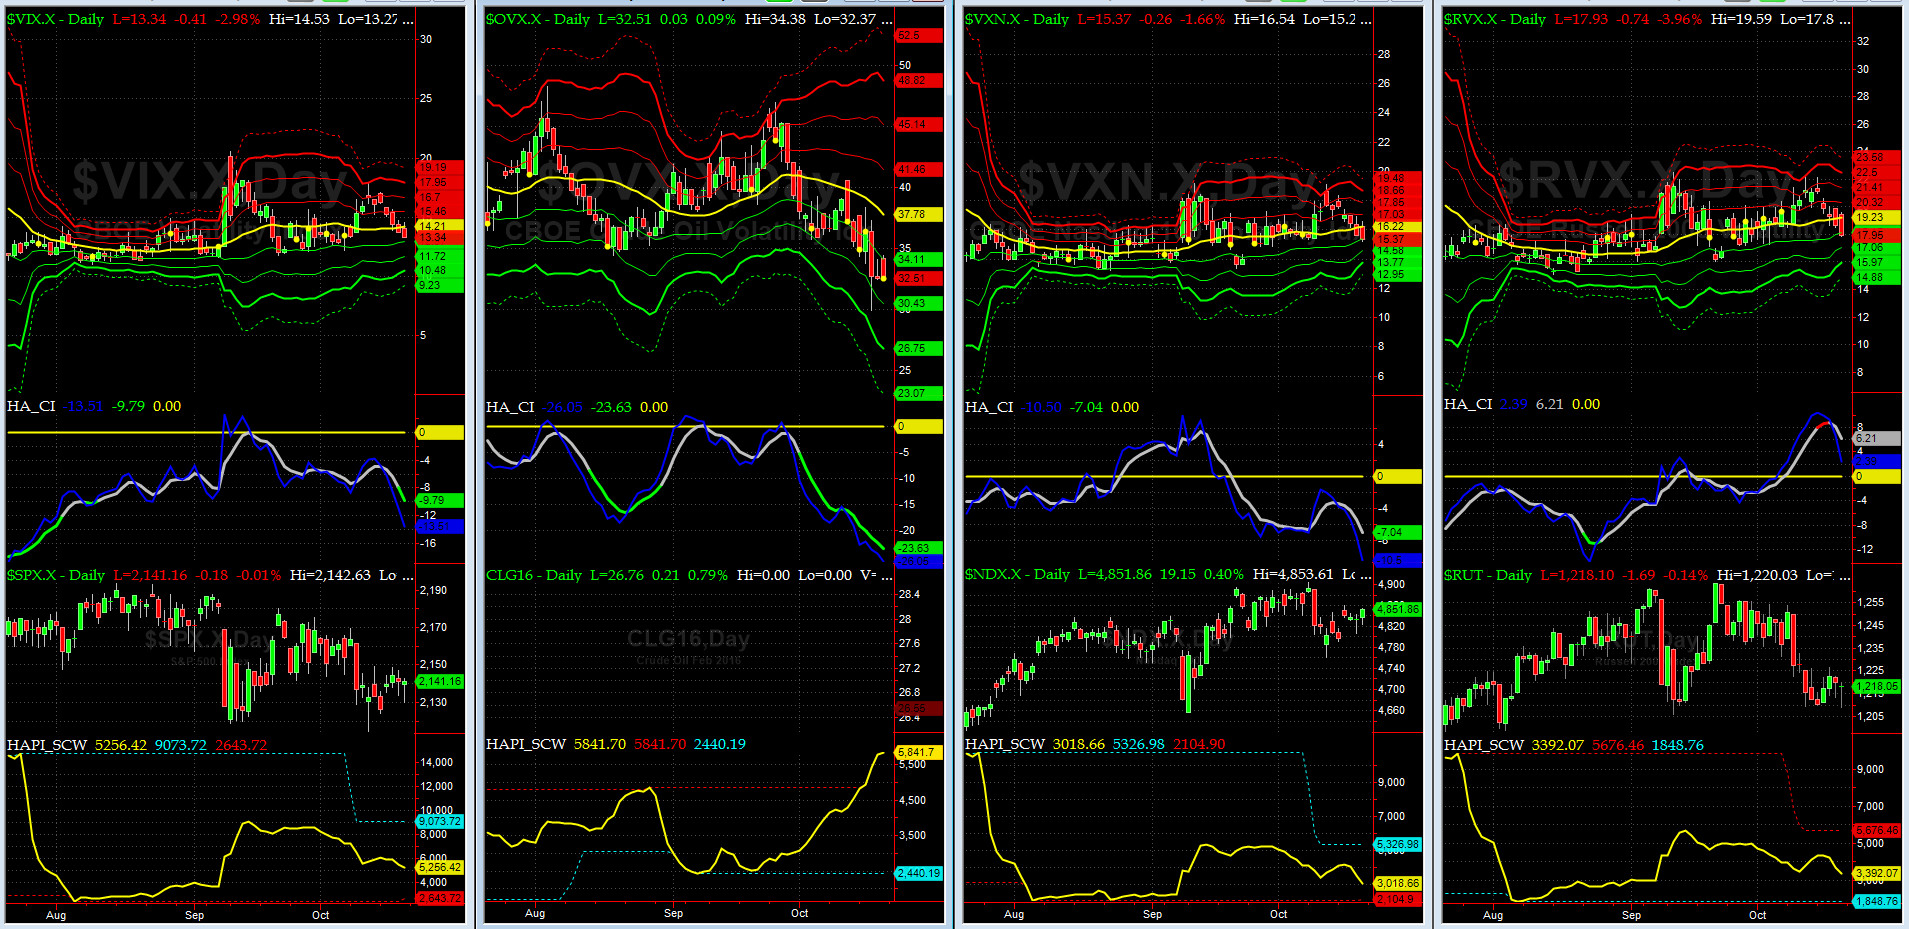
Vol of the Vols Chart
VIX is currently testing its -1 sigma level at 13.34 (remember it�s the VIX�s vol pattern (its sigma channels) that matters, and not the level of VIX itself (this is per Dr. Robert Whaley, a great mentor and the inventor of original VIX, now called VXO). VIX usually peaks around a test of its +4 sigma).
Our newest shock wave has lost its momentum in quick succession.
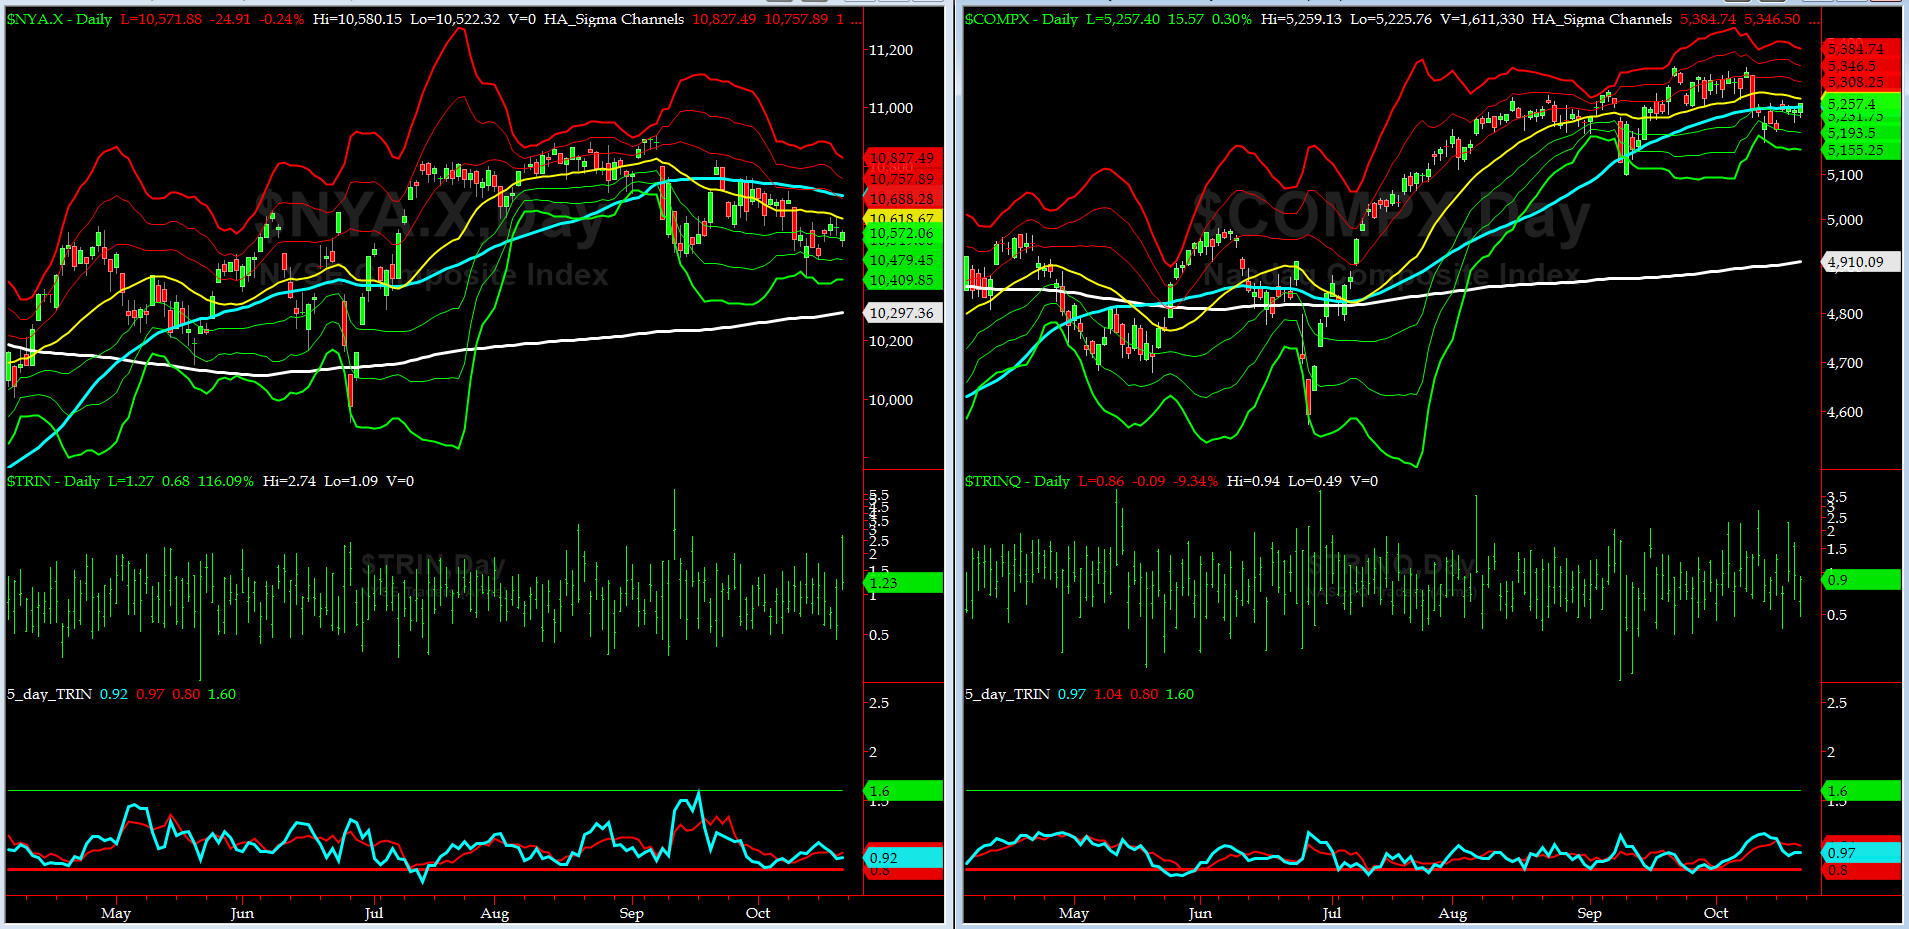
5-day TRIN & TRINQ Charts
NYSE & NASDAQ 5-day TRINs are again in NEUTRAL zone.
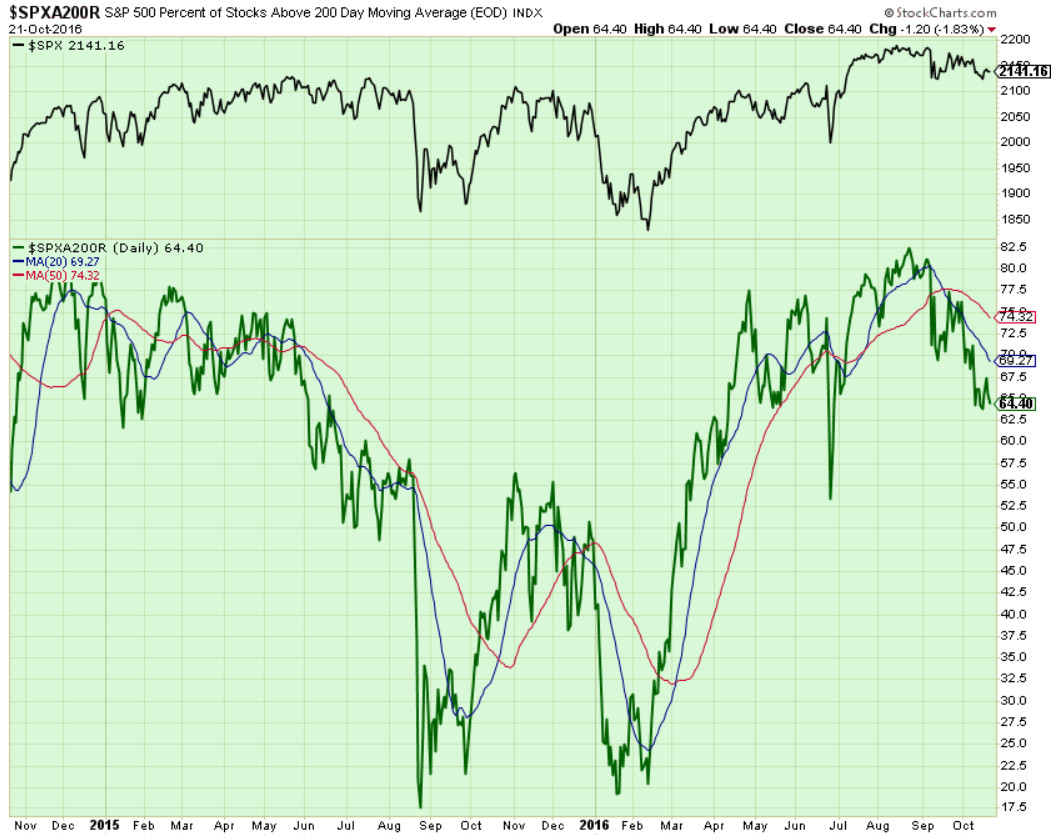
Components of SPX above their respective 200day MA Chart
This scoring indicator sank to 64% on Friday. Still, my XO (stands for eXecutive Officer, aka, second in command),@Capt_Tiko, is still looking for 55% to 60% zone.
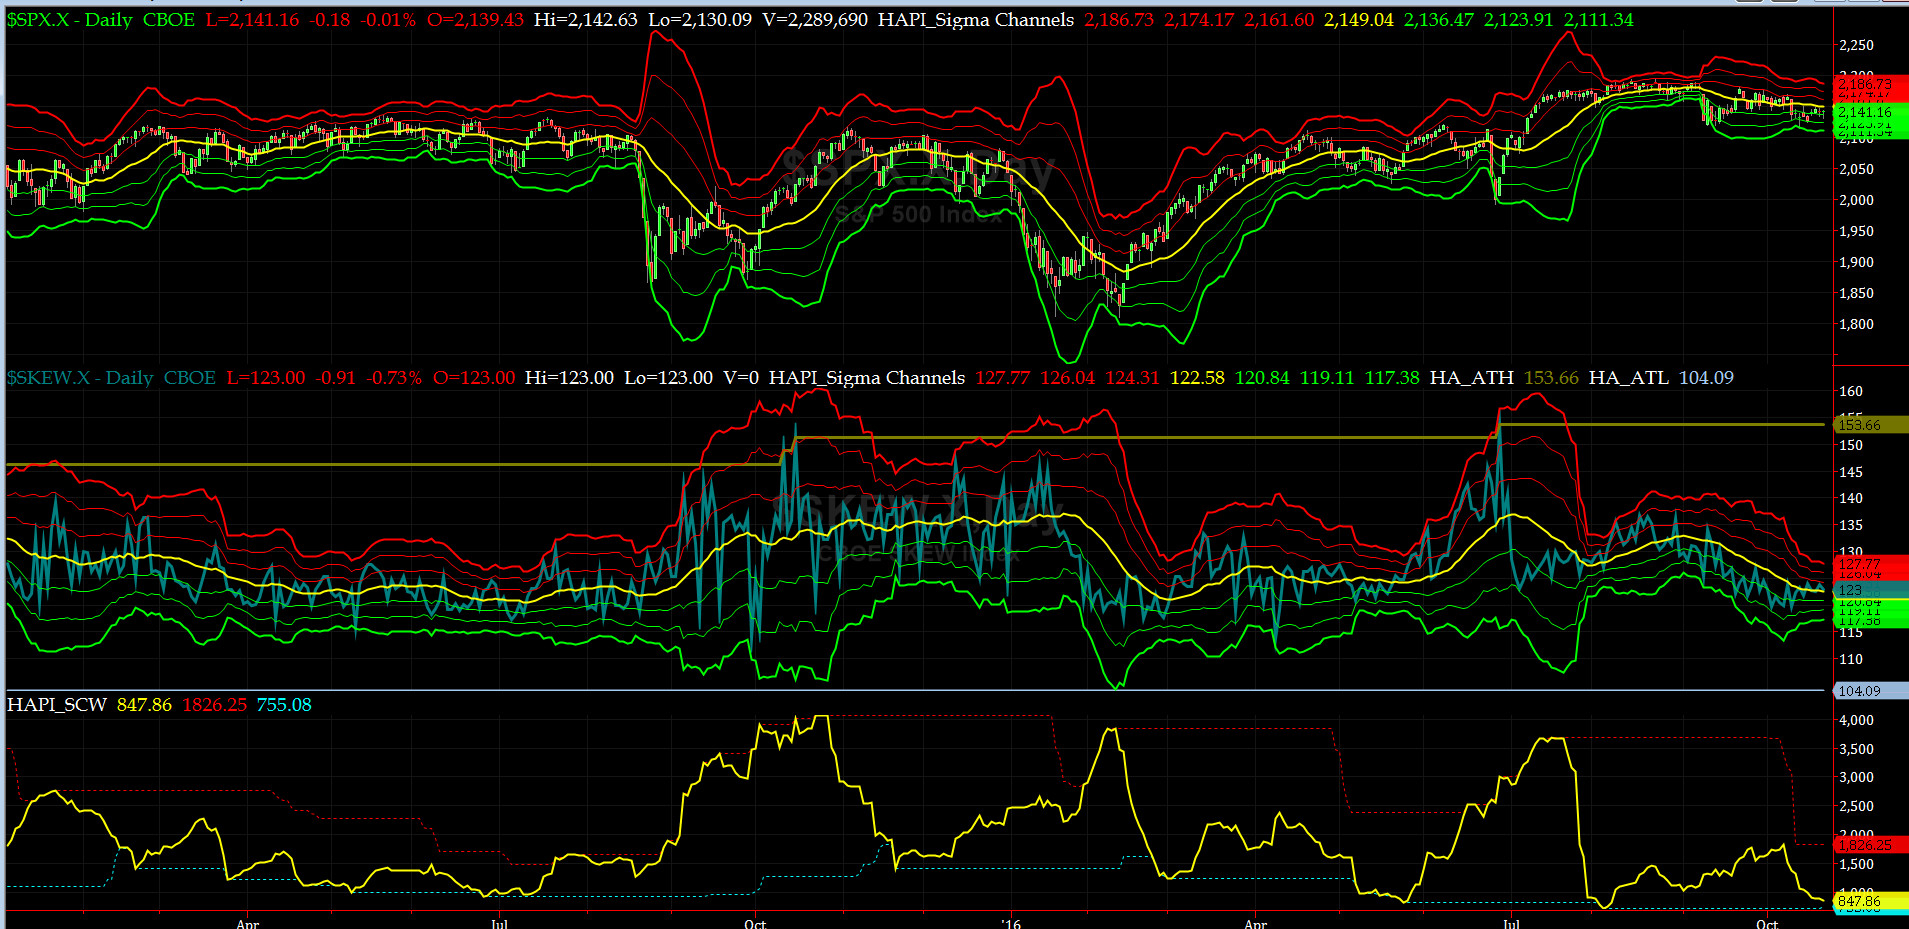
SPX SKEW (Tail Risk) Chart
SPX SKEW (Tail Risk) settled at 123 which is about its zero sigma (normal = 120-125, range 100-150)
All is getting Quieter on the Mid-Western Front. Has Billary45 already been coronated?
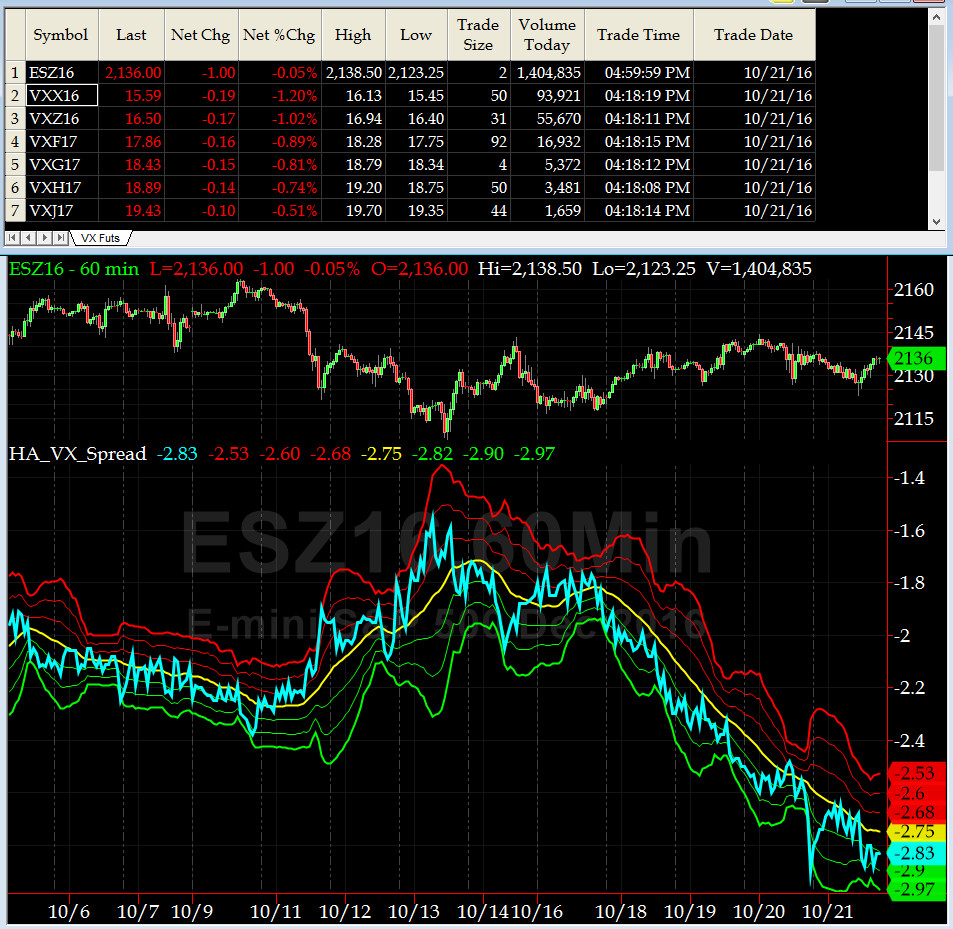
3-month VIX Futures Spread(VX) Chart
Our 3-month VIX Futures Spread (LONG NOV16 & SHORT FEB17) dropped further to -2.83, volatility market signaling potential for further upside in price action.
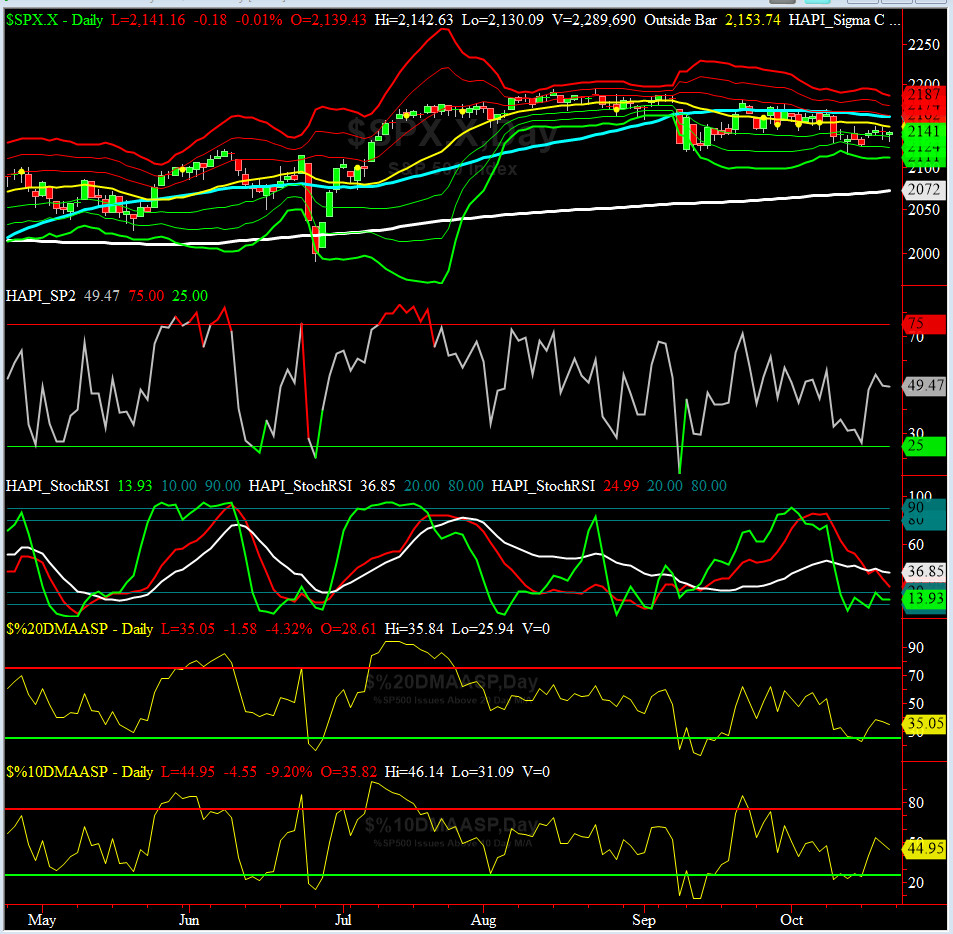
HA_SP2 Chart
HA_SP2 = 49.5 (Buy signal <= 25, Sell Signal >= 75)
This indicator is in its neutral zone.
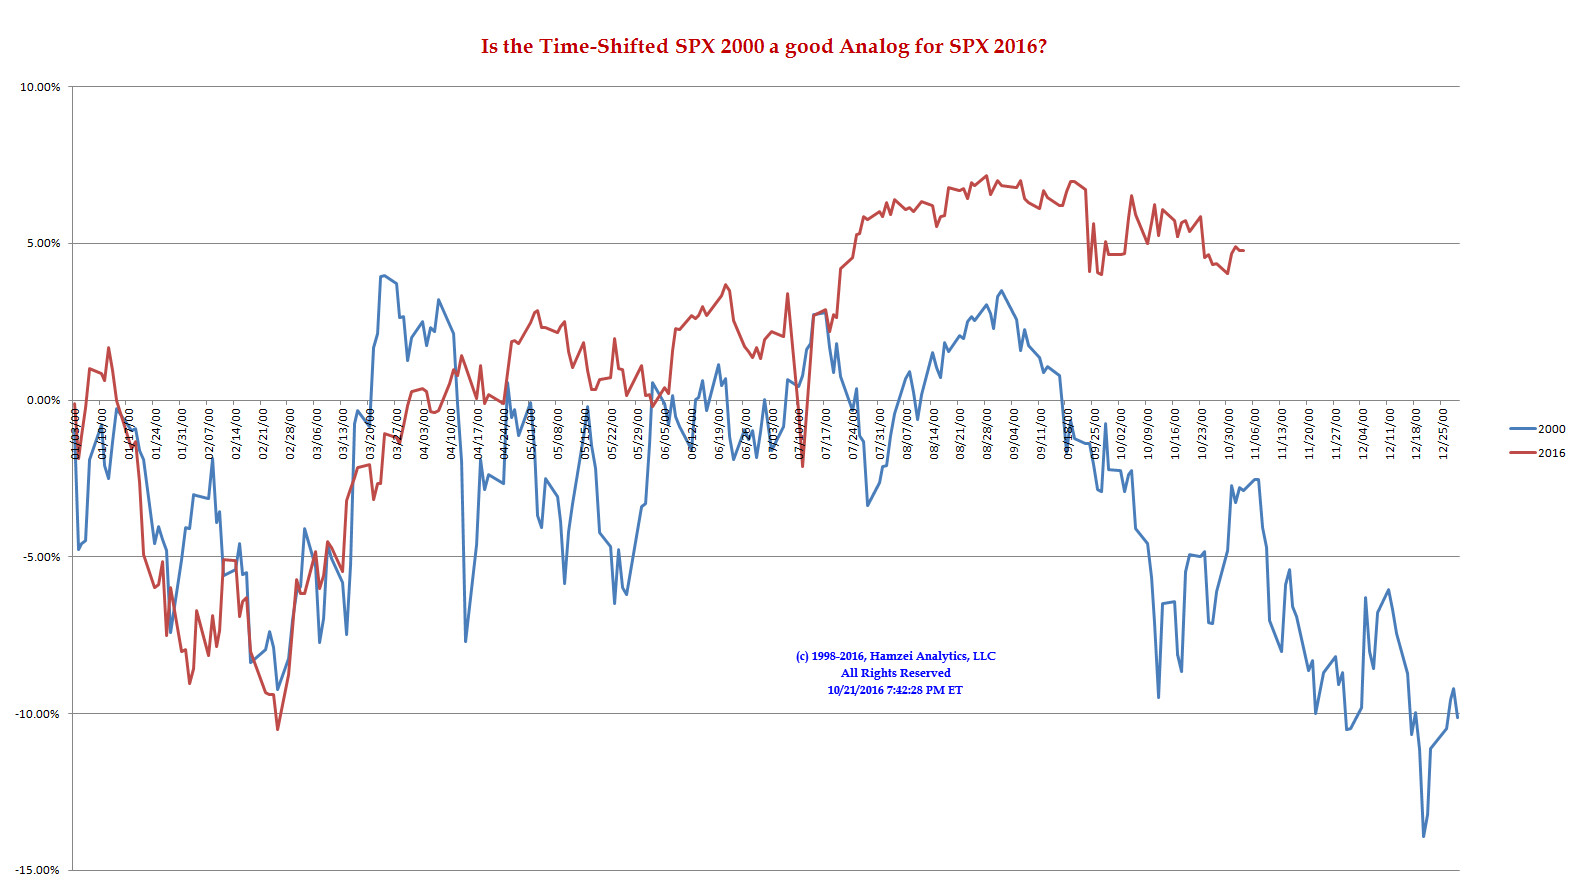
SPX 2000 Analog for SPX 2016
Will the other shoe drop? Fed is acting as insurer of last resort and selling AuntieJanet Puts as a discount (yes, Maury likes that. Actually to be correct, we must state Maury likes anything on a discount). LOL.
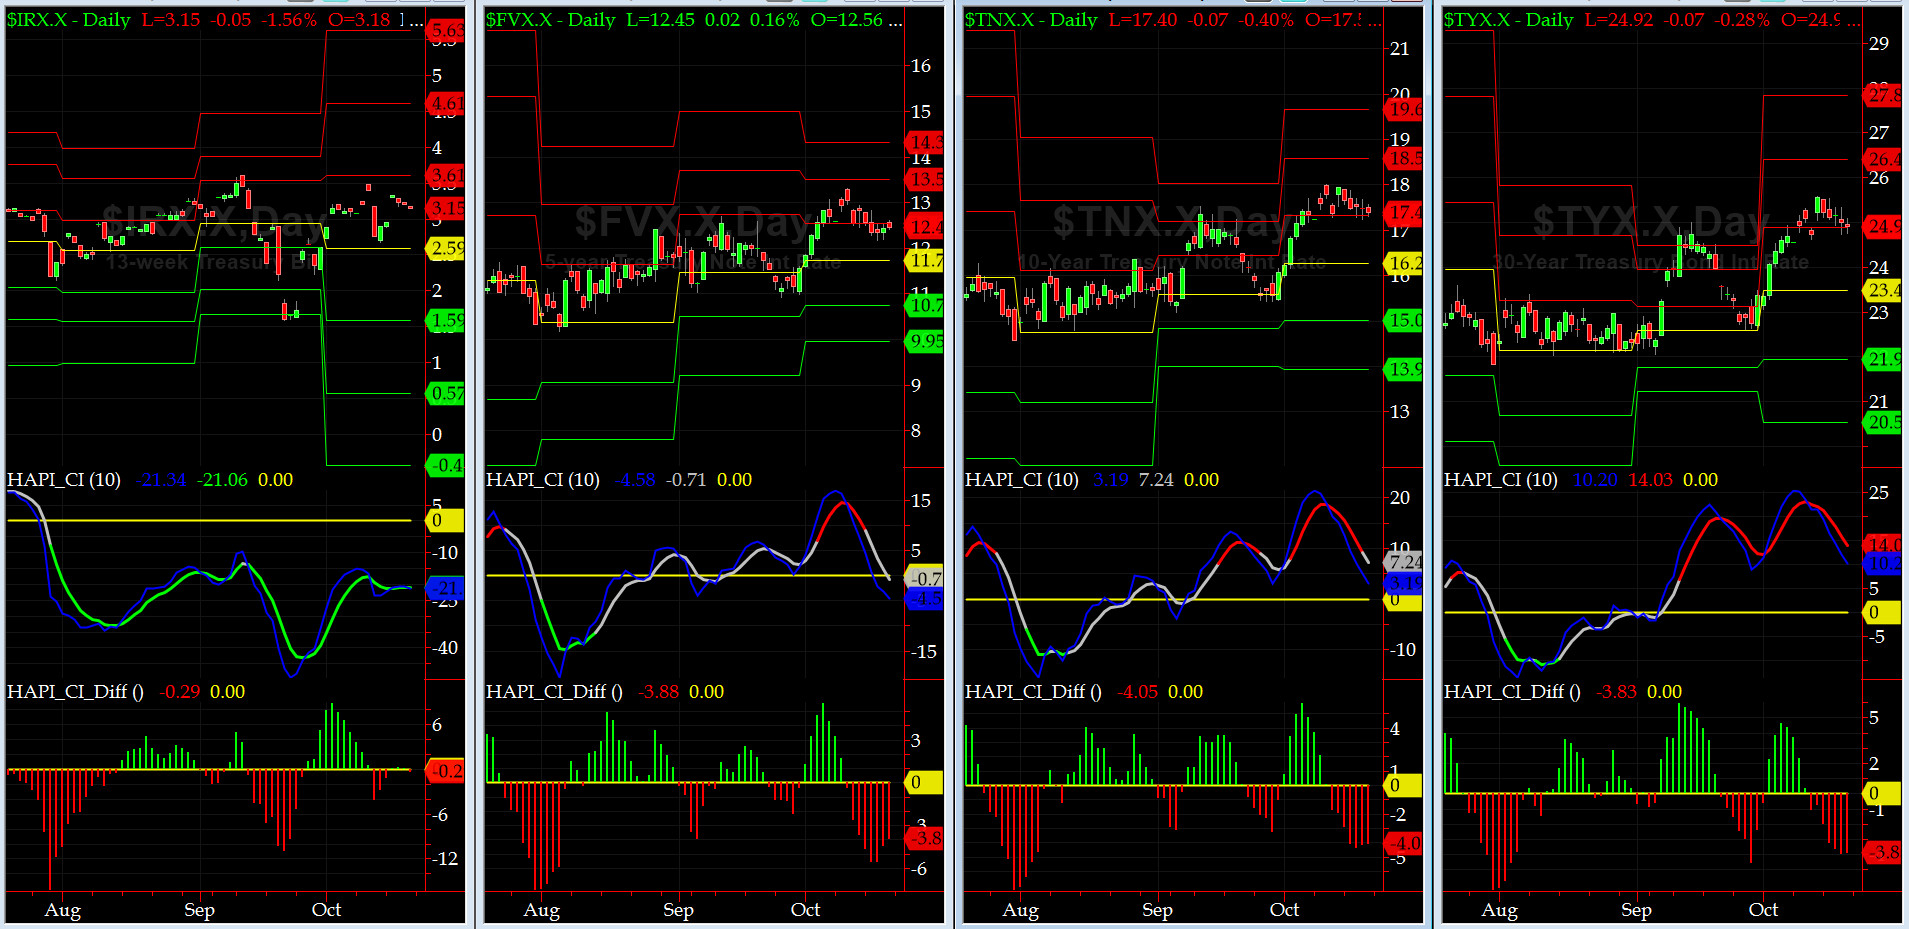
US Treasury T-Notes & T-Bonds Yields Chart
The YTMs on Treasury Complex finally pulled back last week but only at the margin.
Fari Hamzei
|


 Proactive Market Timing