|
Sunday, November 6, 2016, 1430ET
Market Timing Charts, Analysis & Commentary for Issue #166
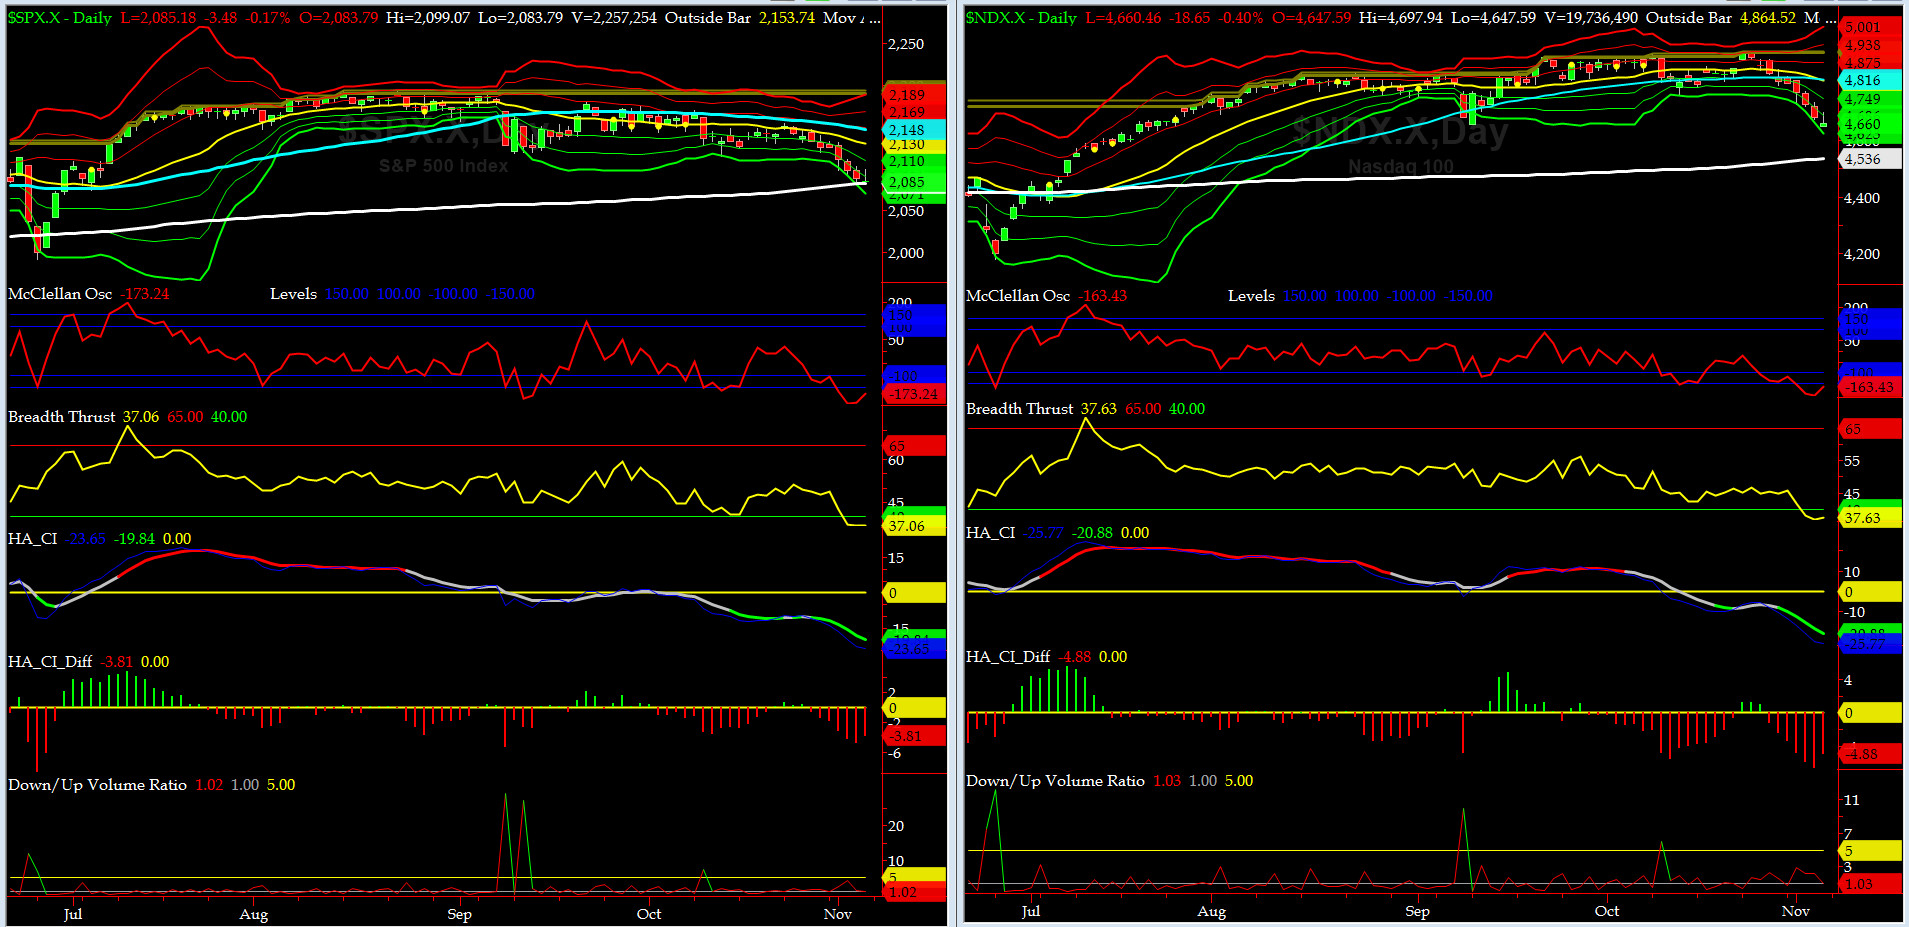
Timer Charts of S&P-500 Cash Index (SPX) + NASDAQ-100 Cash Index (NDX)
Most recent S&P-500 Cash Index (SPX): 2085.18 down 41.23 (down -1.94%) for the week ending on Friday, November 4th, 2016, which closed just about its -2.5 sigma and its 200-day MovAvg.
SPX ALL TIME INTRADAY HIGH = 2193.81 (reached on Monday, August 15, 2016)
SPX ALL TIME CLOSING HIGH = 2190.15 (reached on Monday, August 15, 2016)
Current DAILY +2 Sigma SPX = 2169 with WEEKLY +2 Sigma = 2220
Current DAILY 0 Sigma (20 day MA) SPX = 2130 with WEEKLY 0 Sigma = 2146
Current DAILY -2 Sigma SPX = 2091 with WEEKLY -2 Sigma = 2072
NYSE McClellan Oscillator = -173 (-150 is start of the O/S area; around -275 to -300 area or lower, we go into the �launch-pad� mode, over +150, we are in O/B area)
NYSE Breadth Thrust = 37.1 (40 is considered as oversold and 65 as overbought)
More troubling HRC emails leaked out by WikiLeaks and ensuing gains in a several battleground states by DJT, made the WASH-BOS Elite Corridor nervous and they sold the whole market with vengeance.
Although the selling pressure has been continual in broad indices, we have yet to see the "baby out with the bathwater" being flushed out of torpedo tubes (Navy equivalent of being thrown out of the window). That said, NYSE Down Volume remains timid with no sign of capitulation or exhaustion as of yet. The current stair step down most likely will continue into Tuesday night, ceteris paribus. Only time will tell.
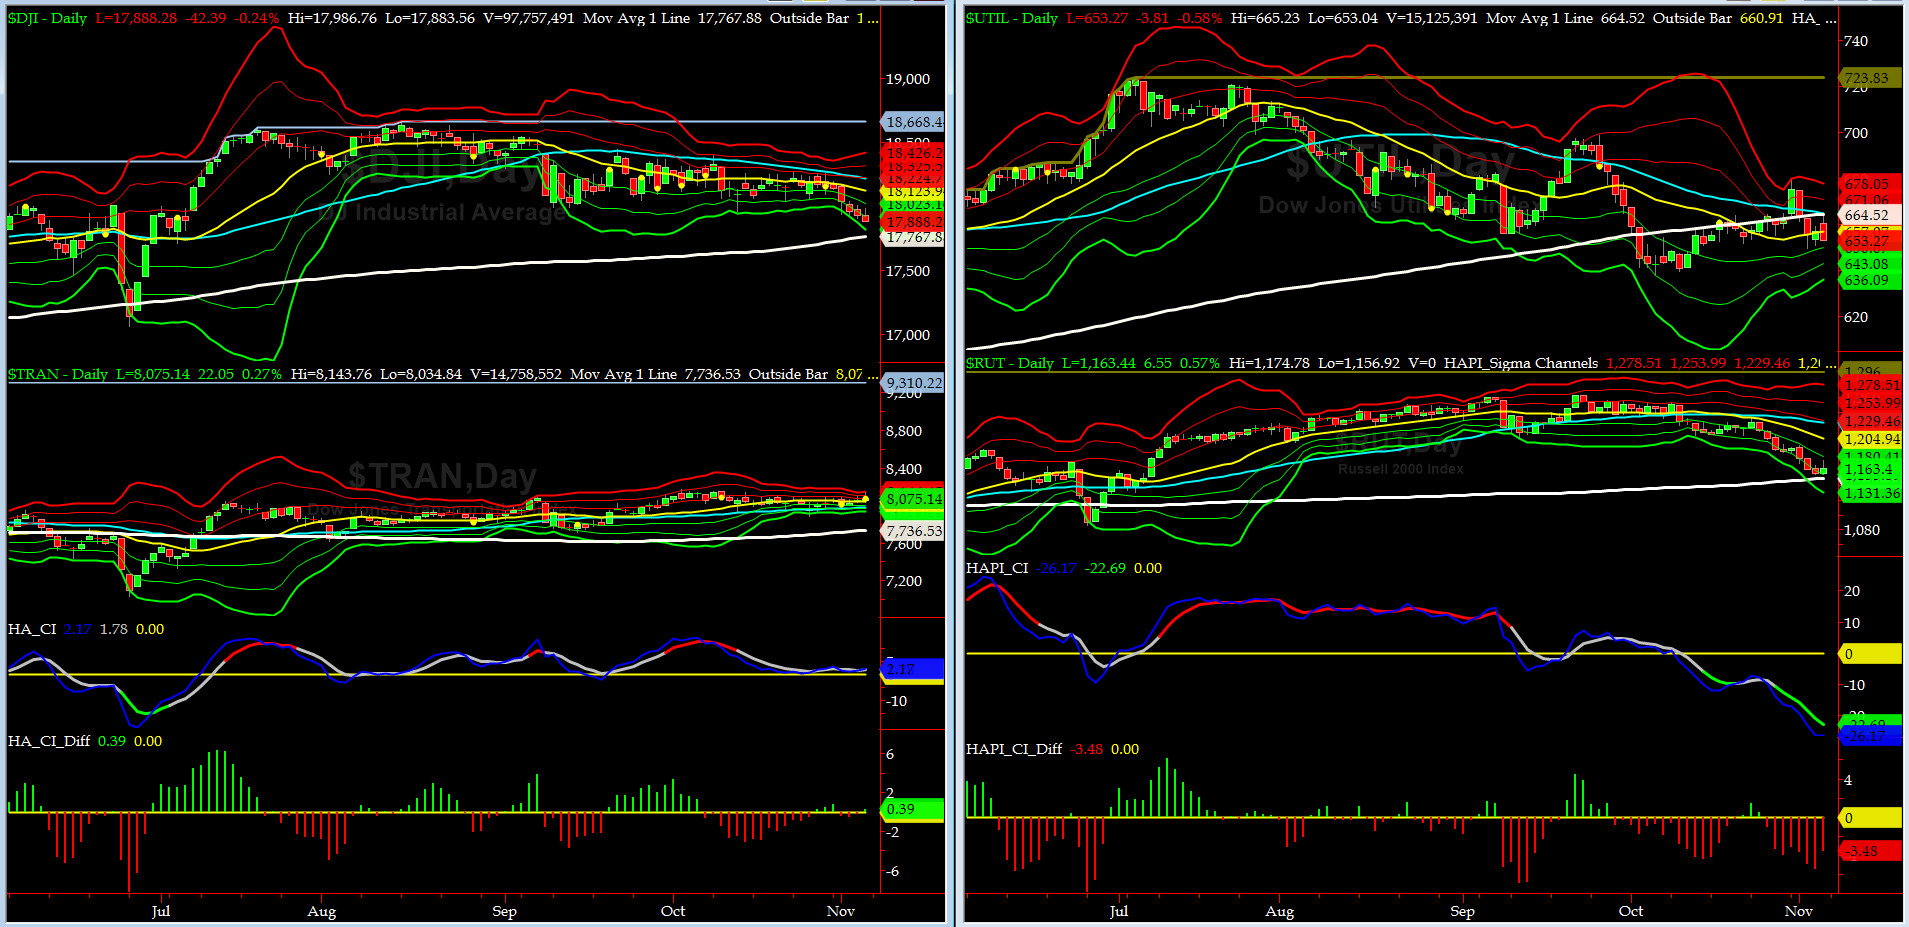
Canaries [in the Coal Mine] Chart for DJ TRAN & RUT Indices
200-Day MA DJ TRAN = 7736 or 4.4% below DJ TRAN (max observed in last 5 yrs = 20.2%, min = -20.3%)
200-Day MA RUT = 1150 or 1.1% below RUT (max observed in last 5 yrs = 21.3%, min = -22.6%)
DJ Transports (proxy for economic conditions 6 to 9 months hence) had another super quiet week.
Russell 2000 small caps (proxy for Risk ON/OFF) continued to come under aggressive selling pressure this past week, signaling RISK is OFF for the time being. RUT found support at its 200-day MA and saw marginal buying on Friday, post OCT NFP report.
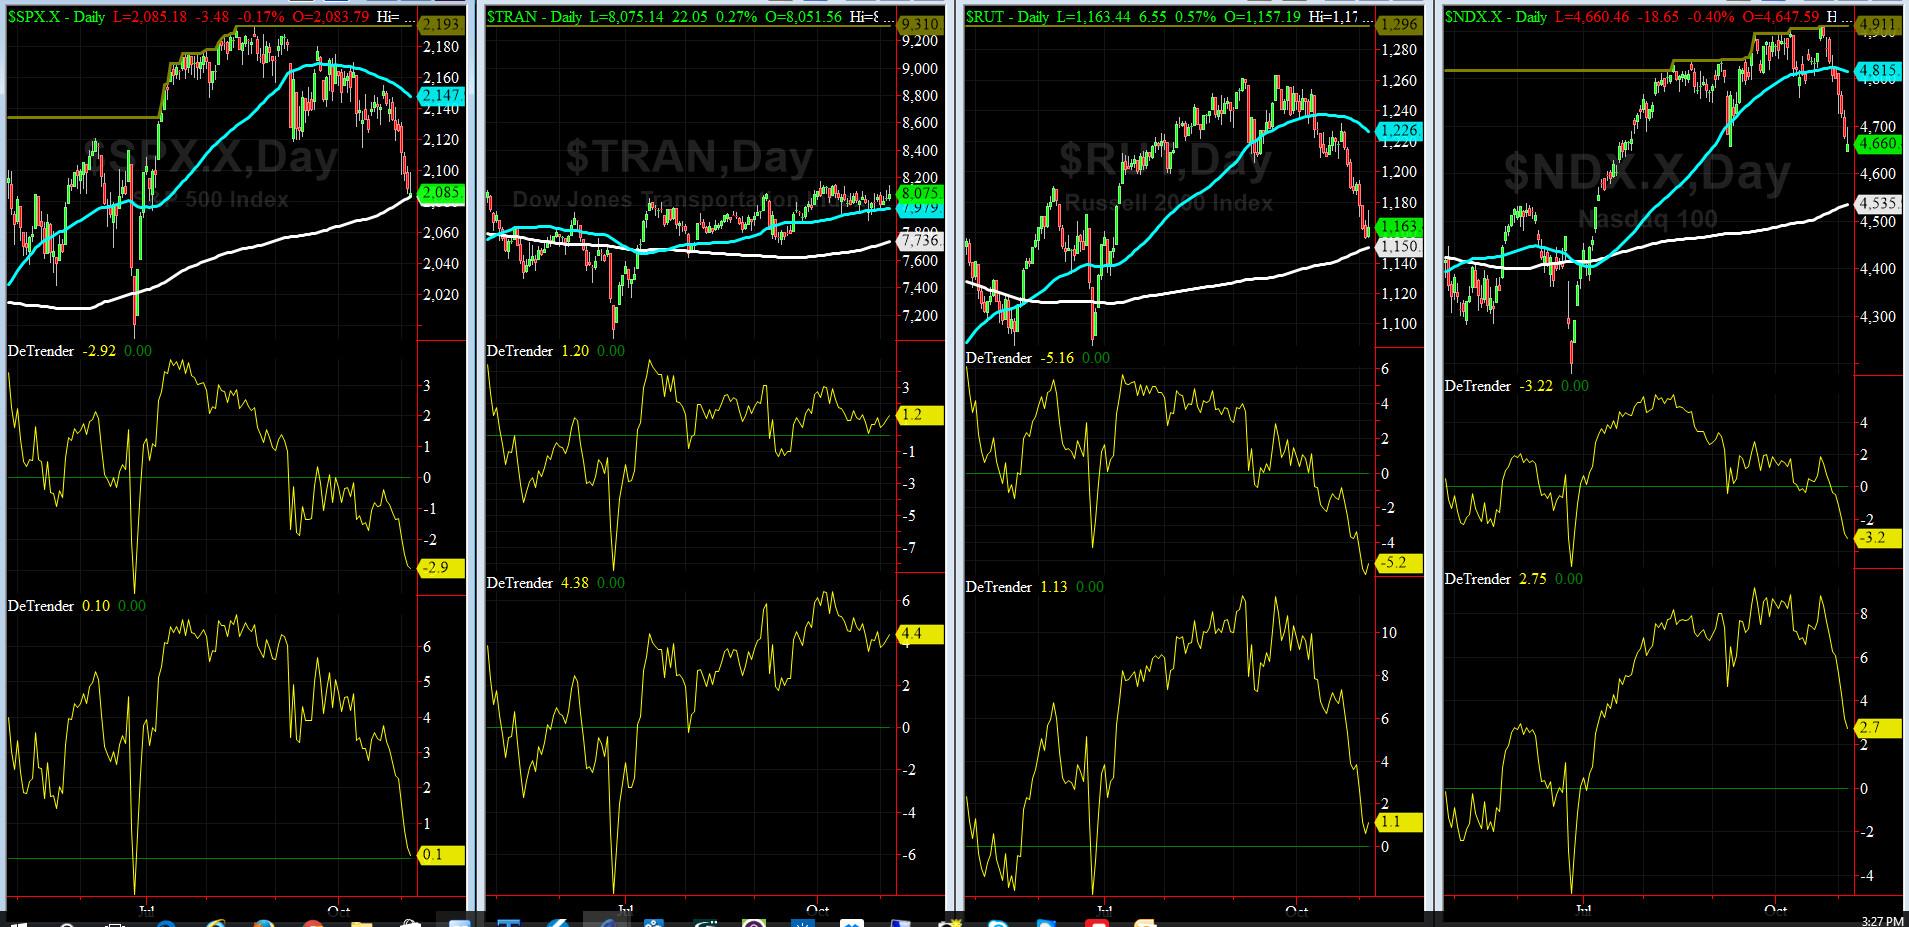
DeTrenders Charts for SPX, NDX, TRAN & RUT Indices
50-Day MA SPX = 2147 or 2.9 above SPX closed on Friday (max observed in last 5 yrs = +8.6%, min = -9.3%)
200-Day MA SPX = 2085 or 0.1% below SPX (max observed in last 5 yrs = 15.2%, min = -14%)
Currently, only 3 of our 8 De Trenders are negative. The De Trenders for DJ TRAN & RUT will continue to be harbingers of future price behavior in broad indices.
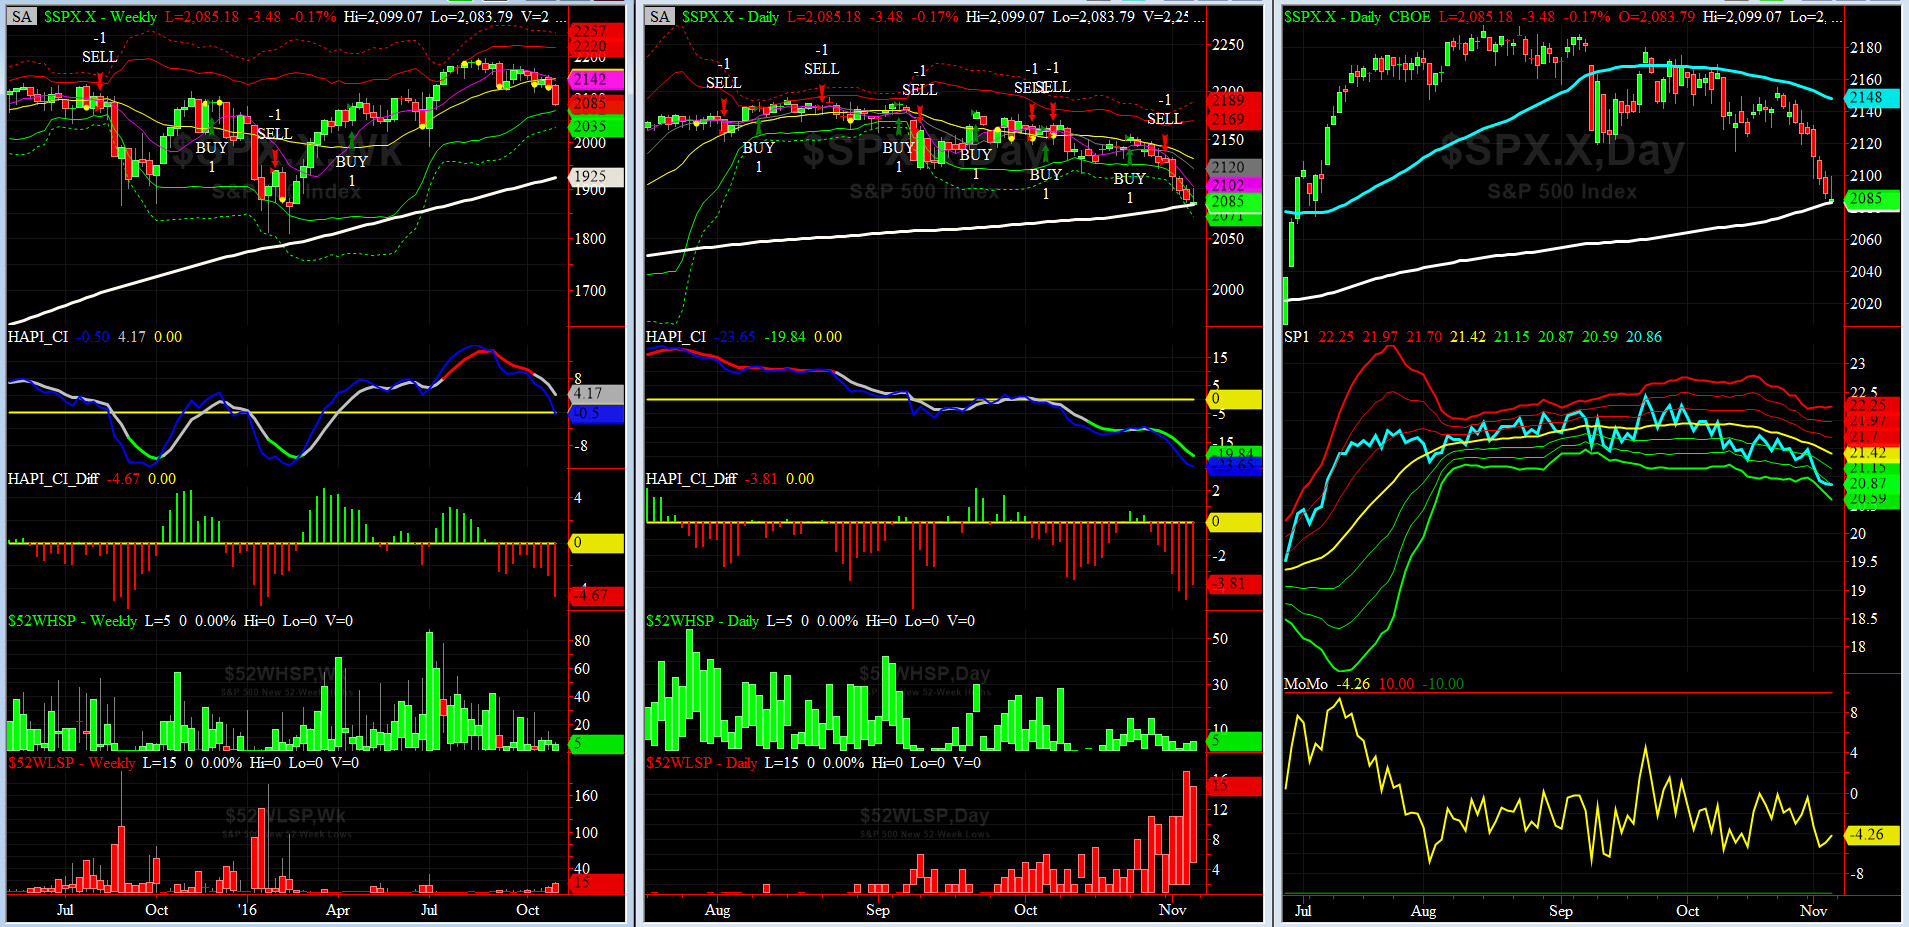
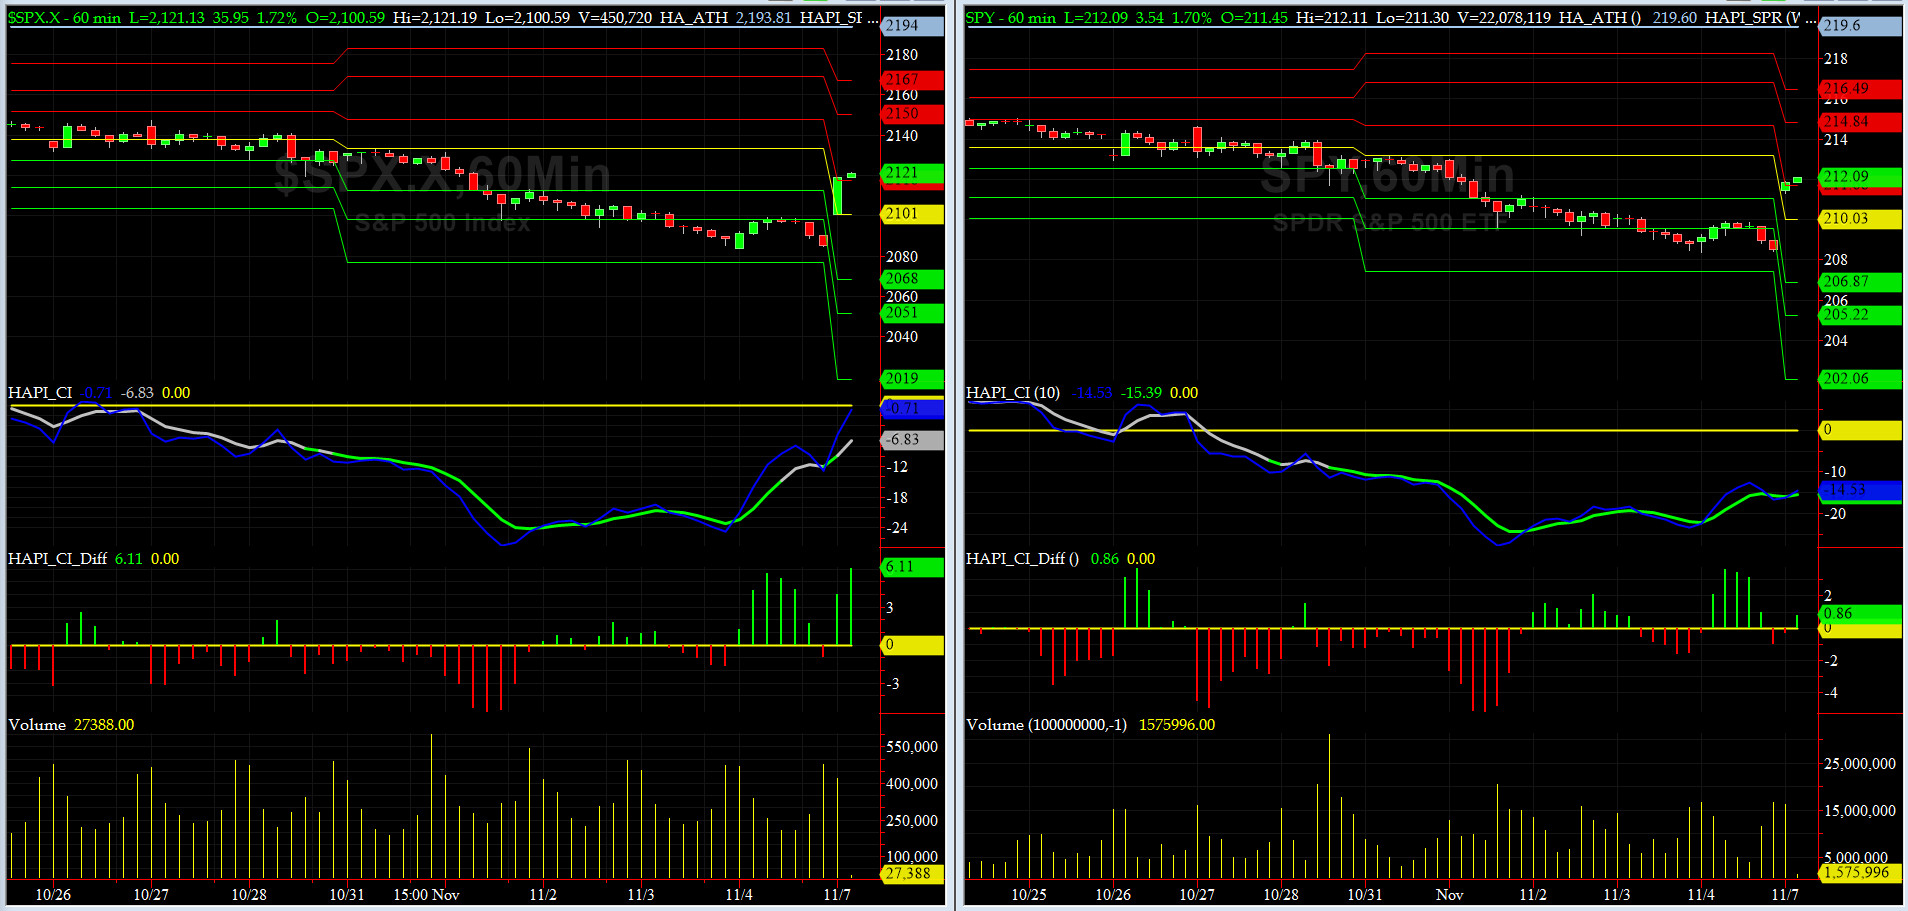
HA_SP1_Momo Chart
WEEKLY Timing Model = on a BUY Signal since Friday 4/15/16 CLOSE at 2081
DAILY Timing Model = on a SELL Signal since Monday 10/31/16 CLOSE at 2126
Max SPX 52wk-highs reading last week = 7 (over 120-140, the local maxima is in)
Max SPX 52wk-Lows reading last week = 17 (over 40-60, the local minima is in)
HA_SP1 = at its -2 sigma channels
HA_Momo = -4.26 (reversals most likely occur above +10 or below -10)
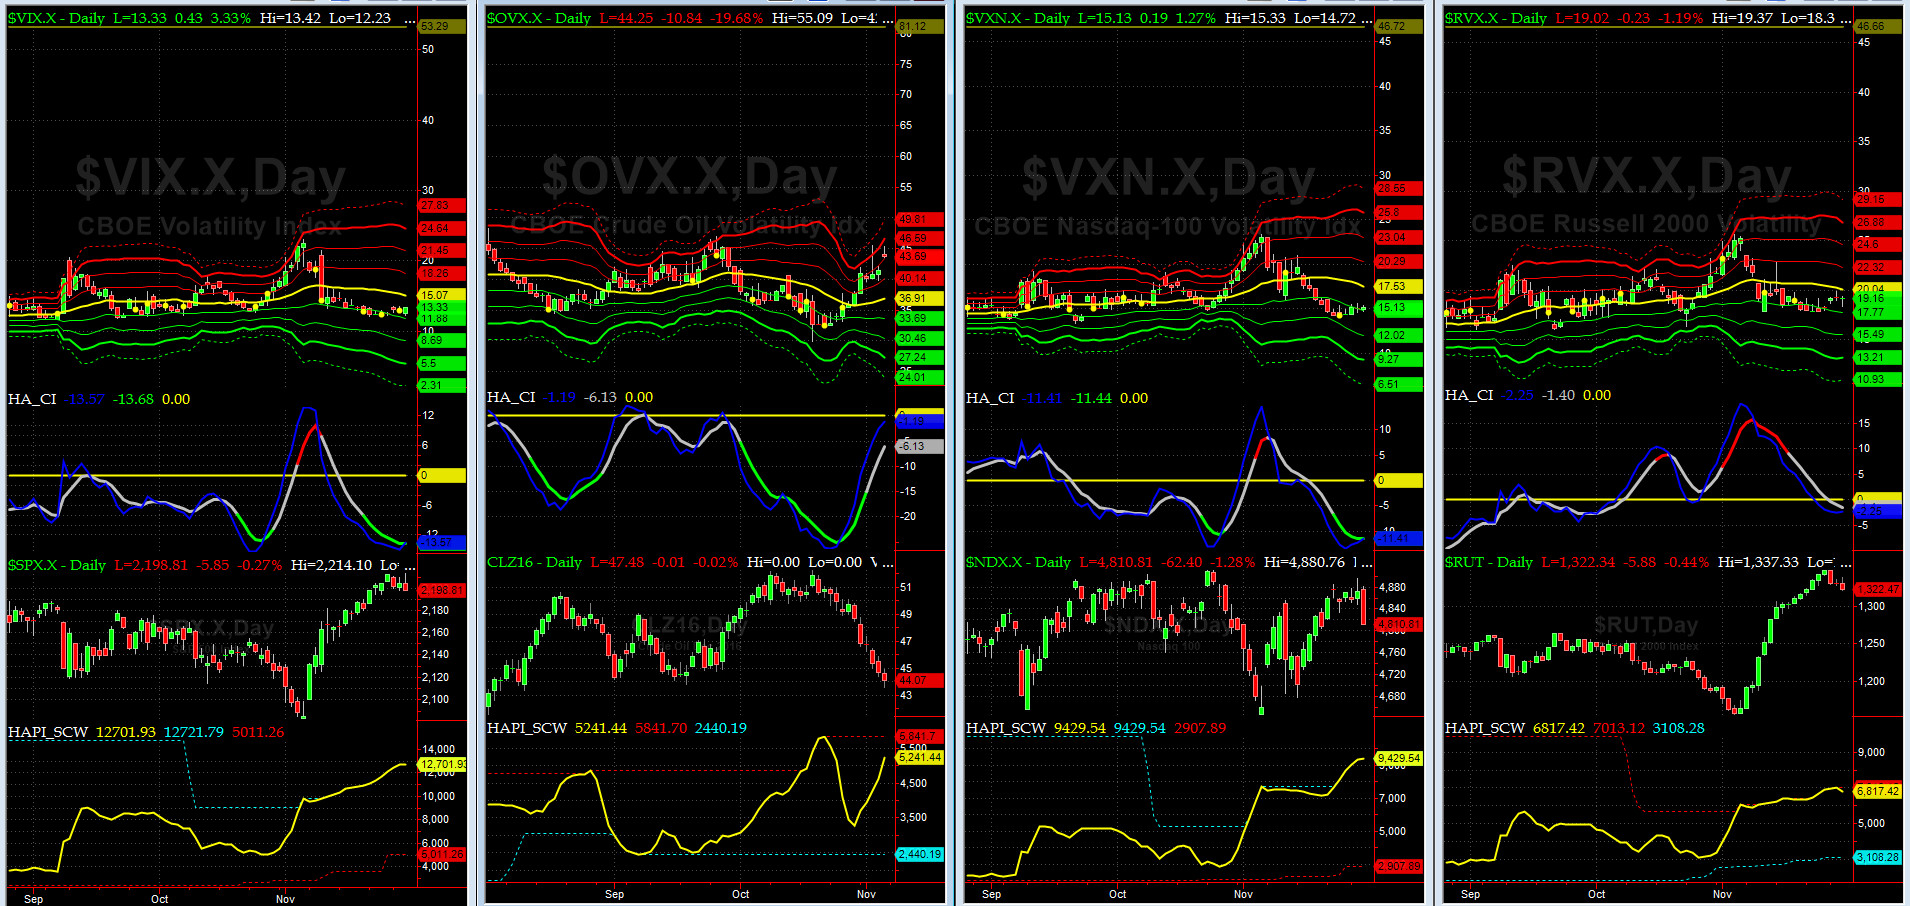
Vol of the Vols Chart
VIX is currently testing its +3 sigma level at 22.51 (remember it�s the VIX�s vol pattern (its sigma channels) that matters, and not the level of VIX itself (this is per Dr. Robert Whaley, a great mentor and the inventor of original VIX, now called VXO). VIX usually peaks around a test of its +4 sigma).
Current shock wave is on afterburners. Fasten your harnesses (Navy parlance for seat belts). Once VIX captures +4 sigma or higher, we will be on alert to buy the divergence.
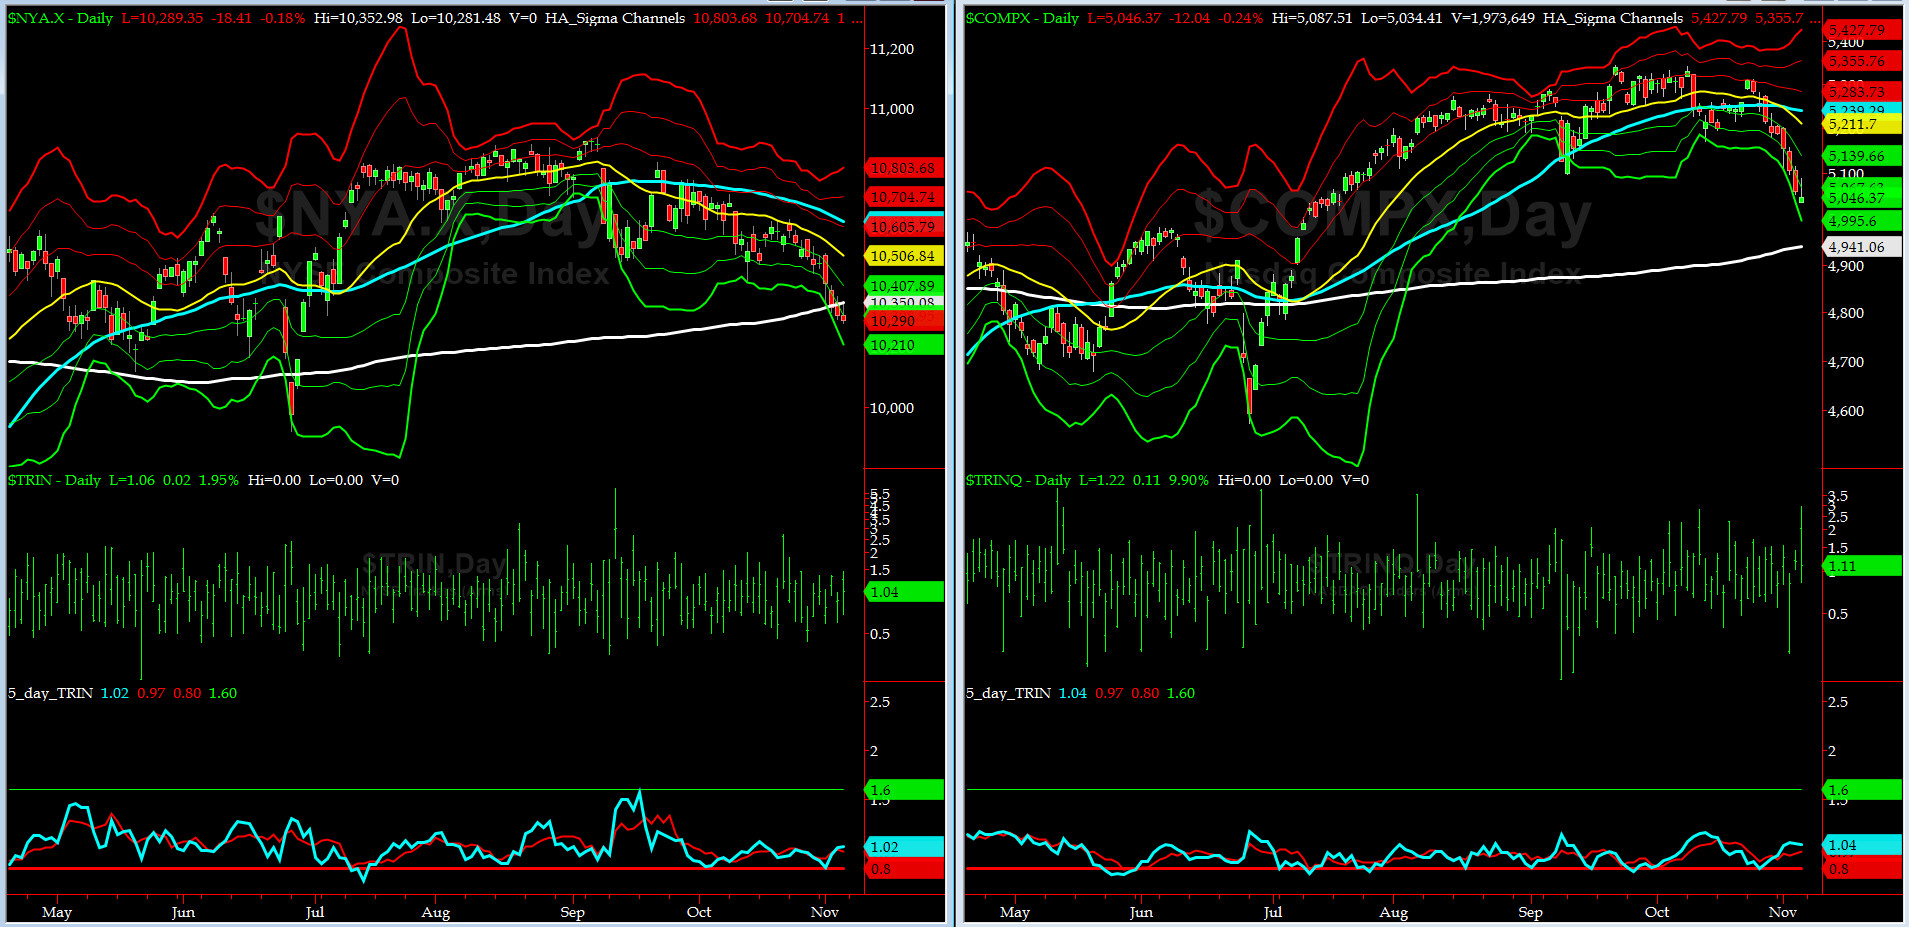
5-day TRIN & TRINQ Charts
NYSE & NASDAQ 5-day TRINs are again in NEUTRAL zone.
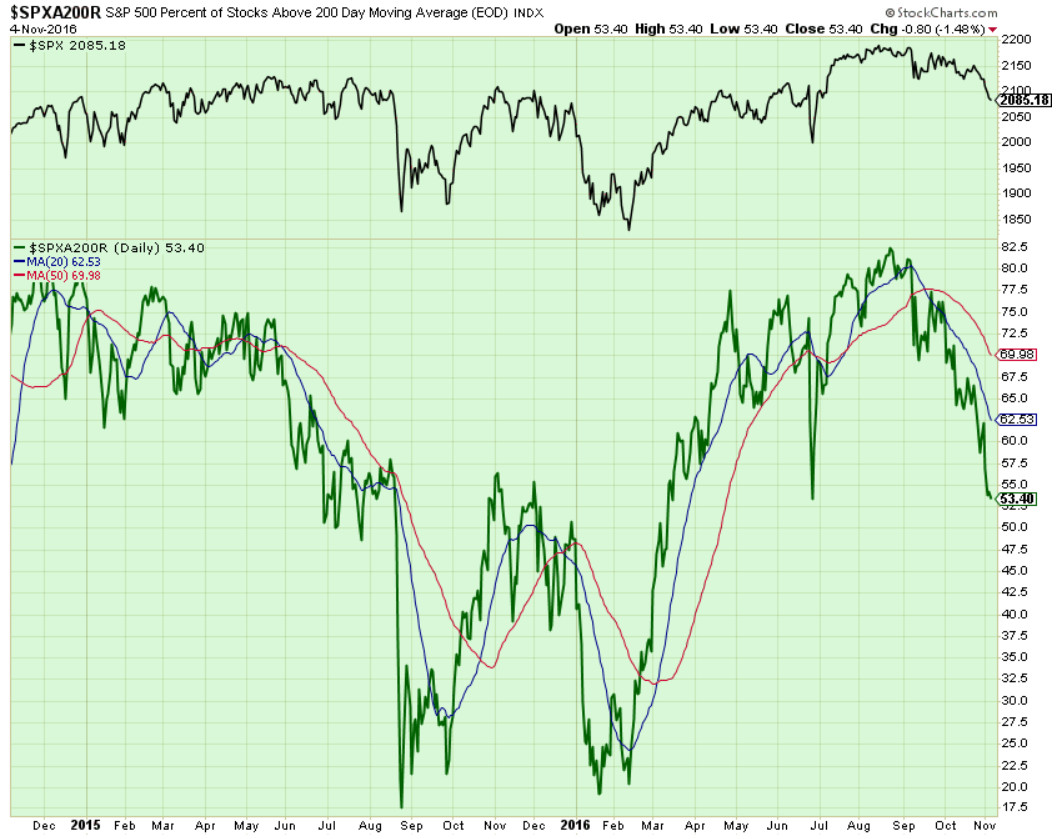
Components of SPX above their respective 200day MA Chart
This scoring indicator sank further to 53% on Friday. @Capt_tiko targets met - he is cart wheeling now. #TunaPower.

SPX SKEW (Tail Risk) Chart
On Thursday, SPX SKEW (Tail Risk) tested its +4 sigma level at 143 before pulling back and settling at 133, which also coincides with its +2 sigma level (normal = 120-125, range 100-150).
All is NOT Quiet on the Eastern Front (WASH-BOS Elite Corridor). @Capt_Tiko: Smart Money [and the DEMs] are getting REALLY nervous.
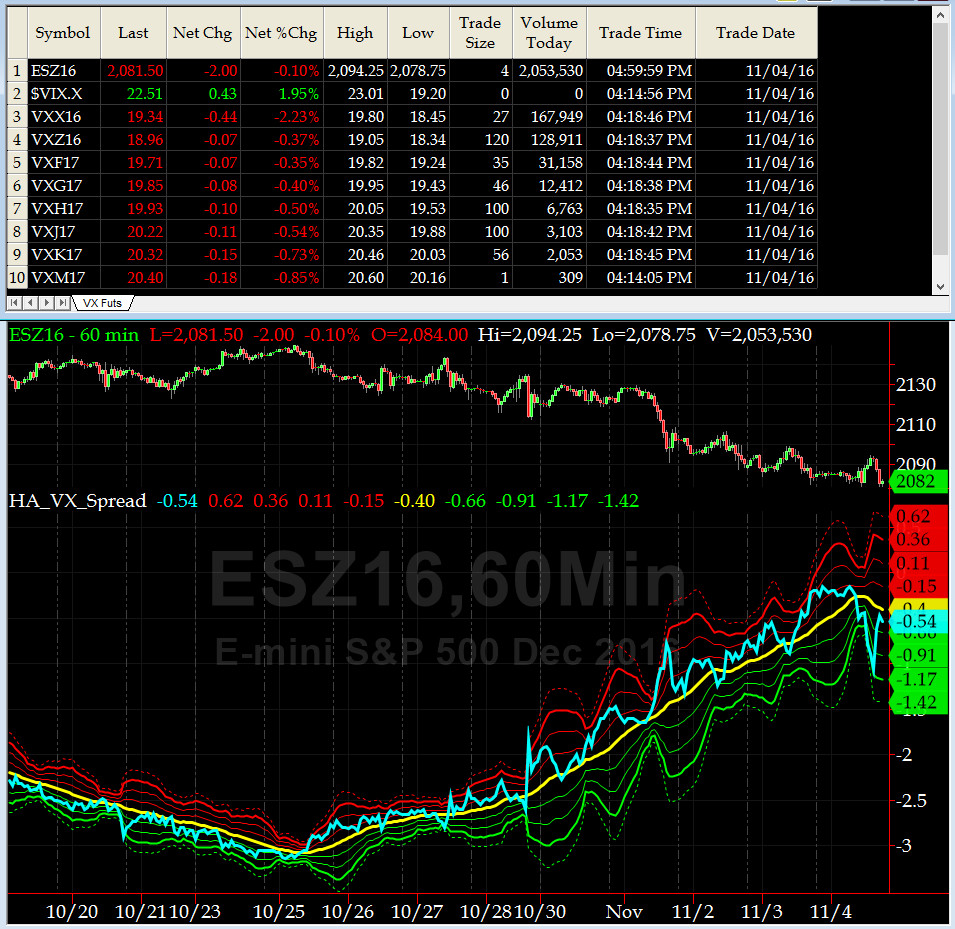
3-month VIX Futures Spread(VX) Chart
Our 3-month VIX Futures Spread (LONG NOV16 & SHORT FEB17) closed at -0.44 on Friday. Is the downside move done? Not so fast, sailor. Fat Lady has not sung yet.
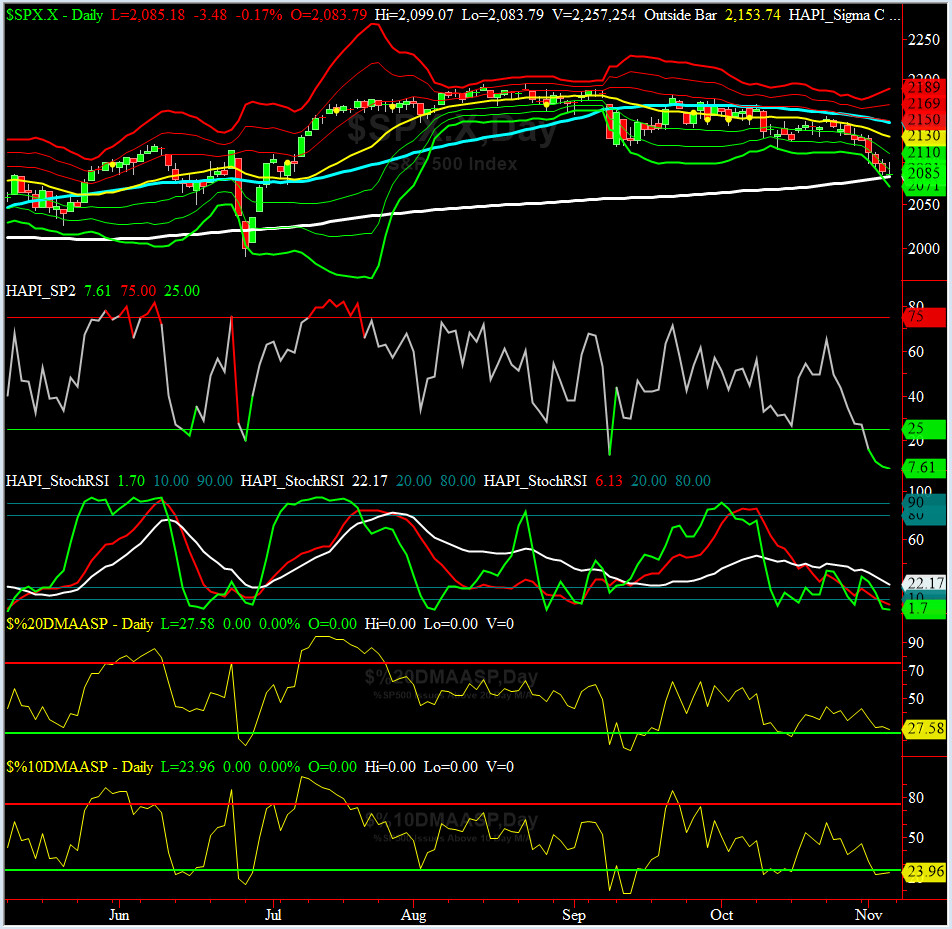
HA_SP2 Chart
HA_SP2 = 7.6 (Buy signal <= 25, Sell Signal >= 75)
This indicator is UBER OverSold. That was a great call Tiko.
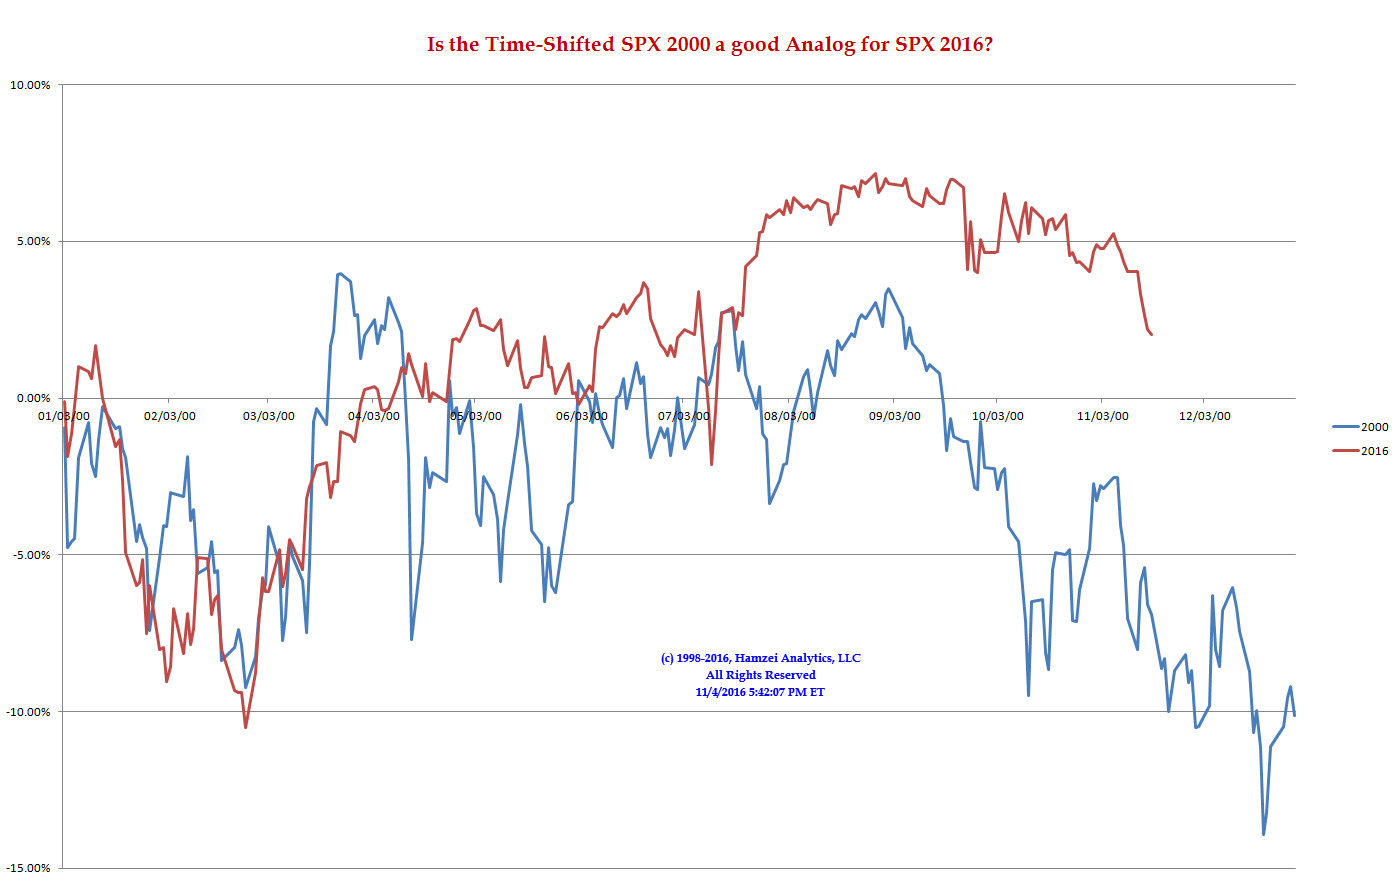
SPX 2000 Analog for SPX 2016
Last week we stated: The $64K question is not a matter of IF, but WHEN, the other shoe will drop.
Going into the Election Week the bigger question is: How many shoes are out there?
As in the past Maury is salivating at the thought of much lower prices for entry, even hoping to find some bargains BELOW COST. LOL.
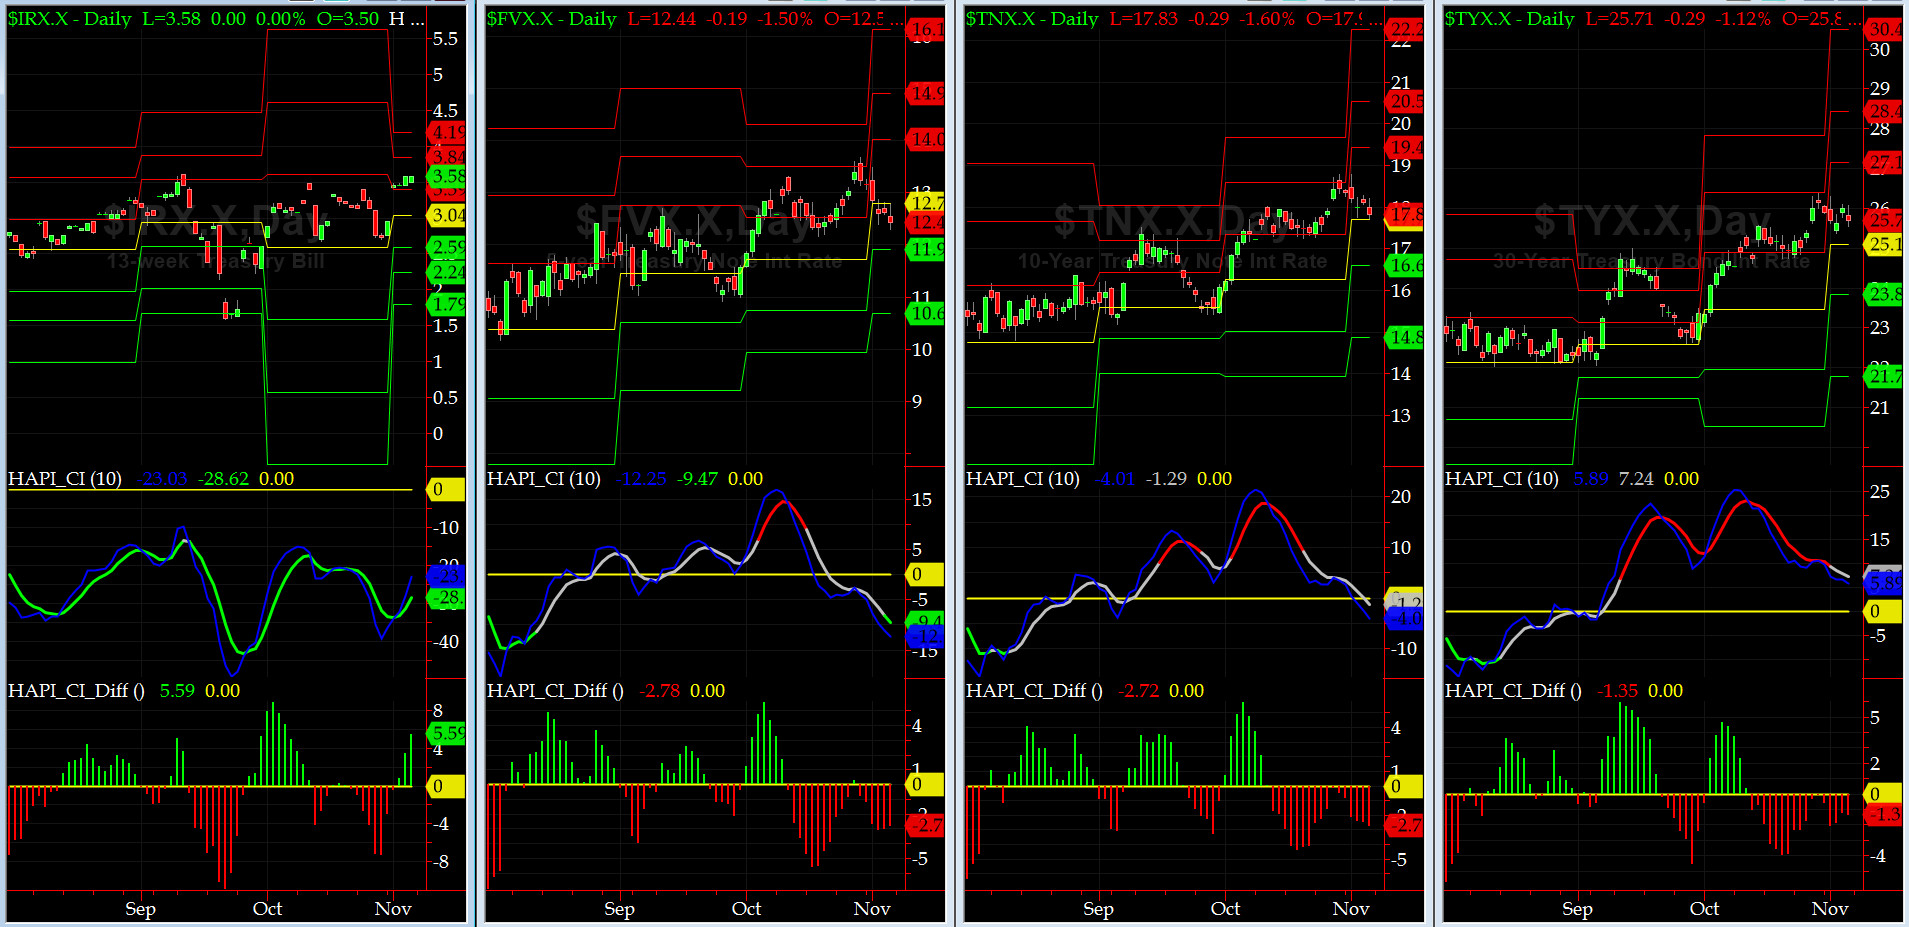
US Treasury T-Notes & T-Bonds Yields Chart
The YTMs on Treasury Complex had a muted sideways week. We were expecting an uptick (Asset Allocation trade).
But then again, what do we know about T-Bonds & T-Notes!!
Fari Hamzei
|


 Proactive Market Timing