|
Sunday, November 13, 2016, 1400ET
Market Timing Charts, Analysis & Commentary for Issue #167
Timer Charts of S&P-500 Cash Index (SPX) + NASDAQ-100 Cash Index (NDX)
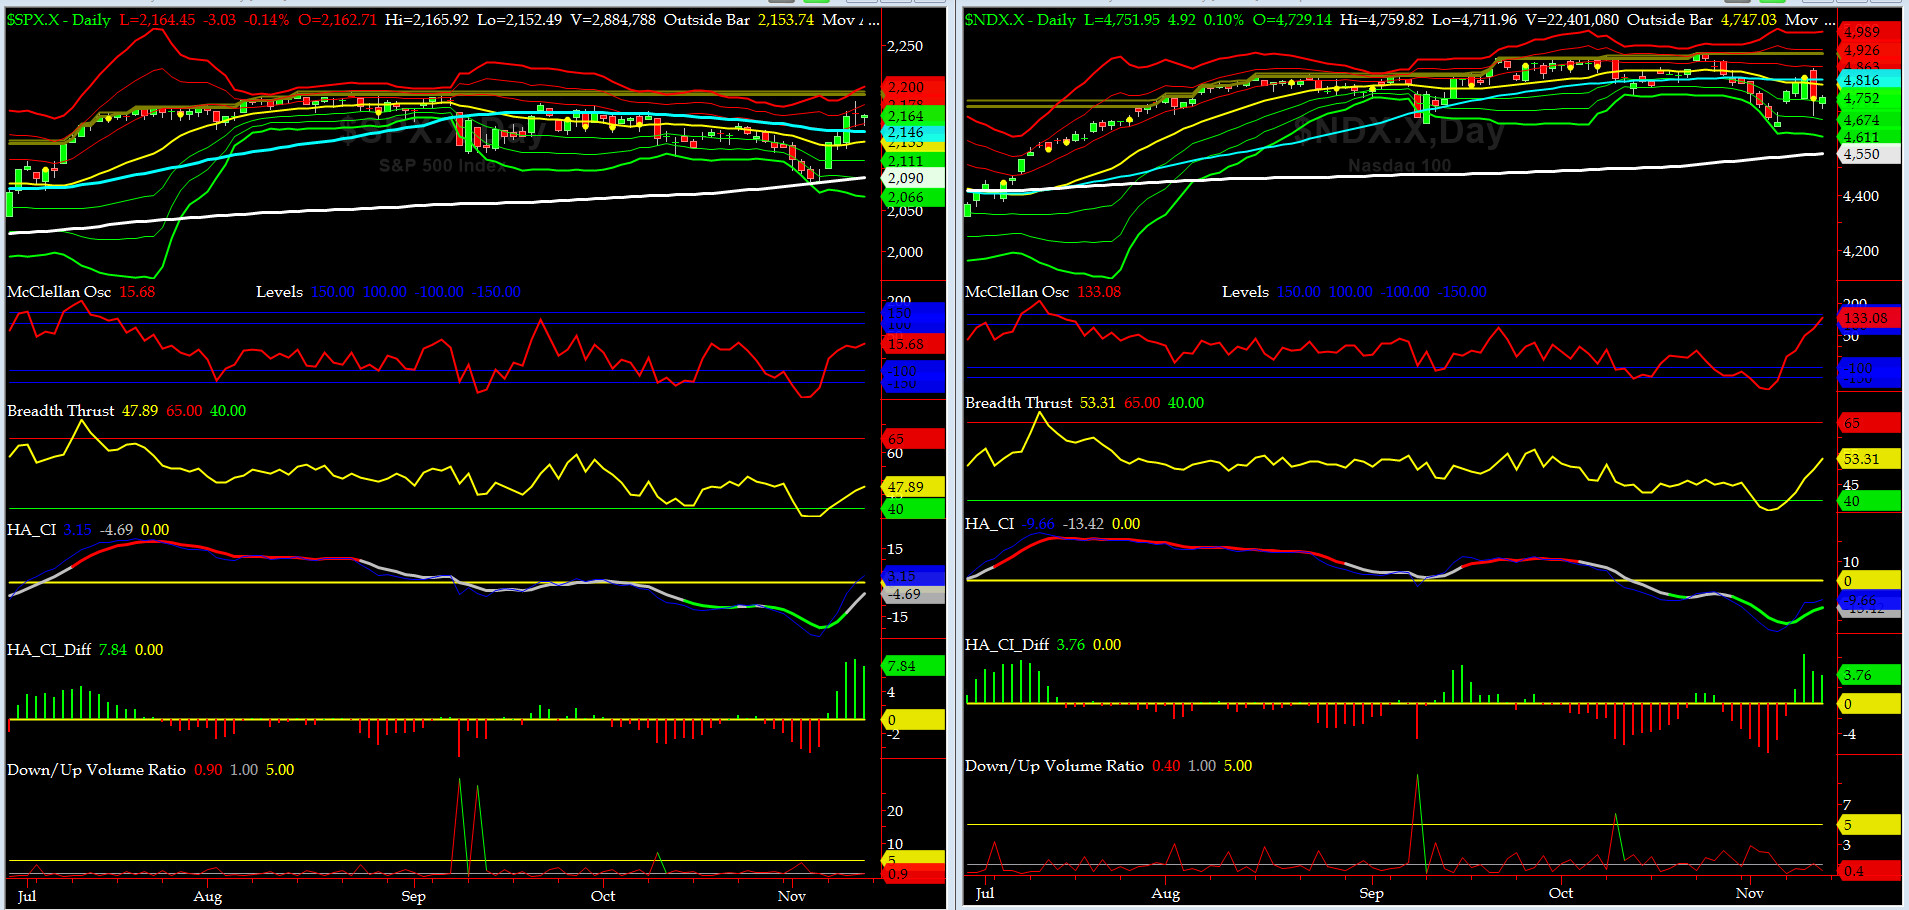
Most recent S&P-500 Cash Index (SPX): 2164.45 up +79.27 (up +3.8%) for the week ending on Friday, November 11th, 2016, which closed just about its +1.5 sigma and and just above 50-day MovAvg.
SPX ALL TIME INTRADAY HIGH = 2193.81 (reached on Monday, August 15, 2016)
SPX ALL TIME CLOSING HIGH = 2190.15 (reached on Monday, August 15, 2016)
Current DAILY +2 Sigma SPX = 2178 with WEEKLY +2 Sigma = 2207
Current DAILY 0 Sigma (20 day MA) SPX = 2133 with WEEKLY 0 Sigma = 2152
Current DAILY -2 Sigma SPX = 2088 with WEEKLY -2 Sigma = 2098
NYSE McClellan Oscillator = +16 (-150 is start of the O/S area; around -275 to -300 area or lower, we go into the �launch-pad� mode, over +150, we are in O/B area)
NYSE Breadth Thrust = 47.9 (40 is considered as oversold and 65 as overbought)
Well, majority of elite liberals got it wrong, except for Nate Silver. Our very own @Capt_Tiko had it right from the look on his face during the presidential debate. He isn't even an unemployed white. Go figure..
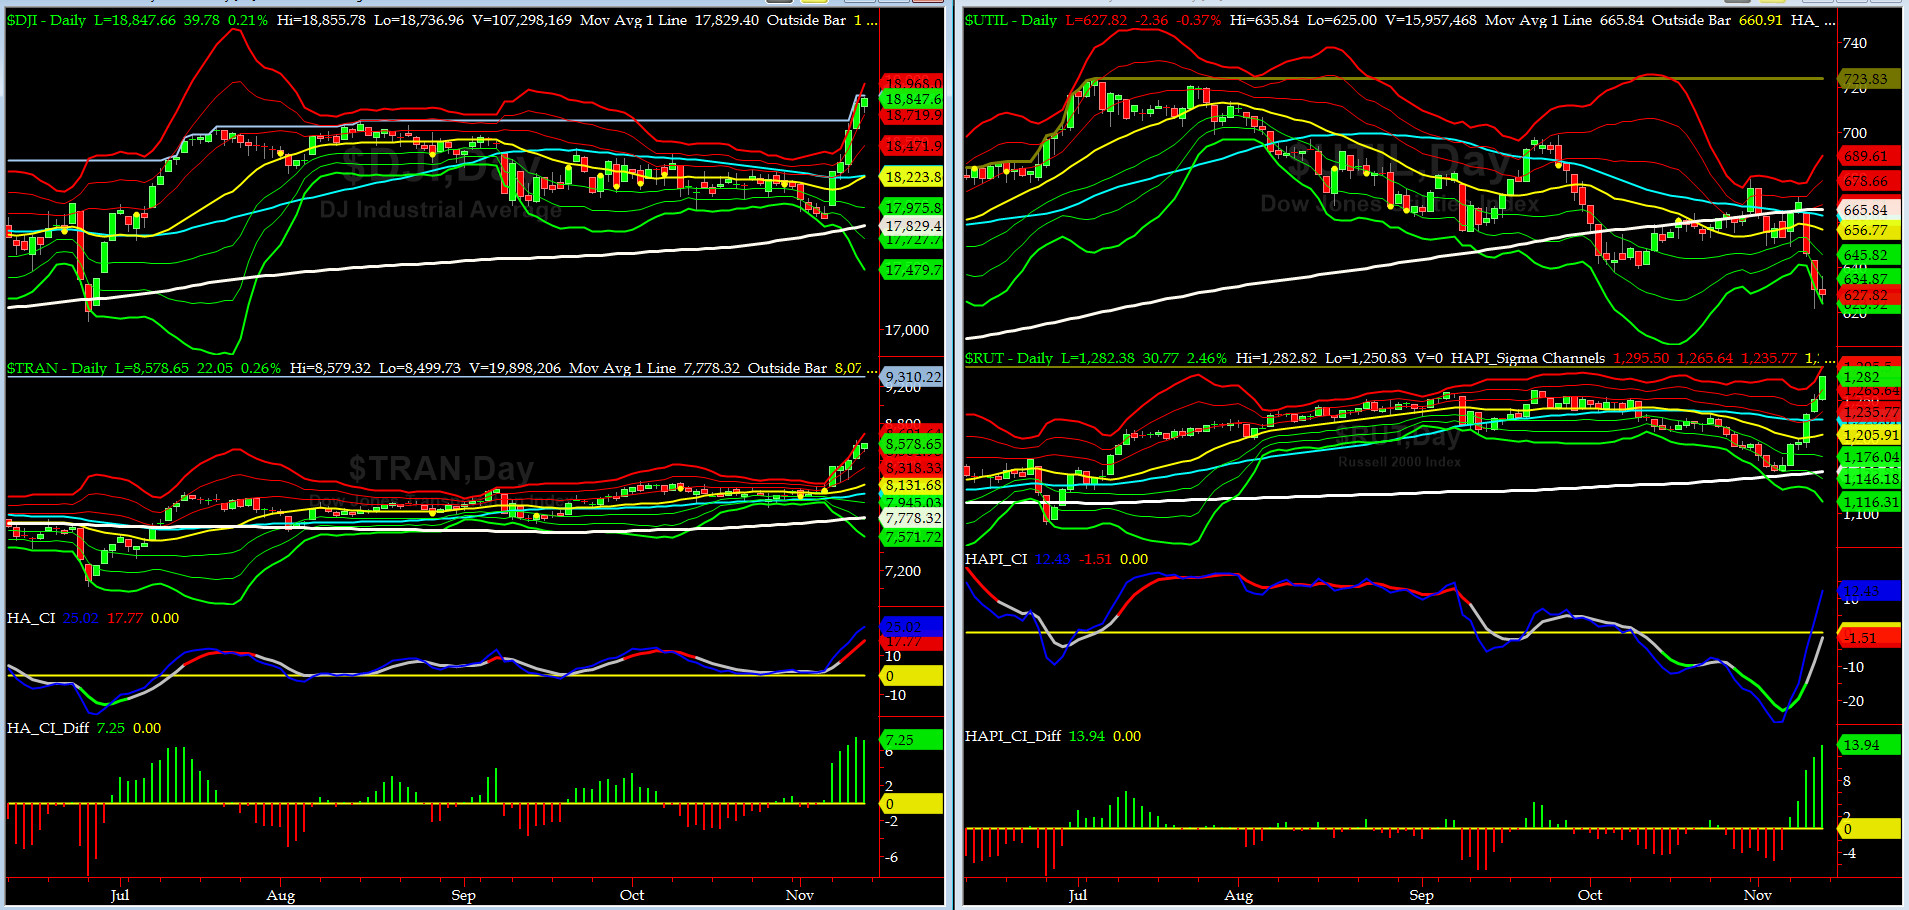
Canaries [in the Coal Mine] Chart for DJ TRAN & RUT Indices
200-Day MA DJ TRAN = 7778 or 10.3% below DJ TRAN (max observed in last 5 yrs = 20.2%, min = -20.3%)
200-Day MA RUT = 1155 or 10.9% below RUT (max observed in last 5 yrs = 21.3%, min = -22.6%)
DJ Transports (proxy for economic conditions 6 to 9 months hence) had a great week as the index gained 6%. The indices were very well receptive about the election results.
Russell 2000 small caps (proxy for Risk ON/OFF) rallied even stronger and went up ten percent. RISK is ON.
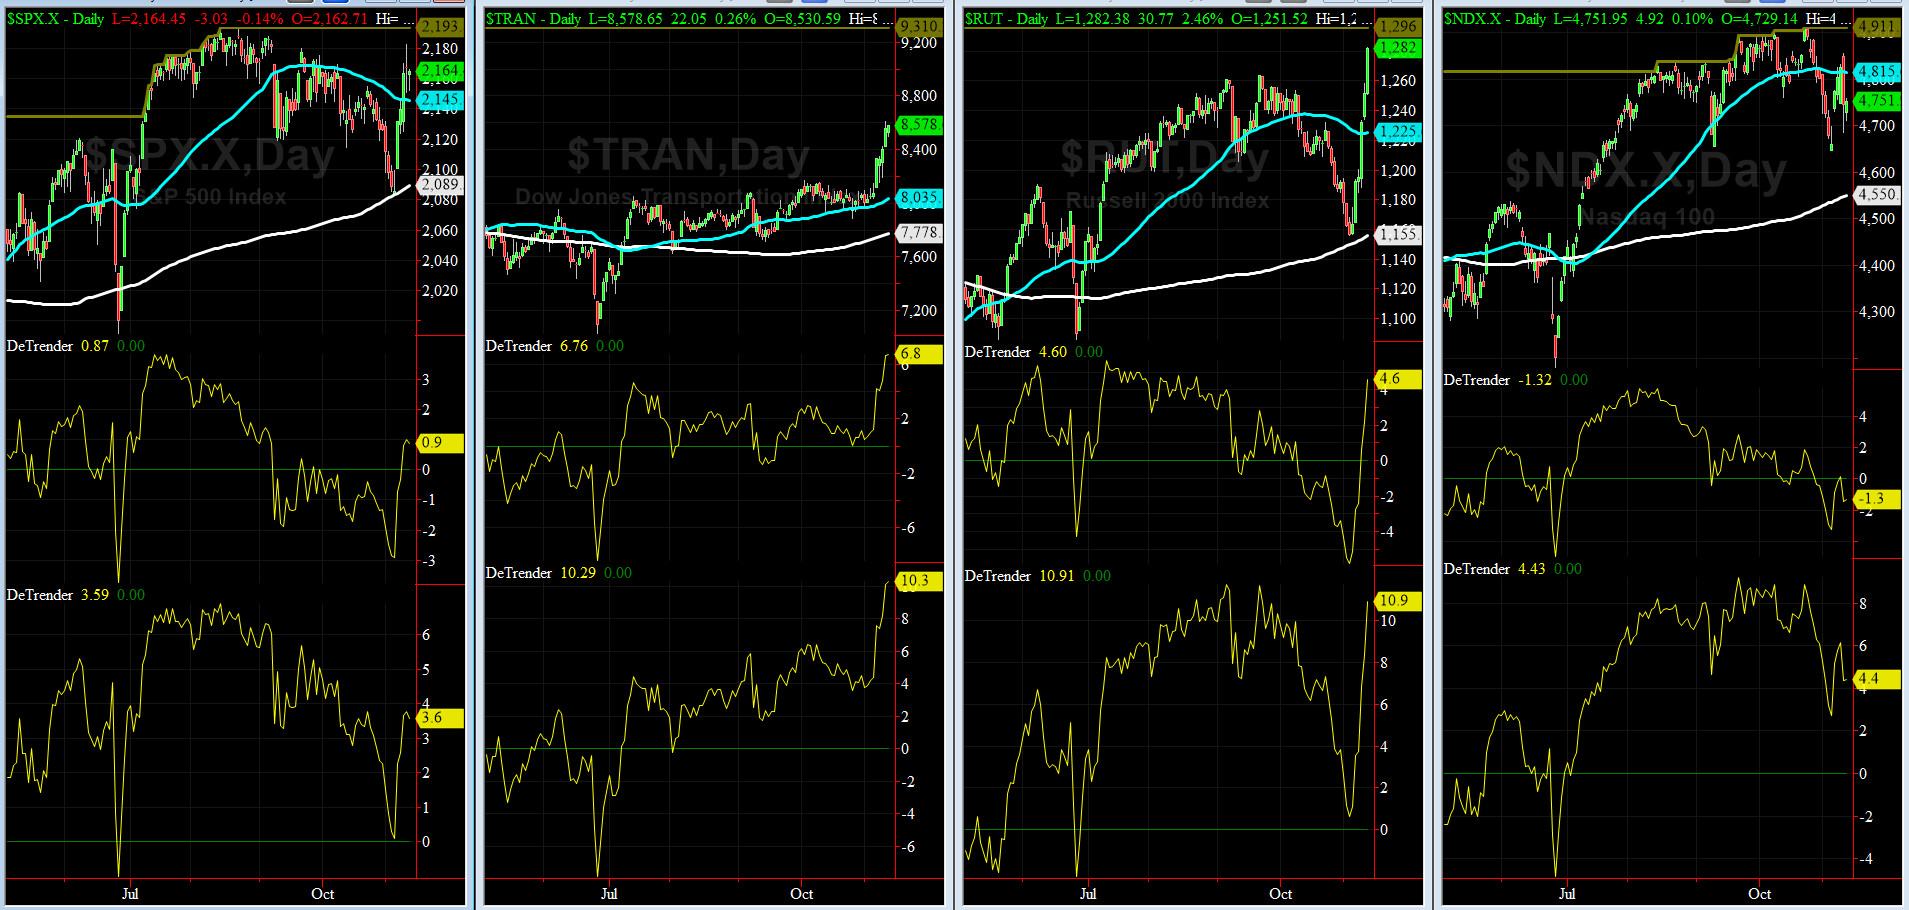
DeTrenders Charts for SPX, NDX, TRAN & RUT Indices
50-Day MA SPX = 2145 or 0.9 below SPX closed on Friday (max observed in last 5 yrs = +8.6%, min = -9.3%)
200-Day MA SPX = 2089 or 3.6% below SPX (max observed in last 5 yrs = 15.2%, min = -14%)
Currently, only 1 of our 8 De Trenders are negative. The De Trenders for DJ TRAN & RUT will continue to be harbingers of future price behavior in broad indices.
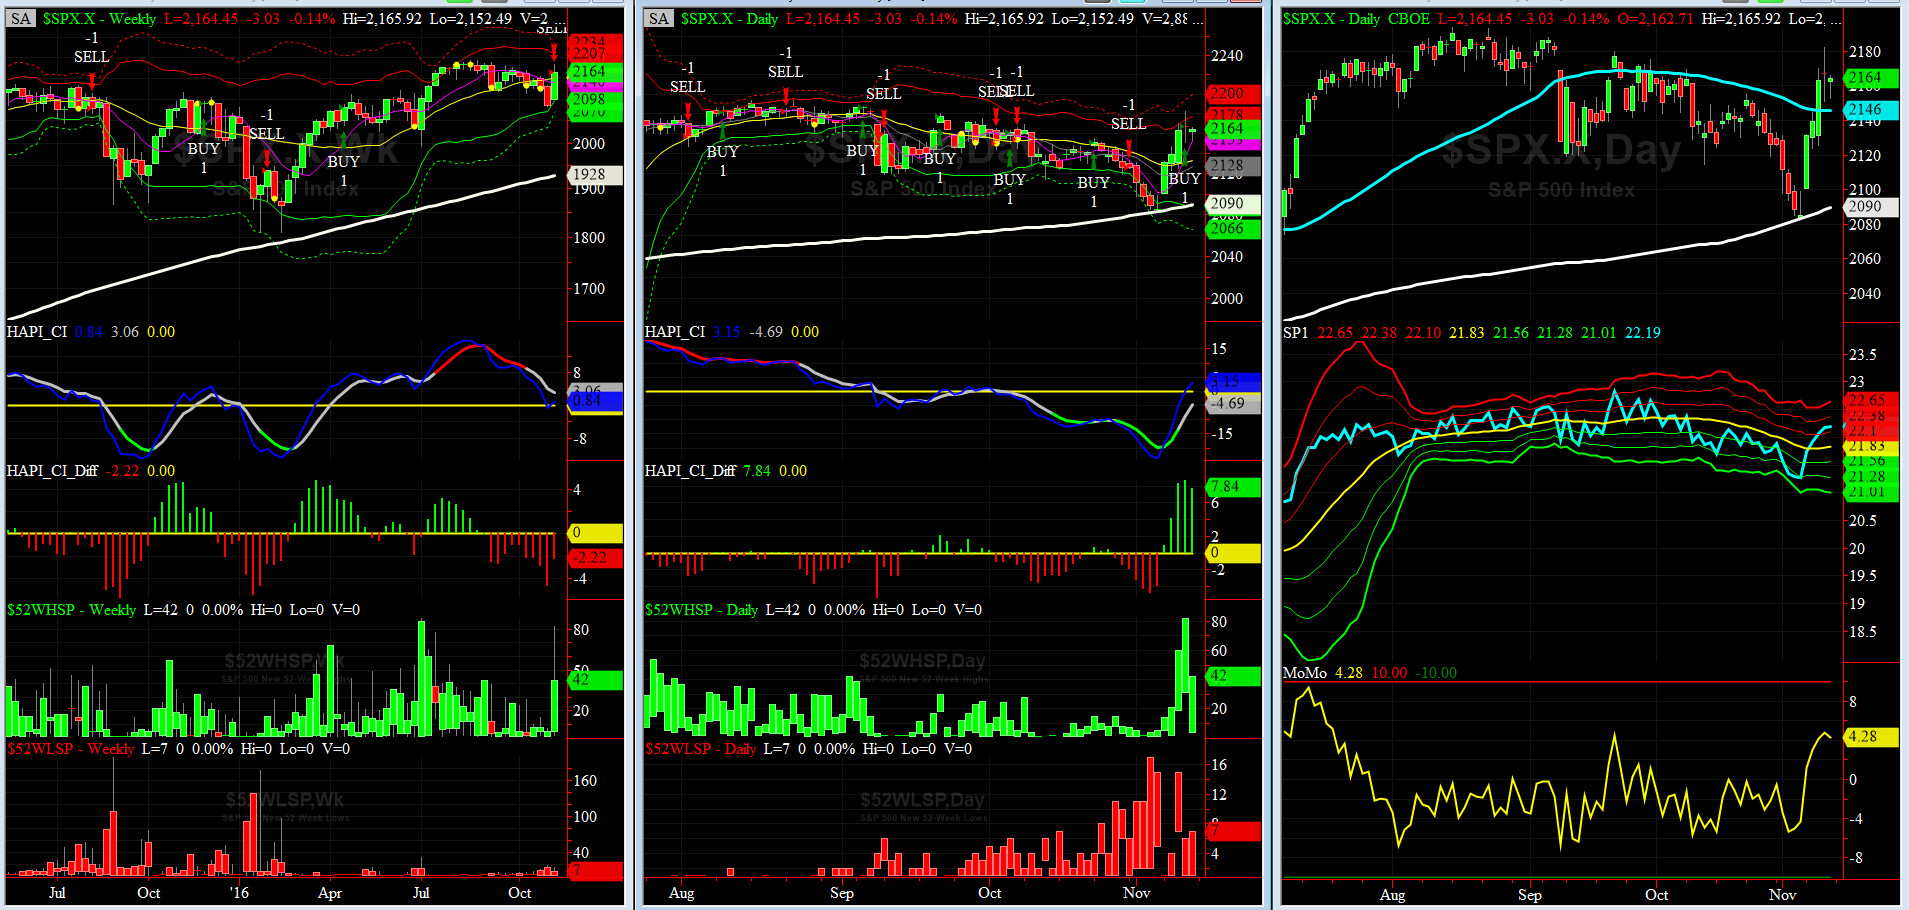
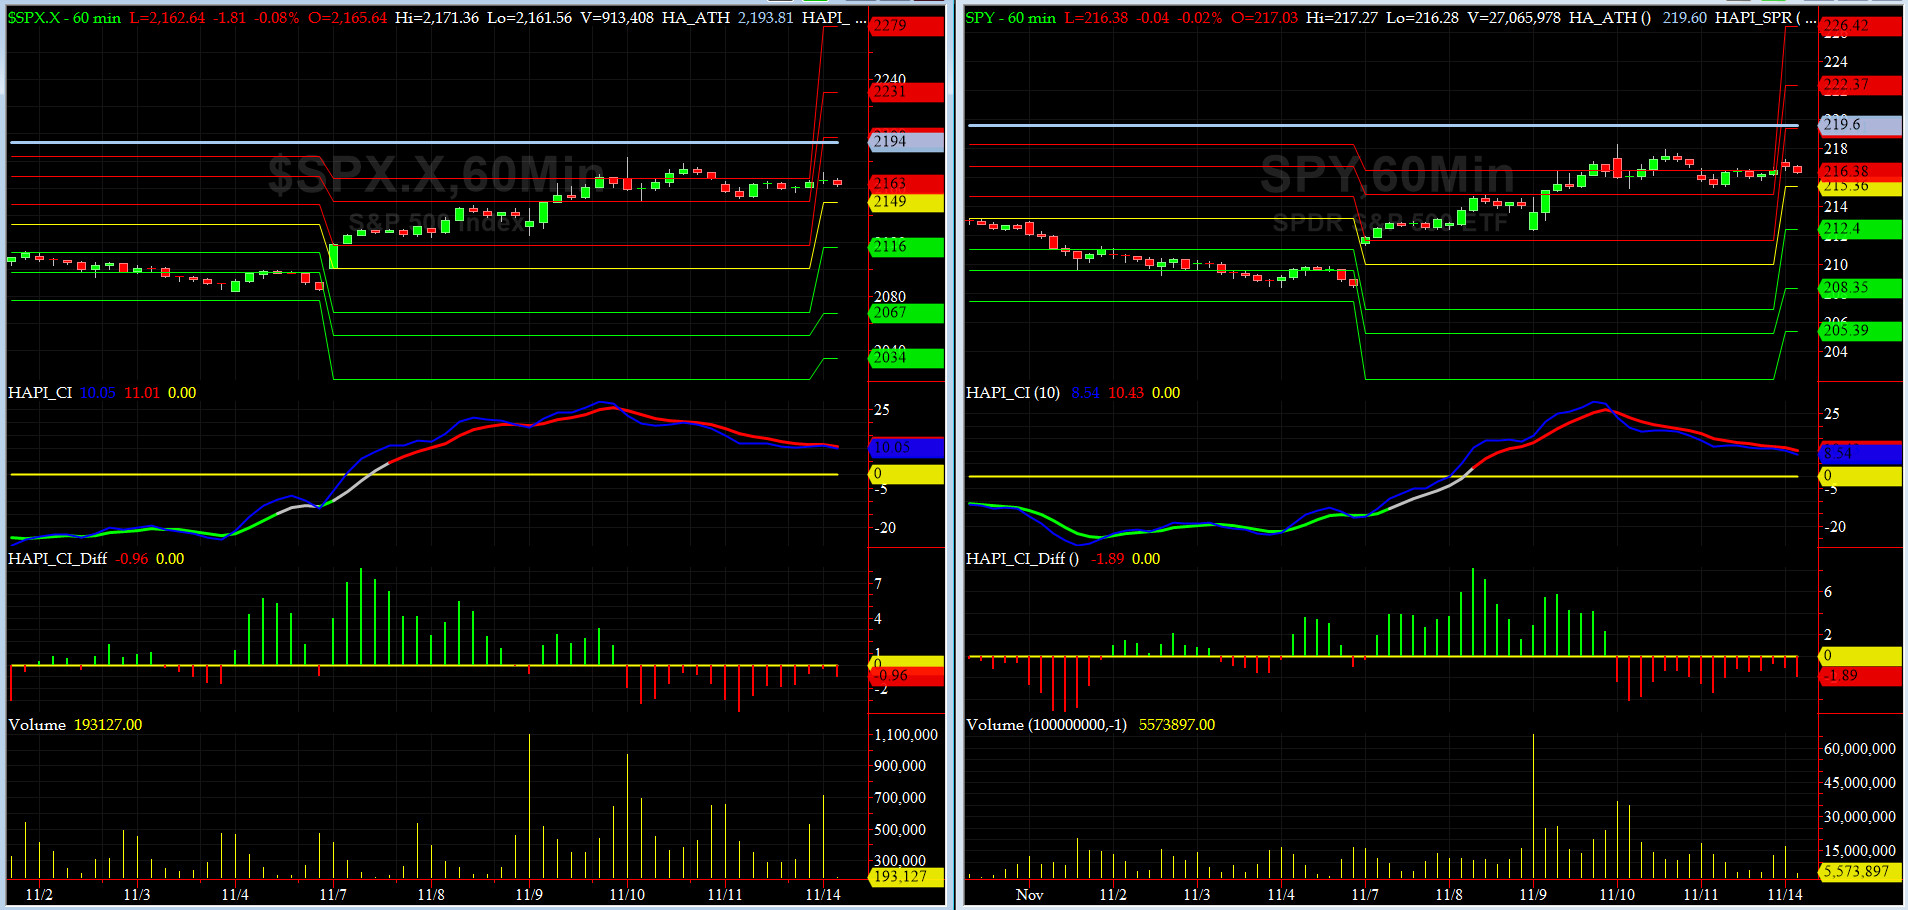
HA_SP1_Momo Chart
WEEKLY Timing Model = on a SELL Signal since Friday 11/11/16 CLOSE at 2164
DAILY Timing Model = on a BUY Signal since Thursday 11/10/16 CLOSE at 2167
Max SPX 52wk-highs reading last week = 82 (over 120-140, the local maxima is in)
Max SPX 52wk-Lows reading last week = 15 (over 40-60, the local minima is in)
HA_SP1 = above its +1 sigma channels
HA_Momo = +4.28 (reversals most likely occur above +10 or below -10)
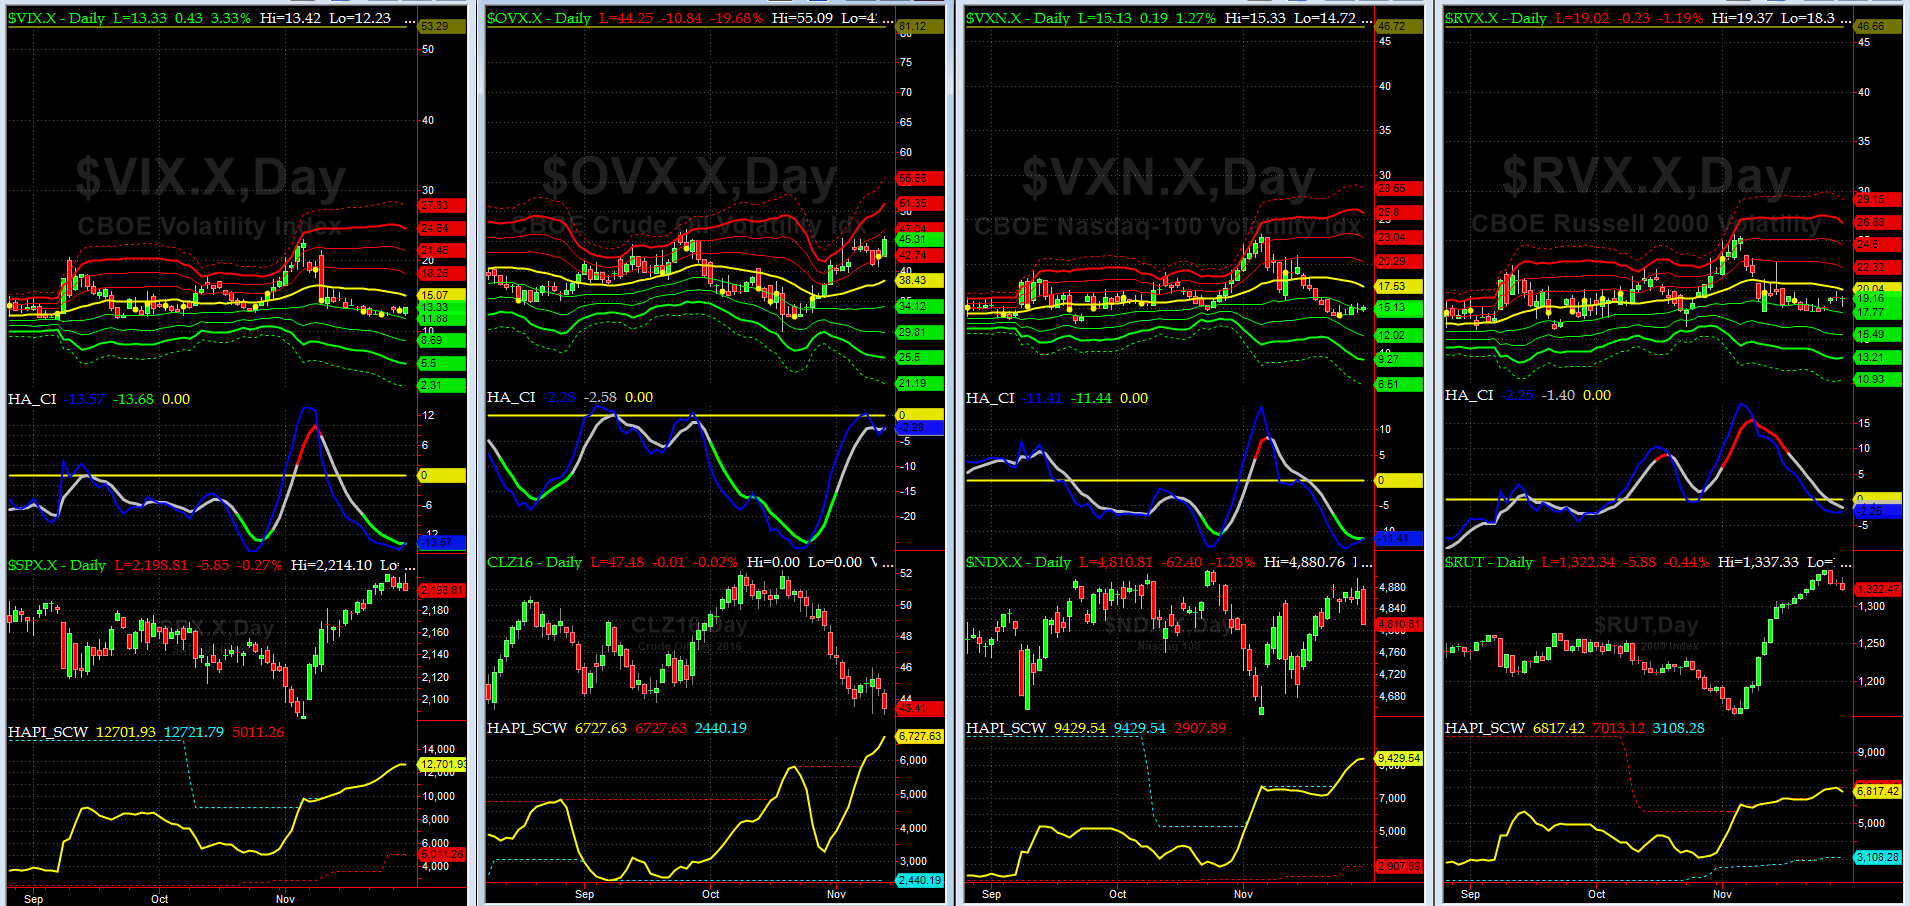
Vol of the Vols Chart
VIX is currently testing its -1 sigma level at 14.17 (remember it�s the VIX�s vol pattern (its sigma channels) that matters, and not the level of VIX itself (this is per Dr. Robert Whaley, a great mentor and the inventor of original VIX, now called VXO). VIX usually peaks around a test of its +4 sigma).
The current shock wave appears to be almost over. However, this time around, VIX failed to recapture +4 sigma before collapsing.

5-day TRIN & TRINQ Charts
NYSE 5-day TRIN is on a SELL but its NASDAQ brethern is still in NEUTRAL zone.
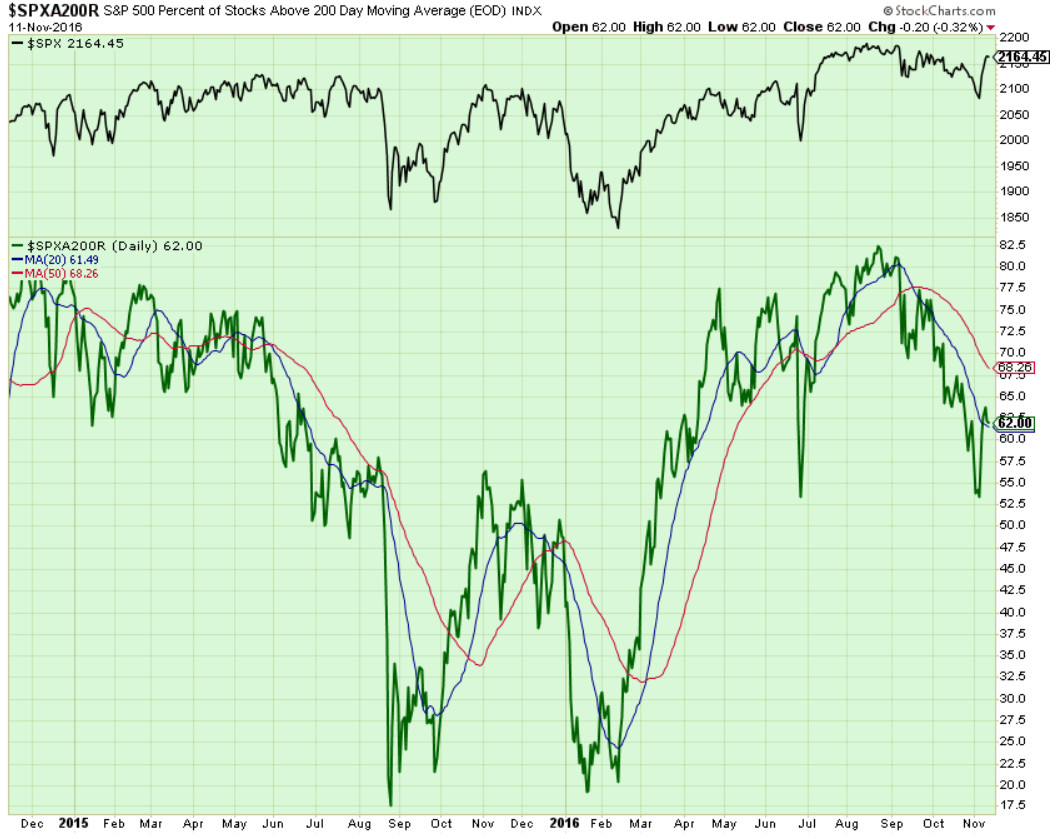
Components of SPX above their respective 200day MA Chart
This scoring indicator made a double bottom at 53% and then raced up to 62%. We are not out of the woods yet and we need to follow this chart daily this week as confirmation for this post-election mini-rally.
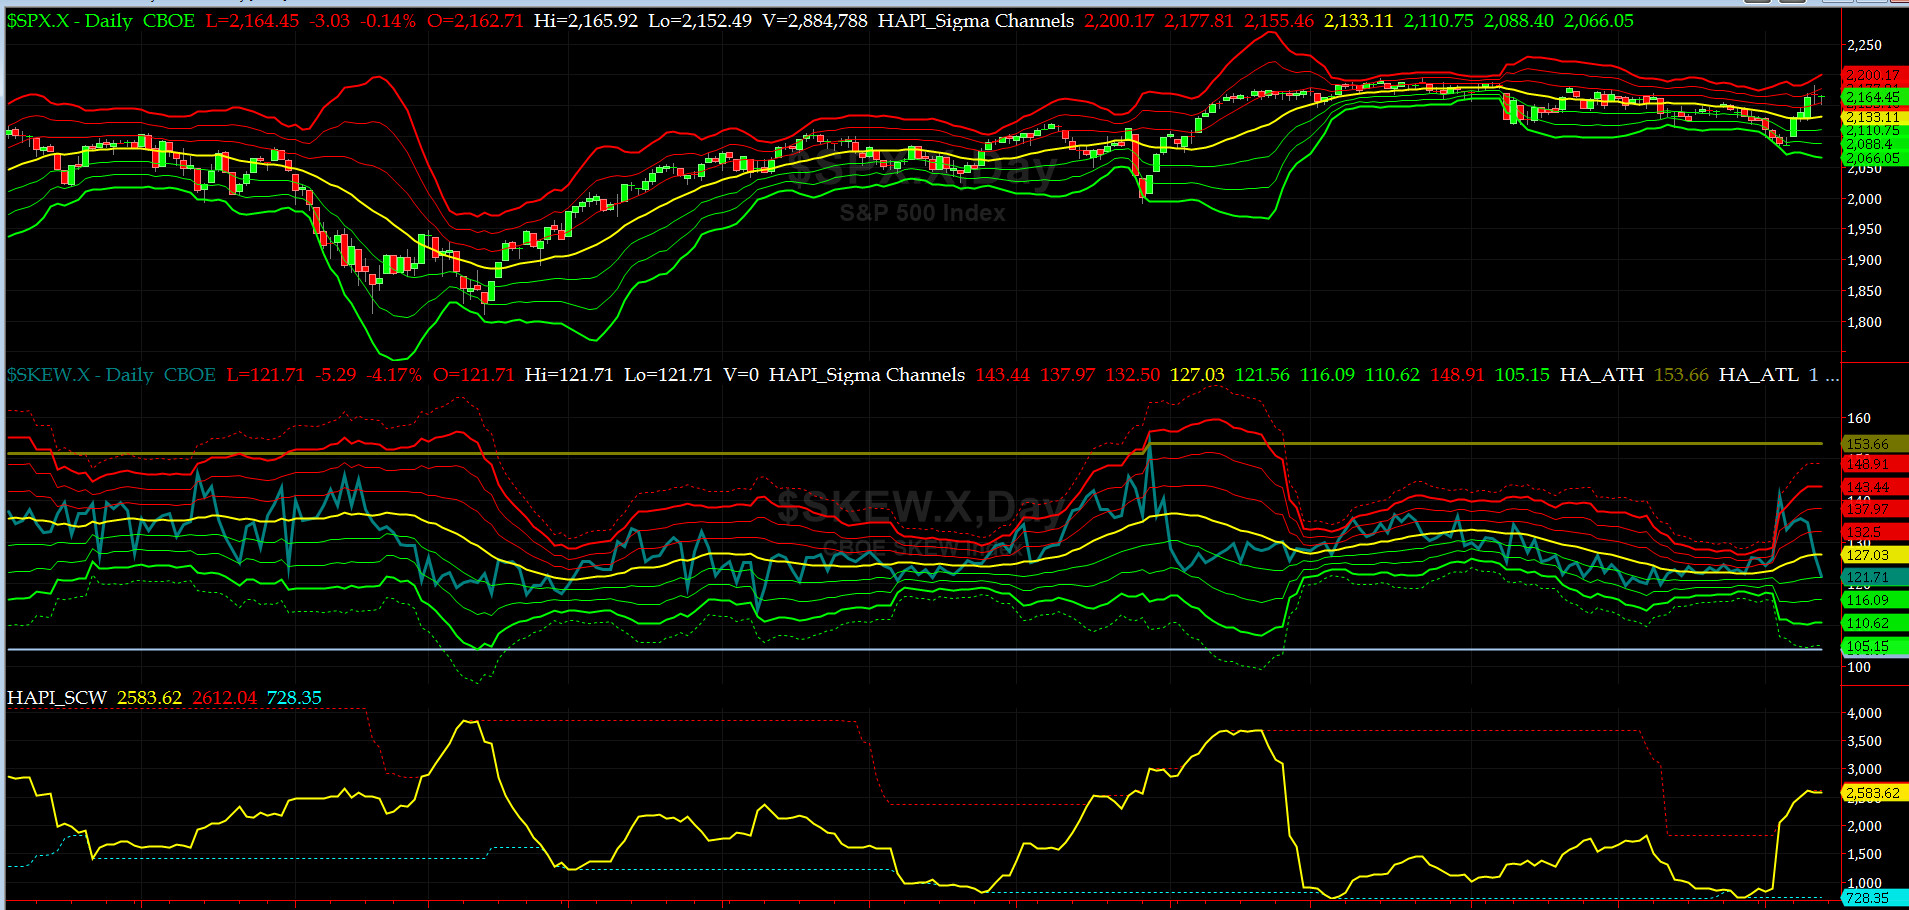
SPX SKEW (Tail Risk) Chart
Last week SPX SKEW (Tail Risk) tested its +4 sigma level and then sank to 121 this week, which also coincides EXACTLY with its +1 sigma level (normal = 120-125, range 100-150).
All is getting quieter on the Eastern Front (WASH-BOS Elite Corridor). @Capt_Tiko: Smart Money [and the DEMs] finally figured out the game is over (once HRC conceded).
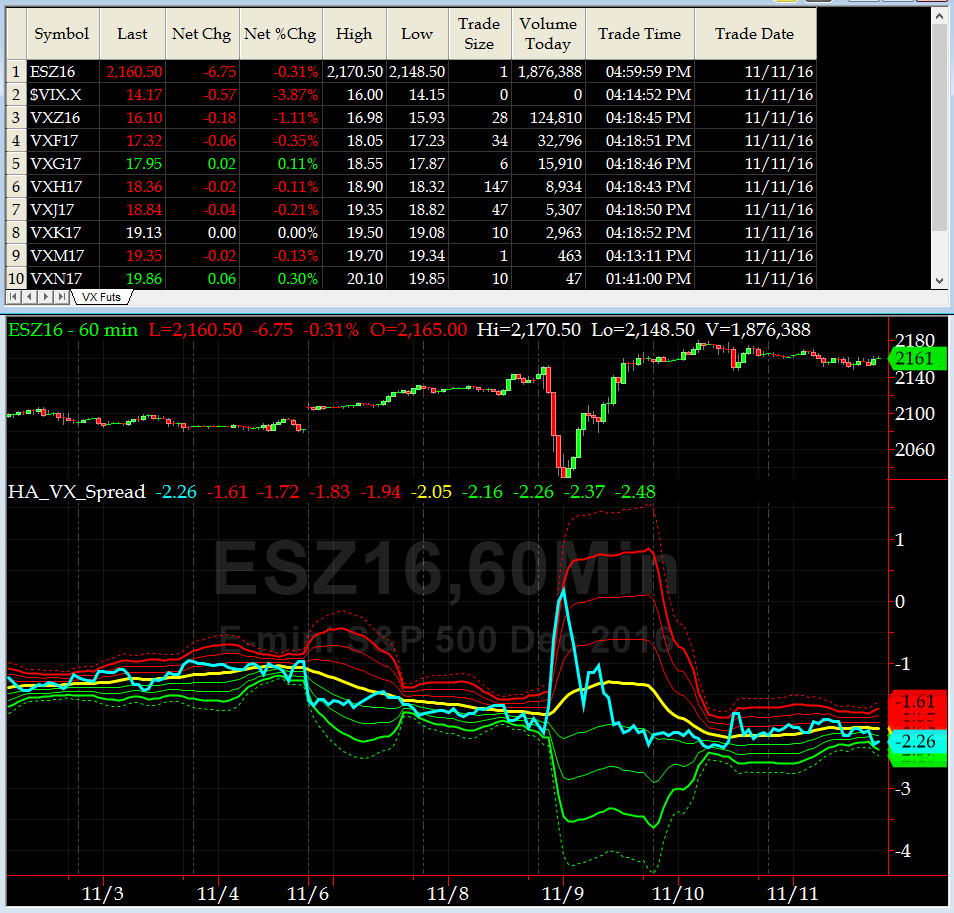
3-month VIX Futures Spread(VX) Chart
Our 3-month VIX Futures Spread (LONG DEC16 & SHORT MAR17) closed at -2.26 on Friday. What a week this spread had. Specially late Tuesday night and into early hours of Wednesday as the HRC conceded. It acted as my compass for reversing my index futures positions. Currently it is a tad NEUTRAL.
HA_SP2 Chart
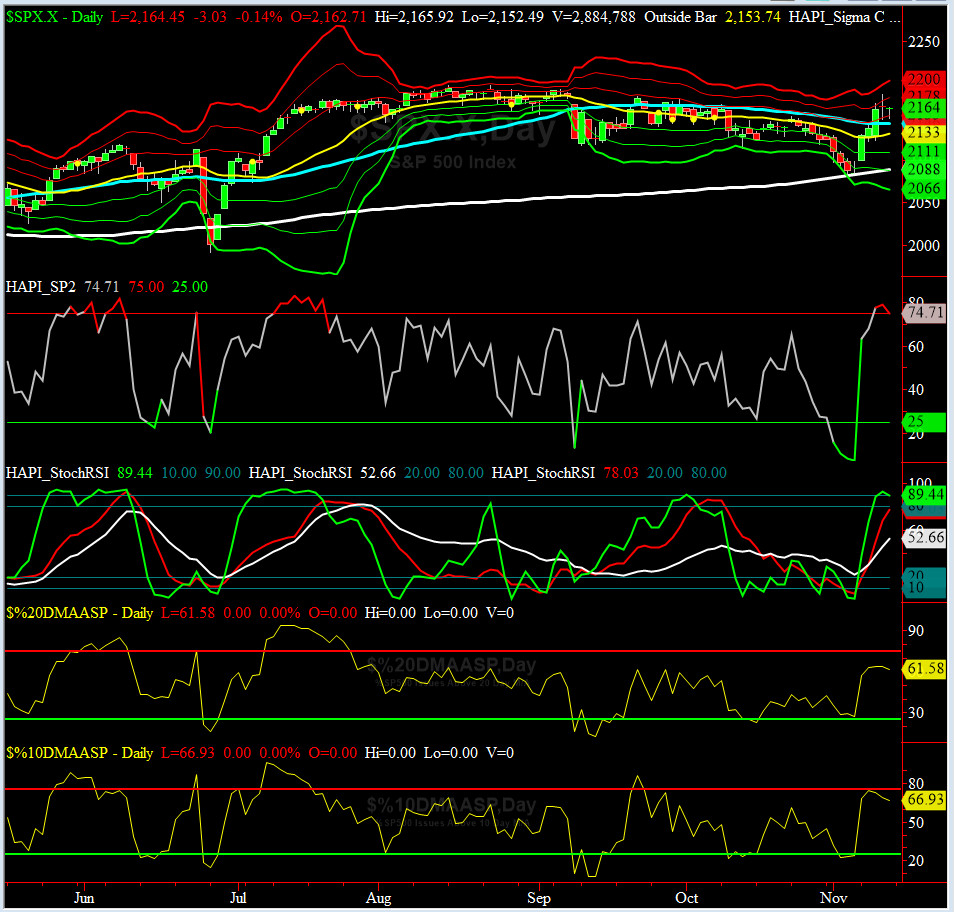
HA_SP2 = 74.7 (Buy signal <= 25, Sell Signal >= 75)
This indicator is OverBought now. Tiko was dead right last week. #TunaPower. Keep in mind, it can stay overbought just like it did in late July.

SPX 2000 Analog for SPX 2016
Last week we stated: The $64K question is not a matter of IF, but WHEN, the other shoe will drop.
Going into the Election Week the bigger question is: How many shoes are out there?
As in the past Maury is salivating at the thought of much lower prices for entry, even hoping to find some bargains BELOW COST. LOL.
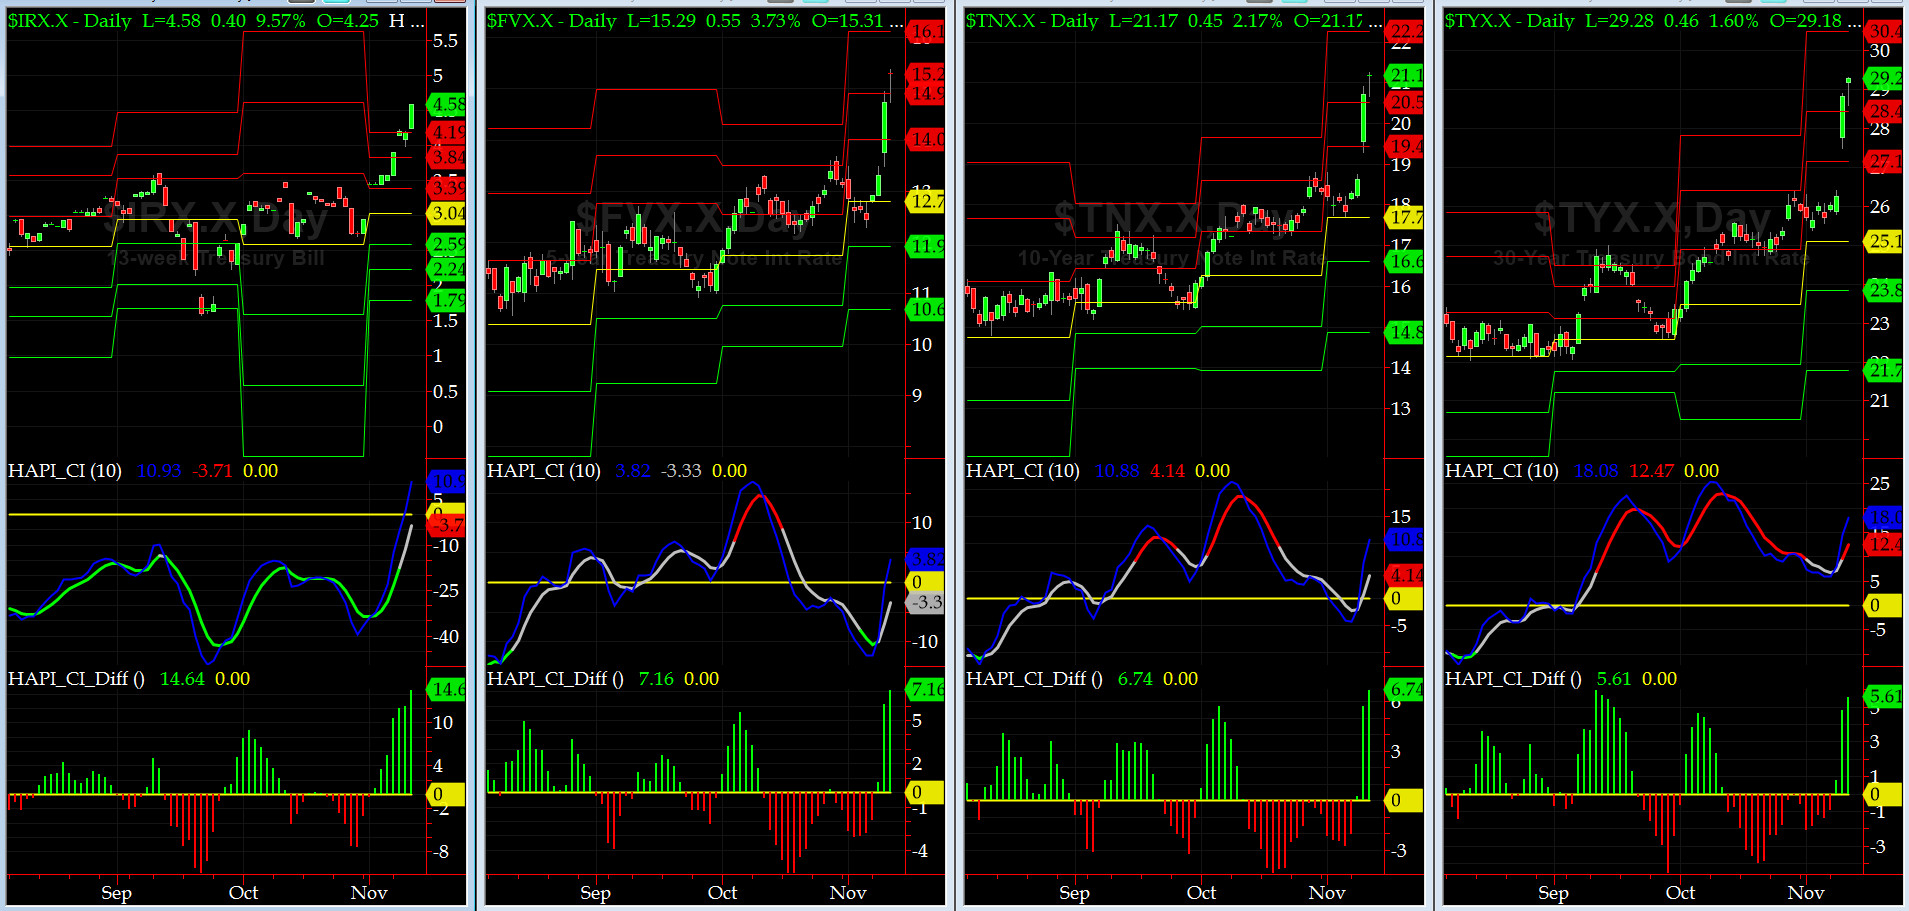
US Treasury T-Notes & T-Bonds Yields Chart
The YTMs on Treasury Complex shot up once the dust settled. The expected uptick in Asset Allocation trade is here!!
On a different front, we are introducing our much awaited T-Notes & T-Bonds OTF Streamer.
Fari Hamzei
|


 Proactive Market Timing