|
Saturday, November 19, 2016, 1630ET
Market Timing Charts, Analysis & Commentary for Issue #168
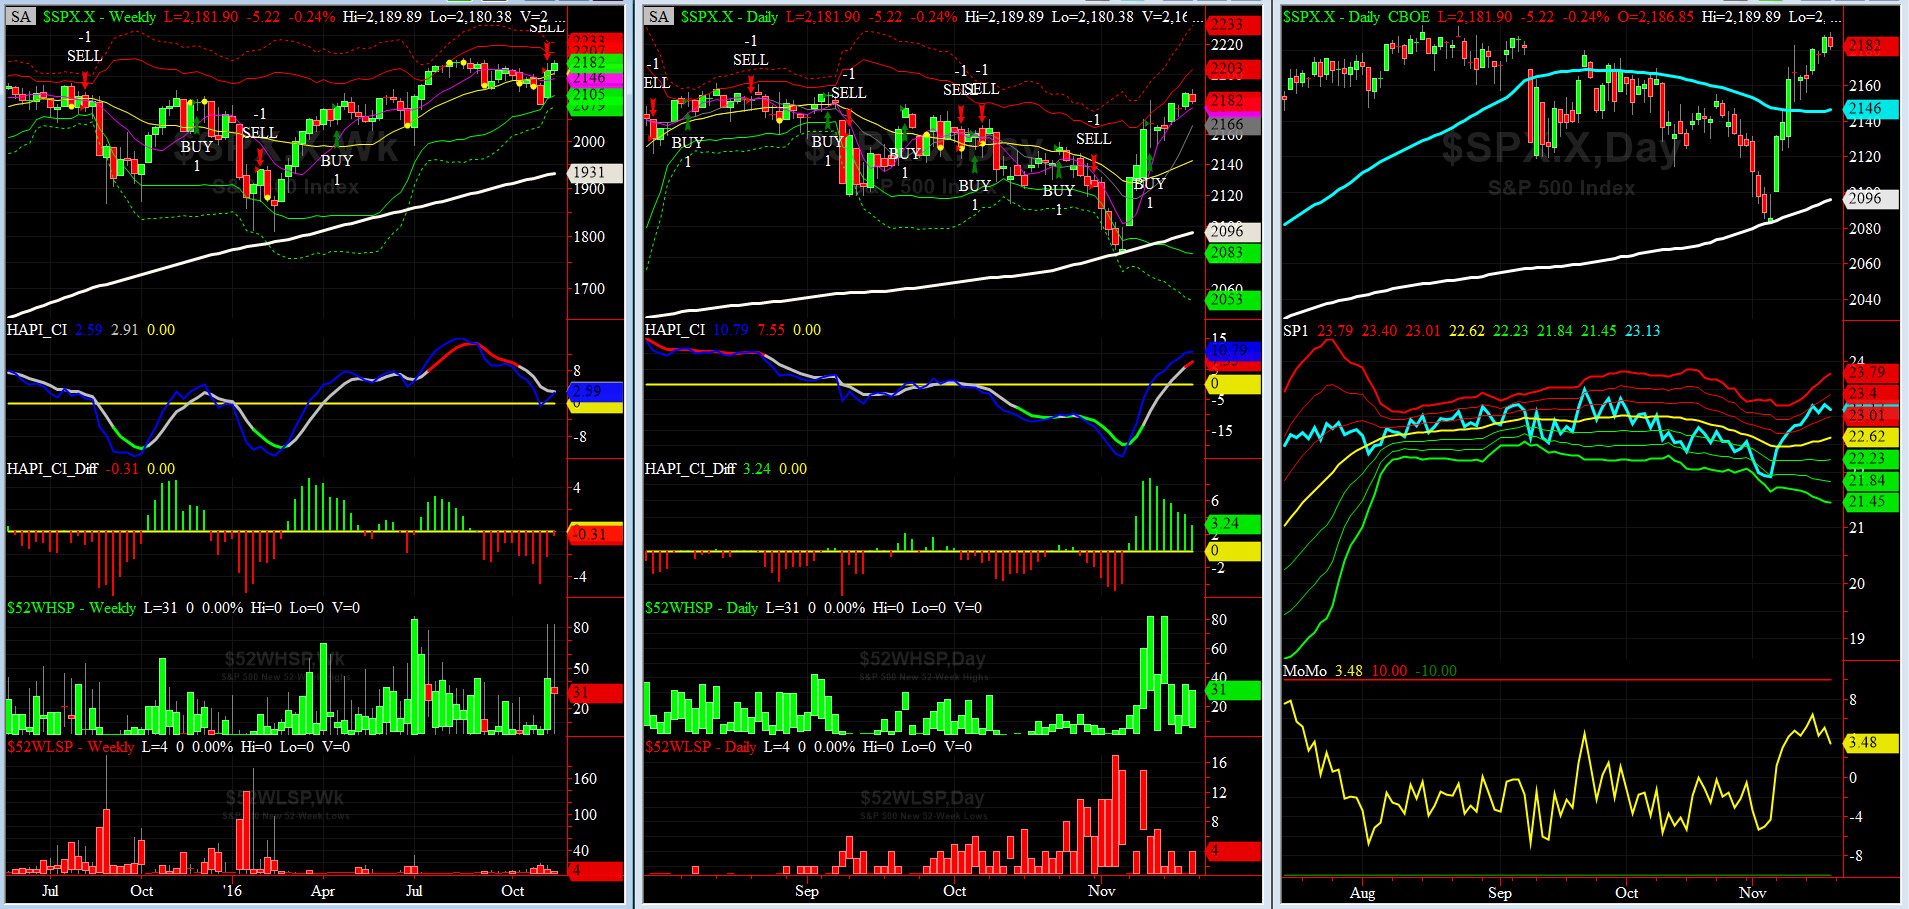
Timer Charts of S&P-500 Cash Index (SPX) + NASDAQ-100 Cash Index (NDX)
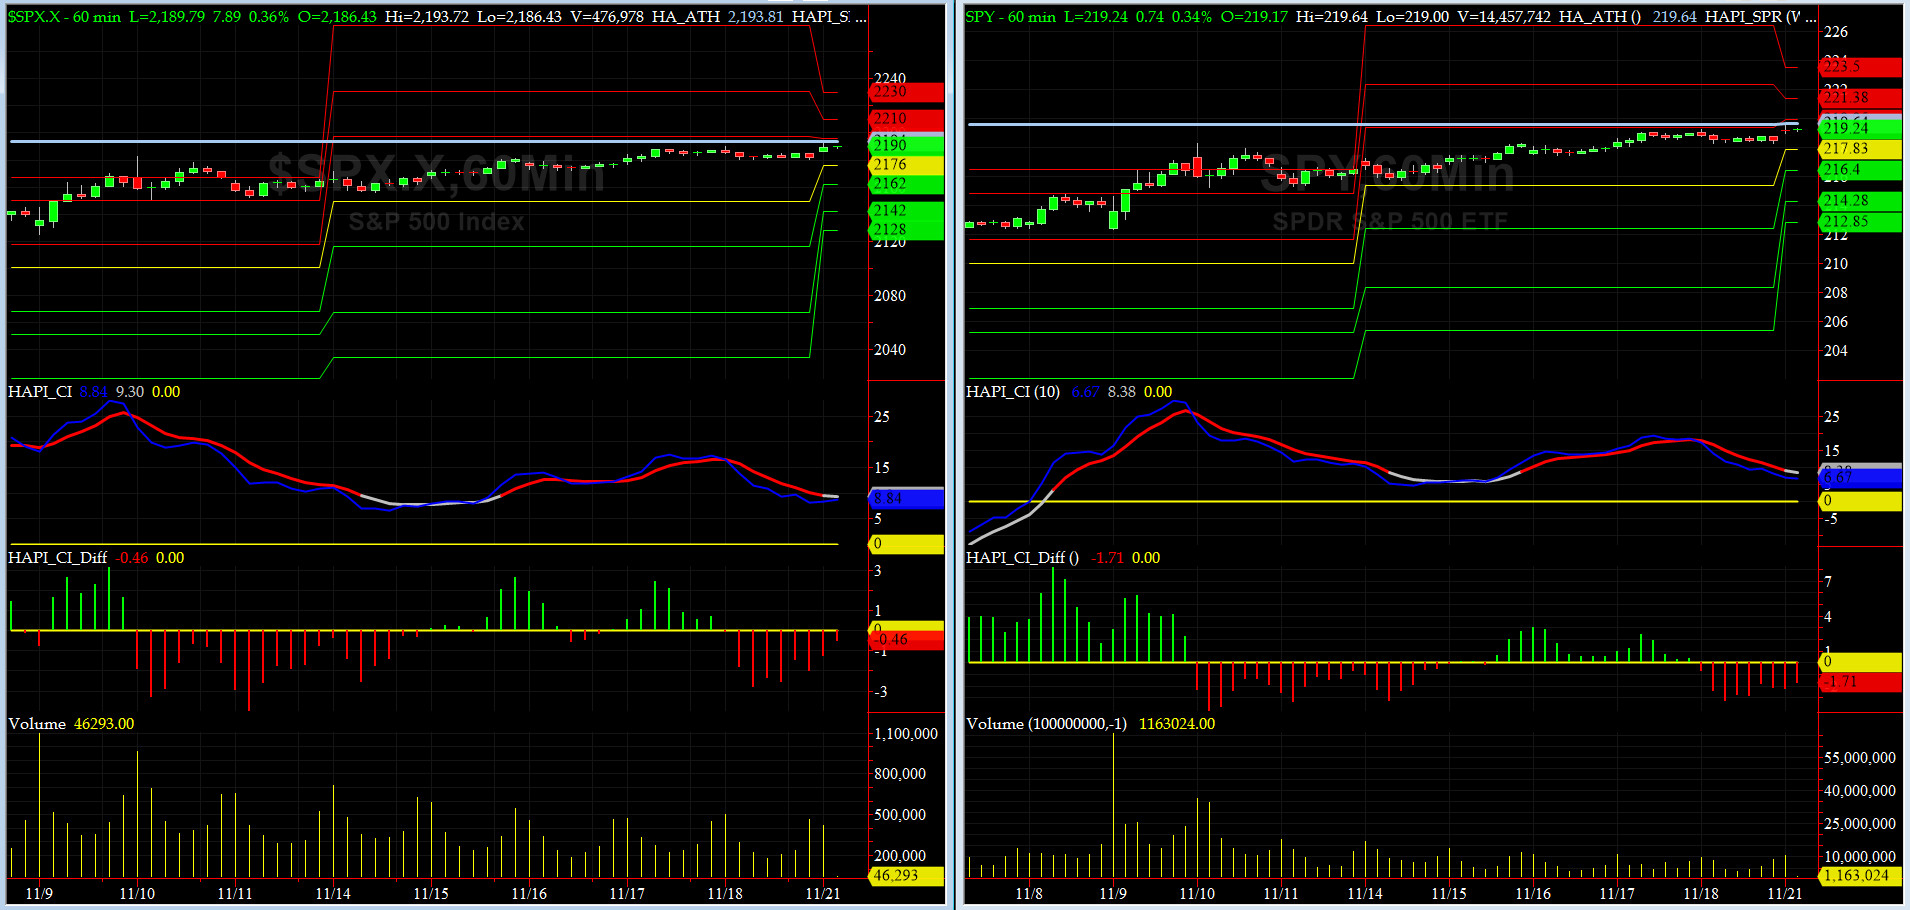
Most recent S&P-500 Cash Index (SPX): 2181.90 up +17.45 (up +0.81%) for the week ending Friday, November 18th, 2016, which closed again at about its +1.5 sigma.
SPX ALL TIME INTRADAY HIGH = 2193.81 (reached on Monday, August 15, 2016)
SPX ALL TIME CLOSING HIGH = 2190.15 (reached on Monday, August 15, 2016)
Current DAILY +2 Sigma SPX = 2203 with WEEKLY +2 Sigma = 2207
Current DAILY 0 Sigma (20 day MA) SPX = 2143 with WEEKLY 0 Sigma = 2156
Current DAILY -2 Sigma SPX = 2083 with WEEKLY -2 Sigma = 2105
NYSE McClellan Oscillator = +64 (-150 is start of the O/S area; around -275 to -300 area or lower, we go into the �launch-pad� mode, over +150, we are in O/B area)
NYSE Breadth Thrust = 57.6 (40 is considered as oversold and 65 as overbought)
Ceteris paribus, we plan to stay long SPX into next FOMC Meeting (Dec 13-14).
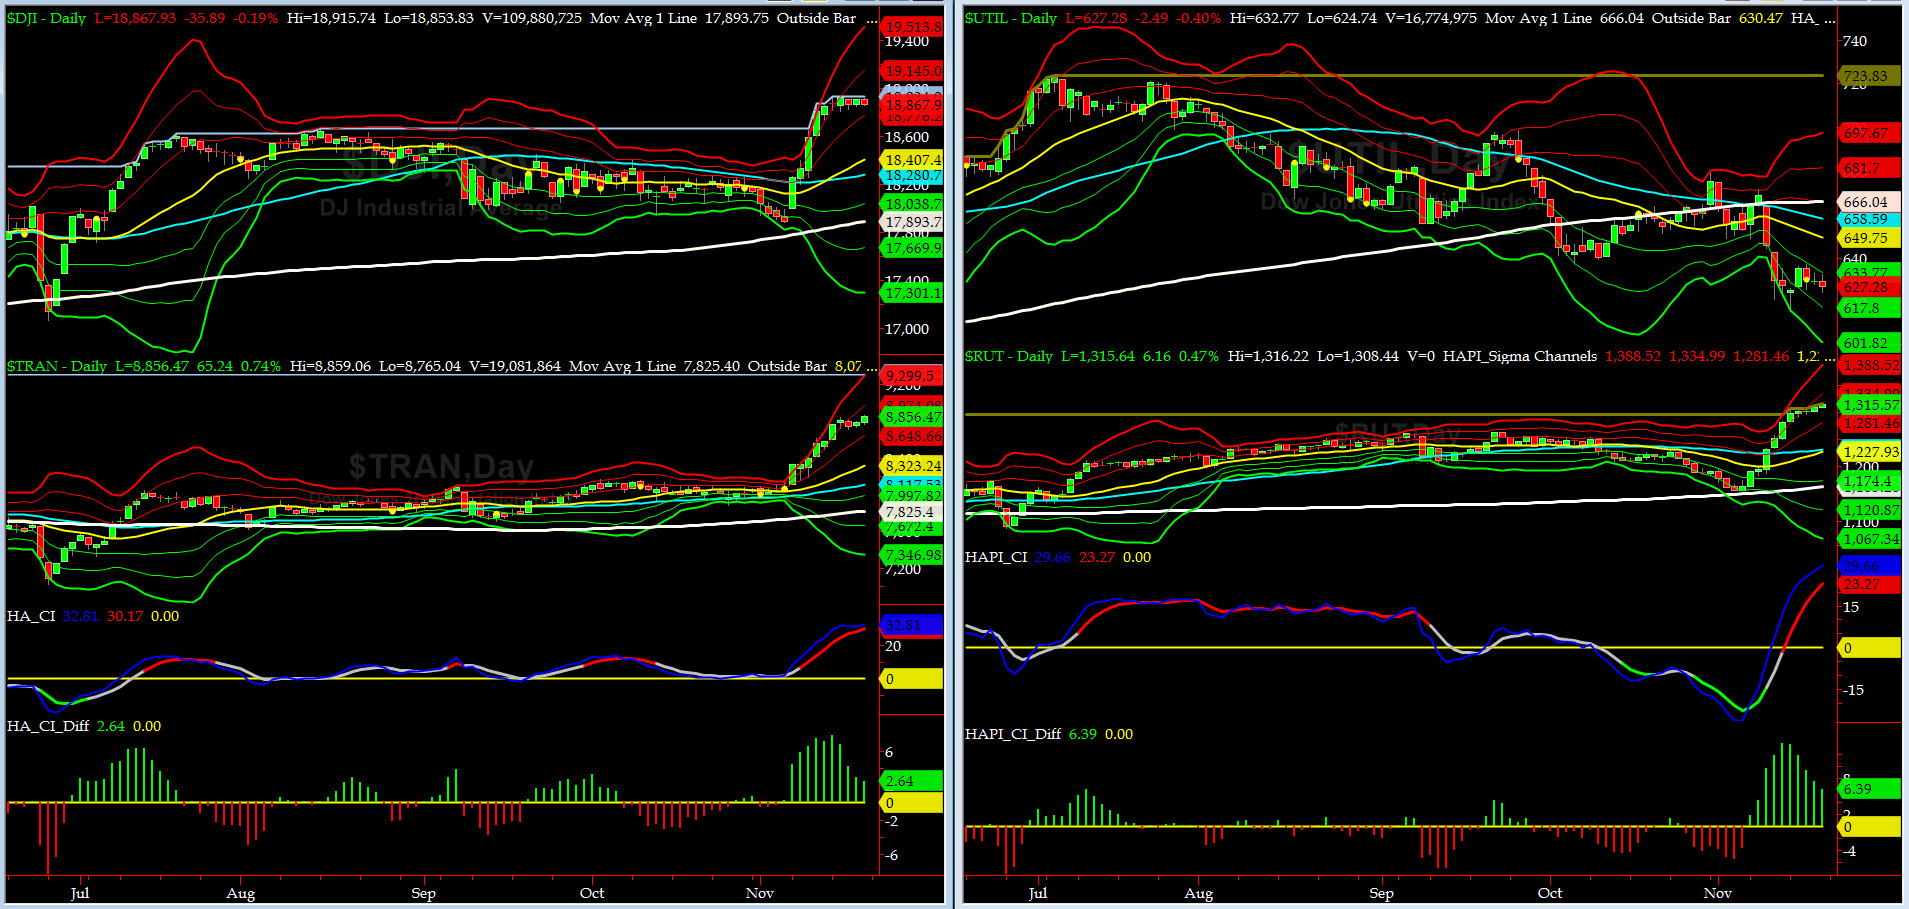
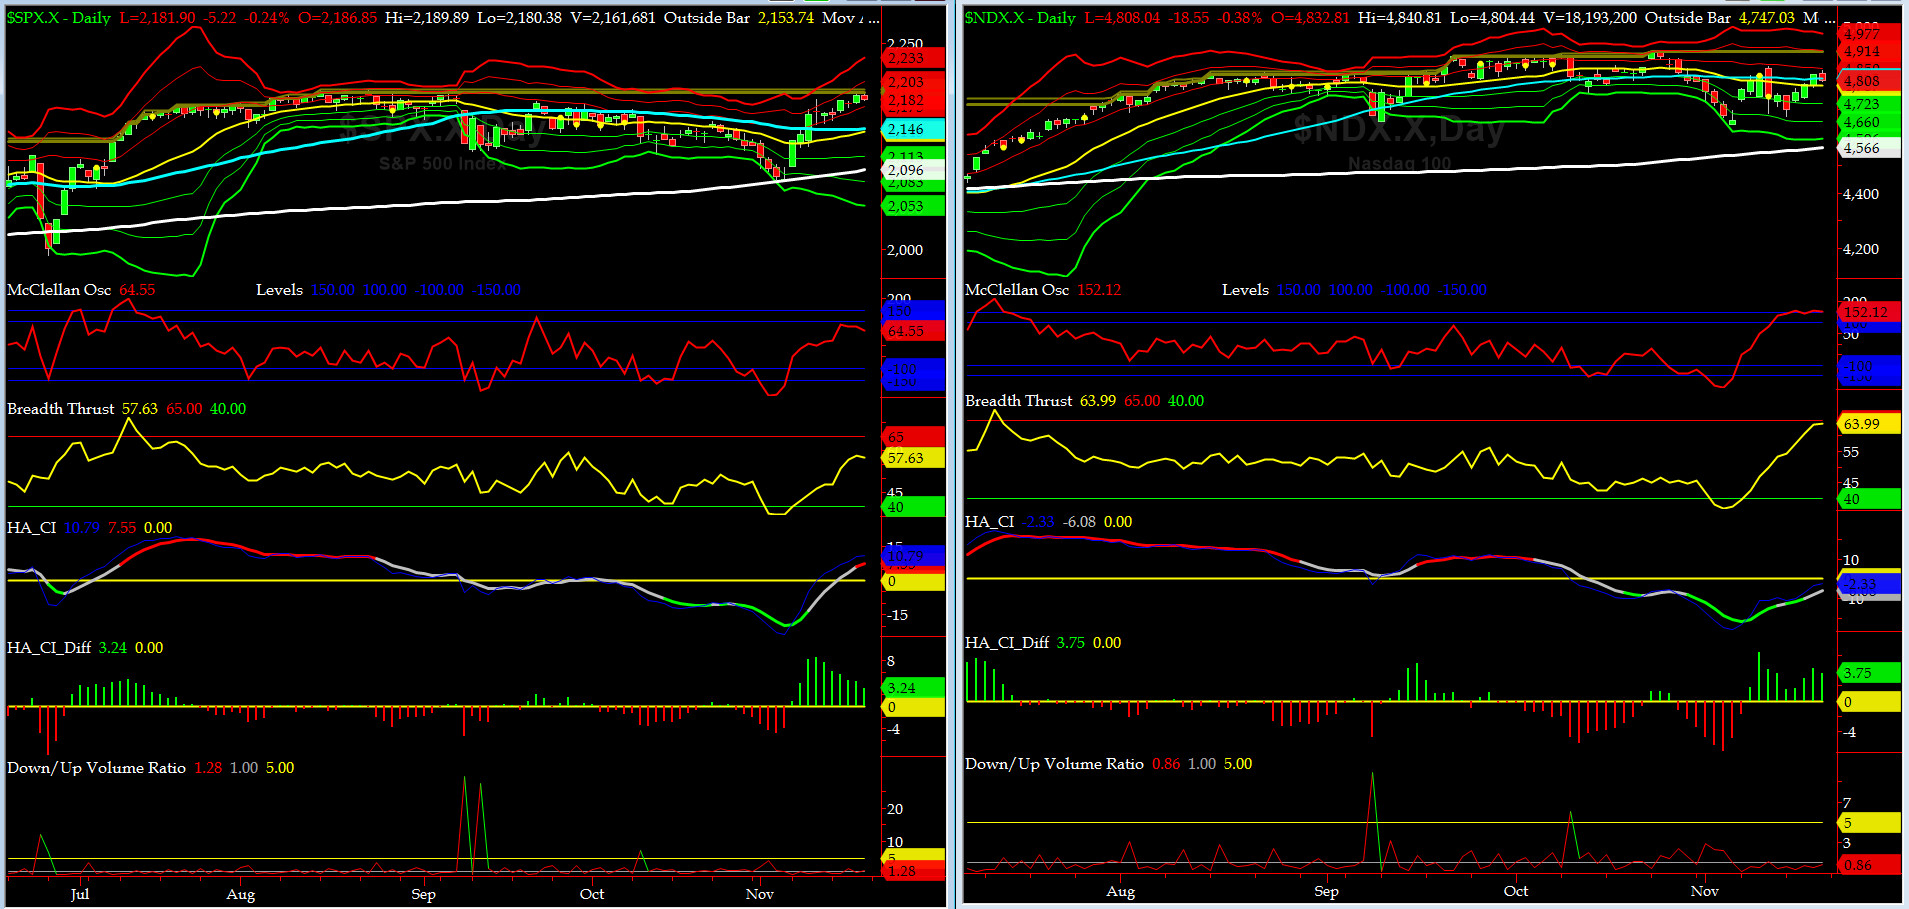
Canaries [in the Coal Mine] Chart for DJ TRAN & RUT Indices
200-Day MA DJ TRAN = 7825 or 13.2% below DJ TRAN (max observed in last 5 yrs = 20.2%, min = -20.3%)
200-Day MA RUT = 1163 or 13.1% below RUT (max observed in last 5 yrs = 21.3%, min = -22.6%)
DJ Transports (proxy for economic conditions 6 to 9 months hence) had another good week.
Russell 2000 small caps (proxy for Risk ON/OFF) had another tremendous week and rose by 2.6 percent. RISK is definitely ON.
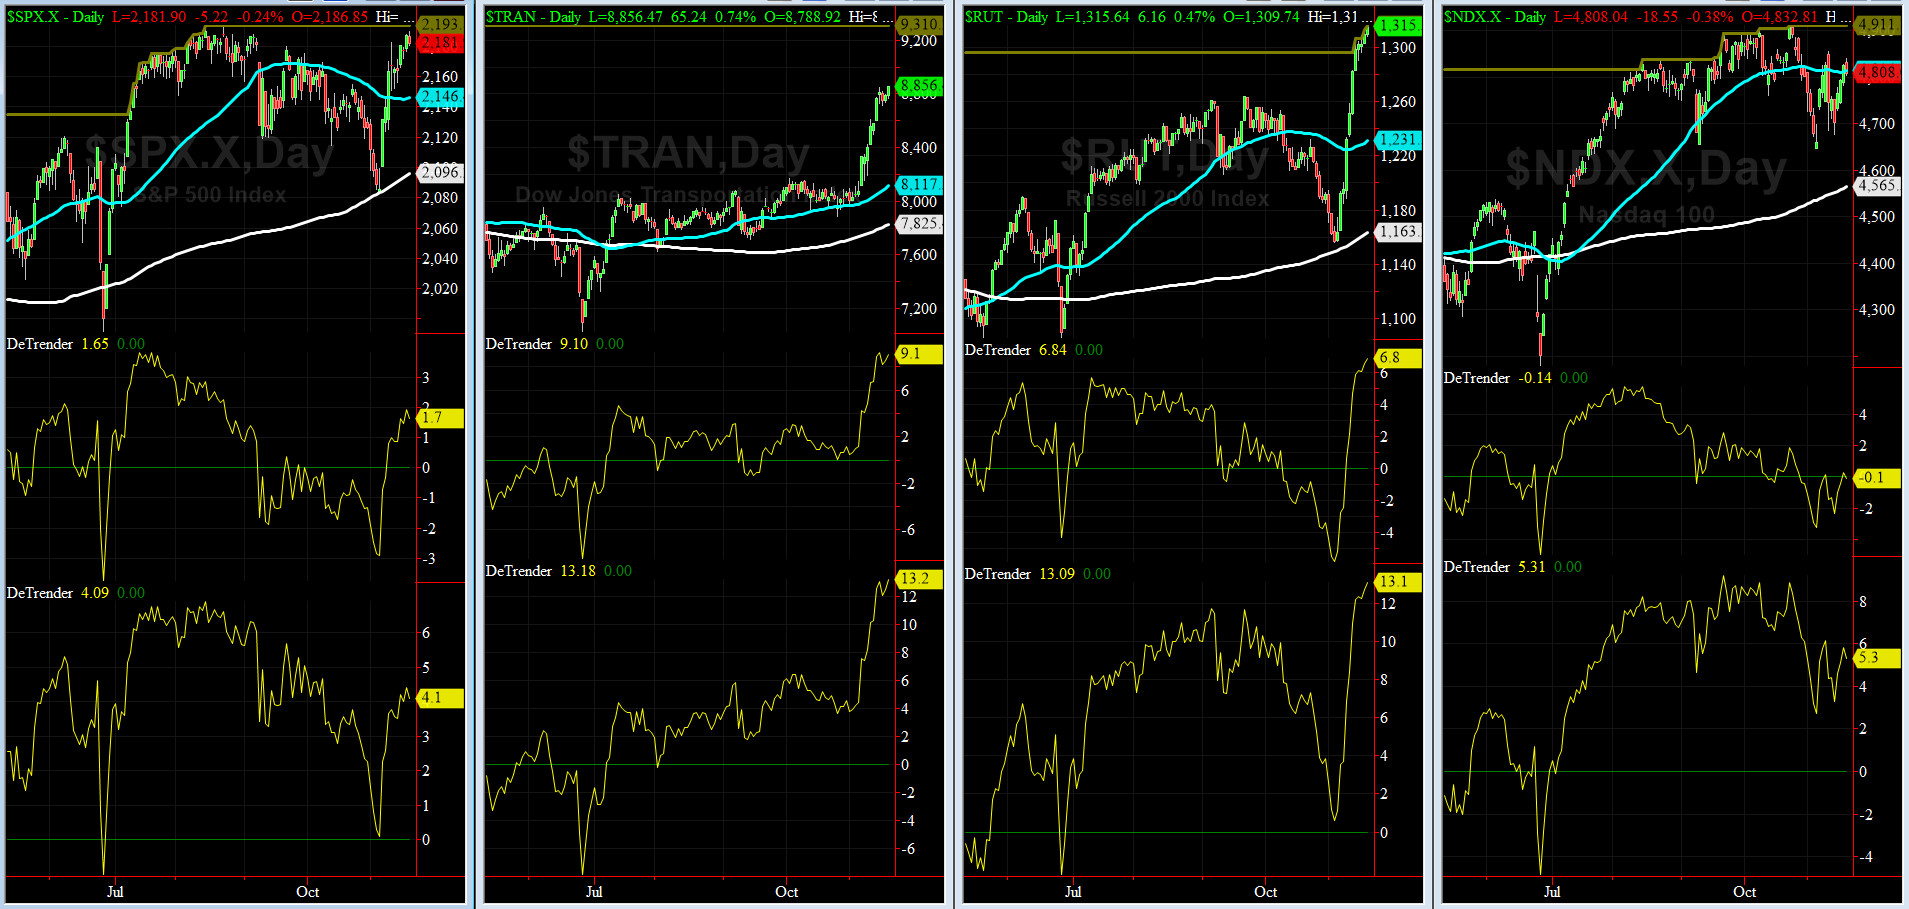
DeTrenders Charts for SPX, NDX, TRAN & RUT Indices
50-Day MA SPX = 2146 or 1.7 below SPX closed on Friday (max observed in last 5 yrs = +8.6%, min = -9.3%)
200-Day MA SPX = 2096 or 4.1% below SPX (max observed in last 5 yrs = 15.2%, min = -14%)
Only 1 of our 8 De Trenders are negative. The De Trenders for DJ TRAN & RUT will continue to be harbingers of future price behavior in broad indices.
HA_SP1_Momo Chart
WEEKLY Timing Model = on a SELL Signal since Friday 11/11/16 CLOSE at 2164
DAILY Timing Model = on a BUY Signal since Thursday 11/10/16 CLOSE at 2167
Max SPX 52wk-highs reading last week = 82 (over 120-140, the local maxima is in)
Max SPX 52wk-Lows reading last week = 4 (over 40-60, the local minima is in)
HA_SP1 = above its +1.5 sigma channels
HA_Momo = +3.48 (reversals most likely occur above +10 or below -10)
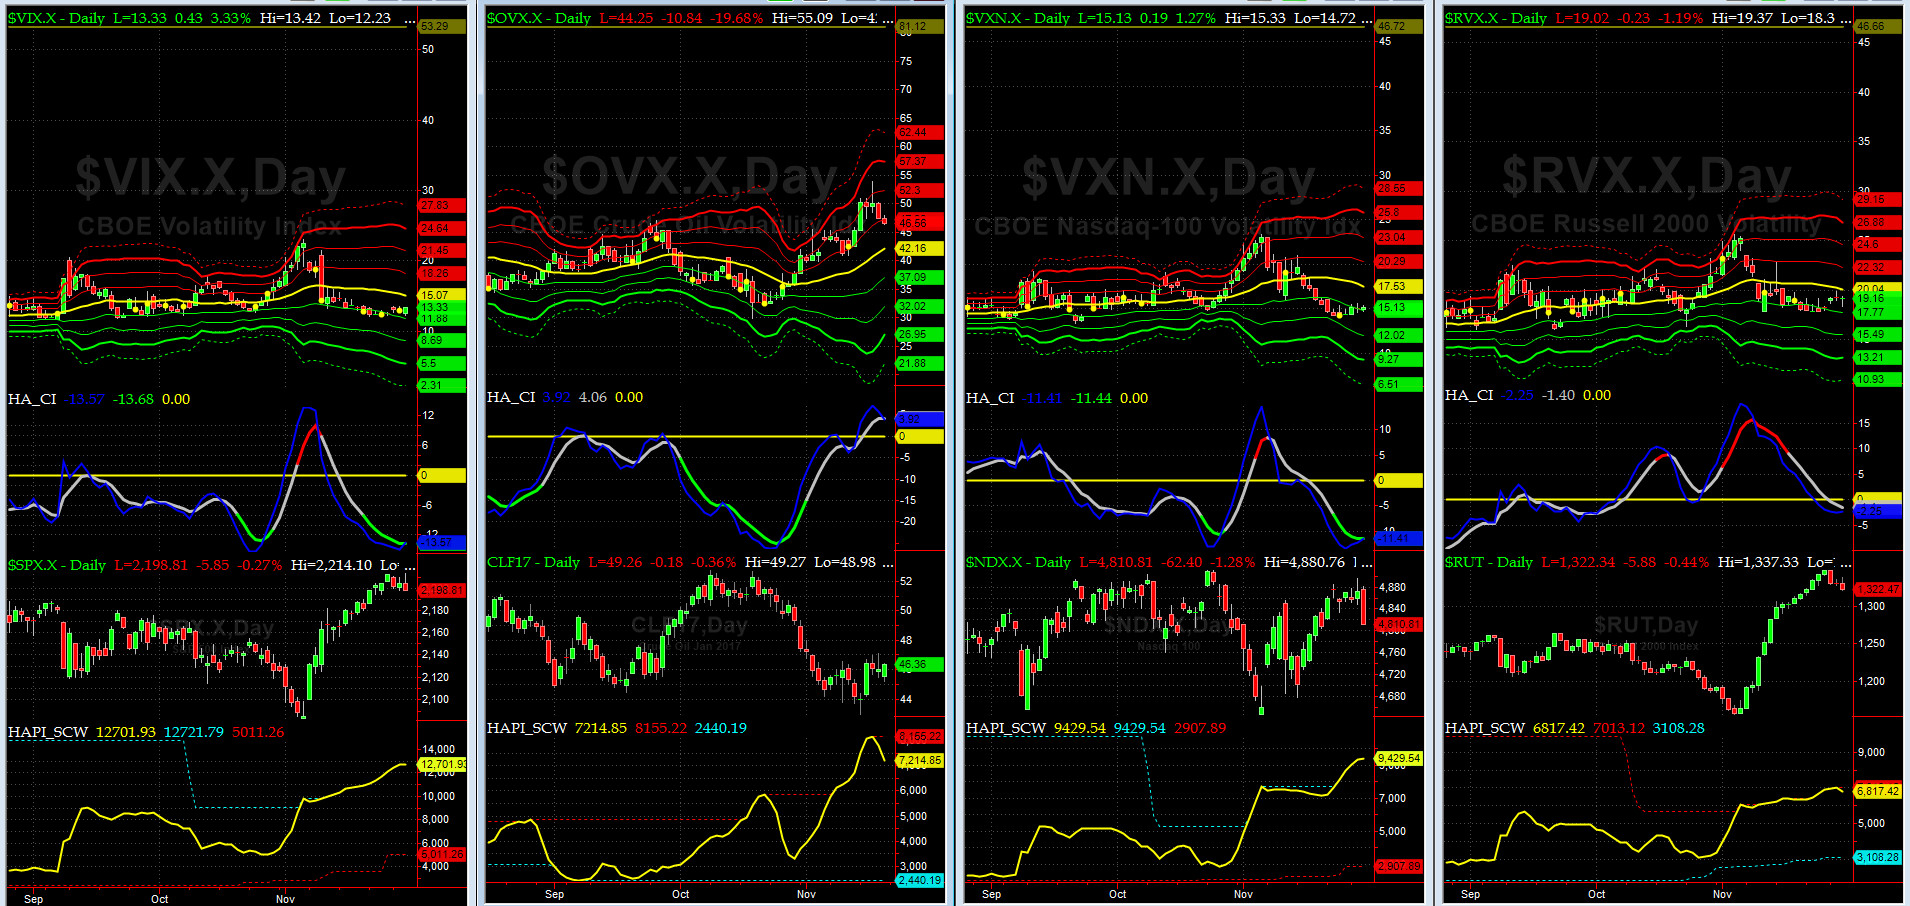
Vol of the Vols Chart
VIX is currently testing its -1 sigma level at 12.85 (remember it�s the VIX�s vol pattern (its sigma channels) that matters, and not the level of VIX itself (this is per Dr. Robert Whaley, a great mentor and the inventor of original VIX, now called VXO). VIX usually peaks around a test of its +4 sigma).
The current shock wave is over. VIX usually tends to reach exhaustion level once it captures its +4 sigma level.
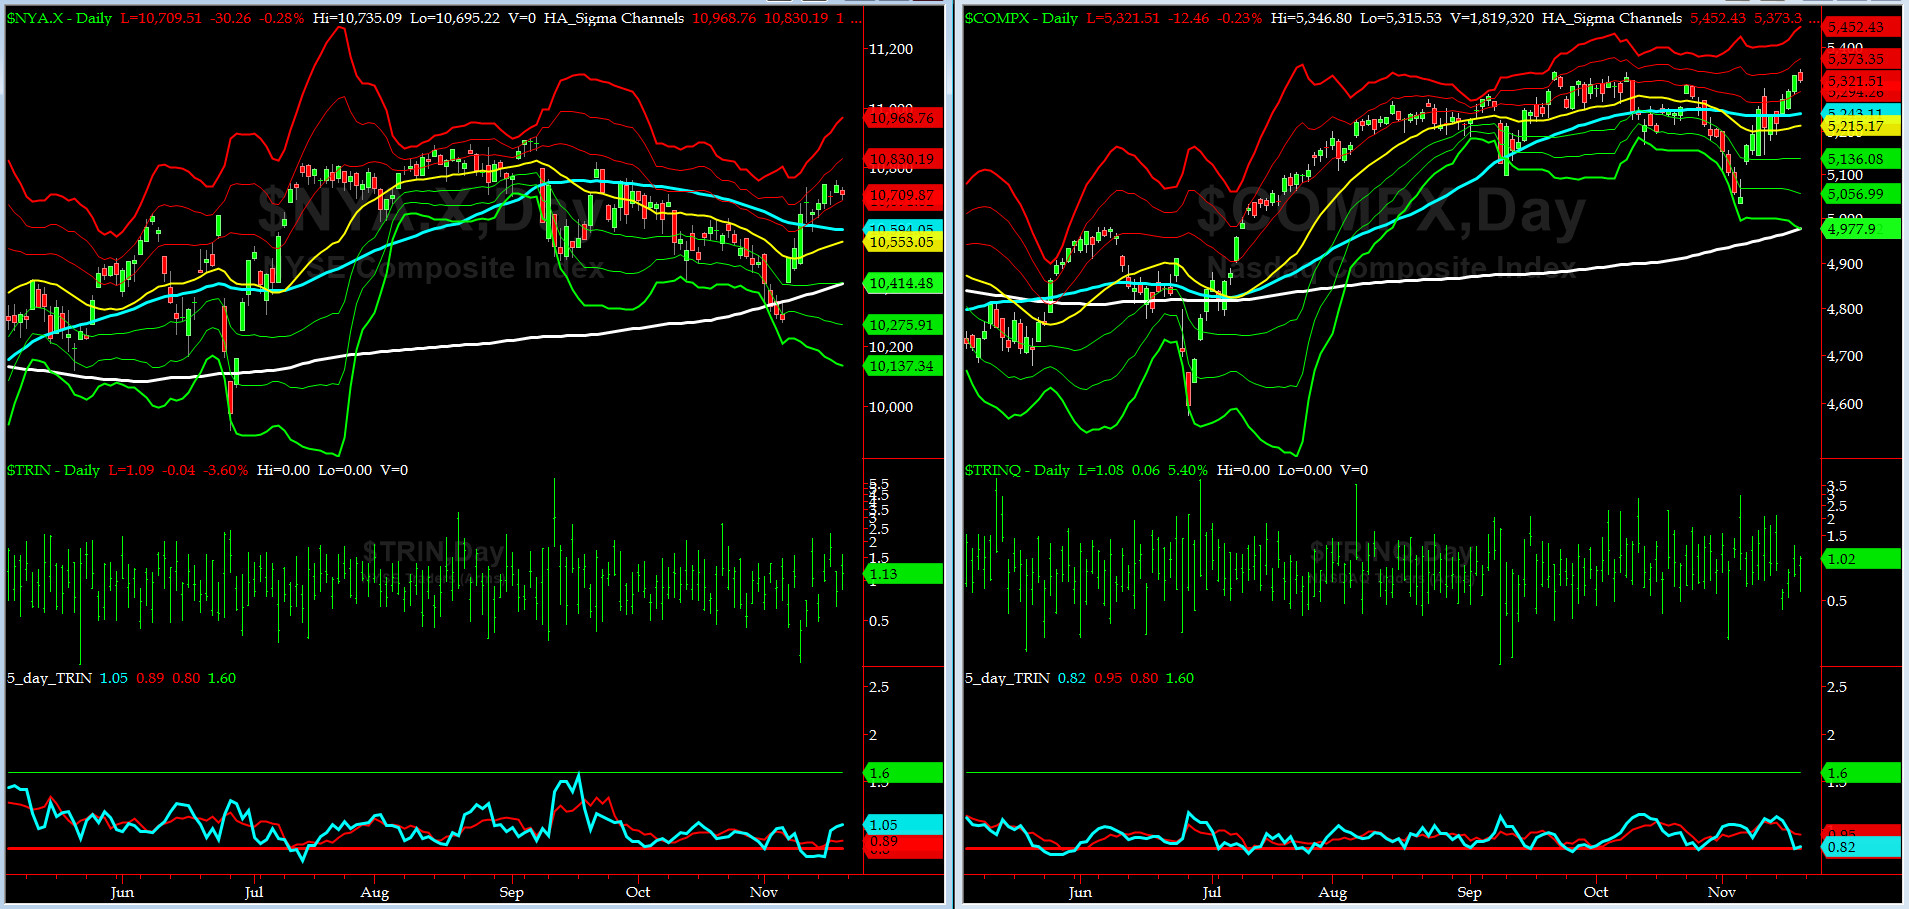
5-day TRIN & TRINQ Charts
NYSE 5-day TRIN is now in a NEUTRAL zone while its NASDAQ brethren gave a SELL signal.
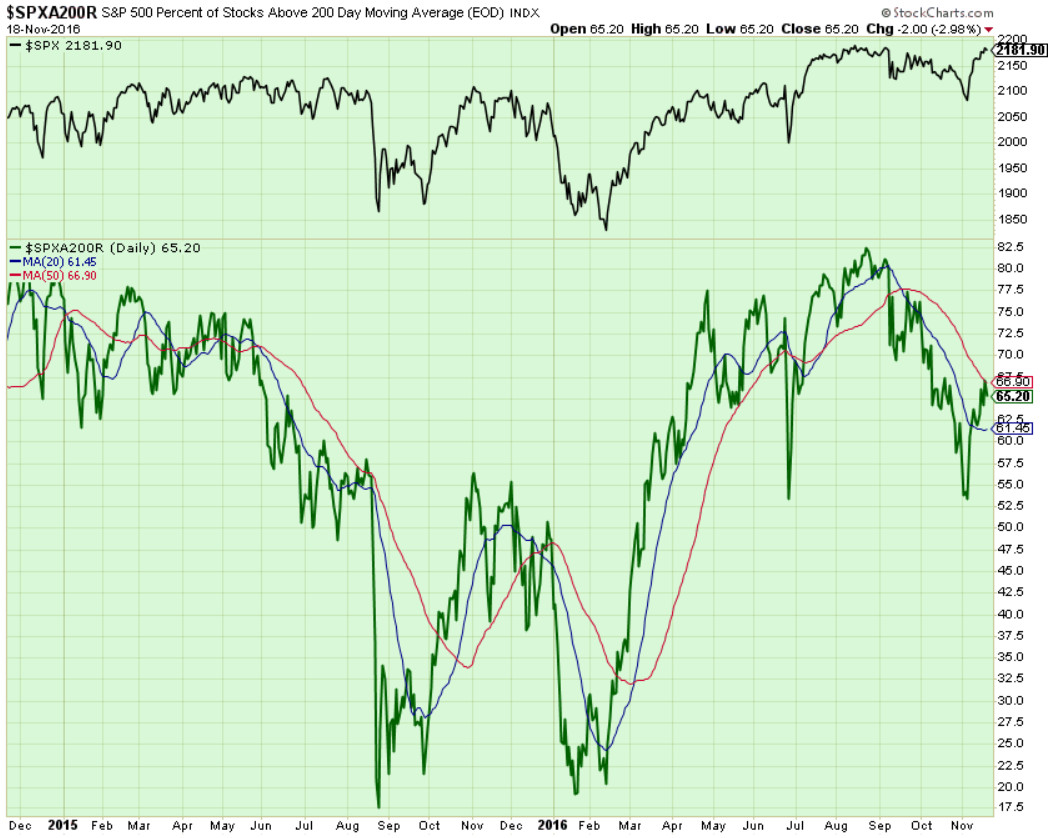
Components of SPX above their respective 200day MA Chart
This scoring indicator continued to rally and touched 67%. Every night this past week, my XO, @Capt_Tiko, checked this indicator after his evening meal (#TunaPower).
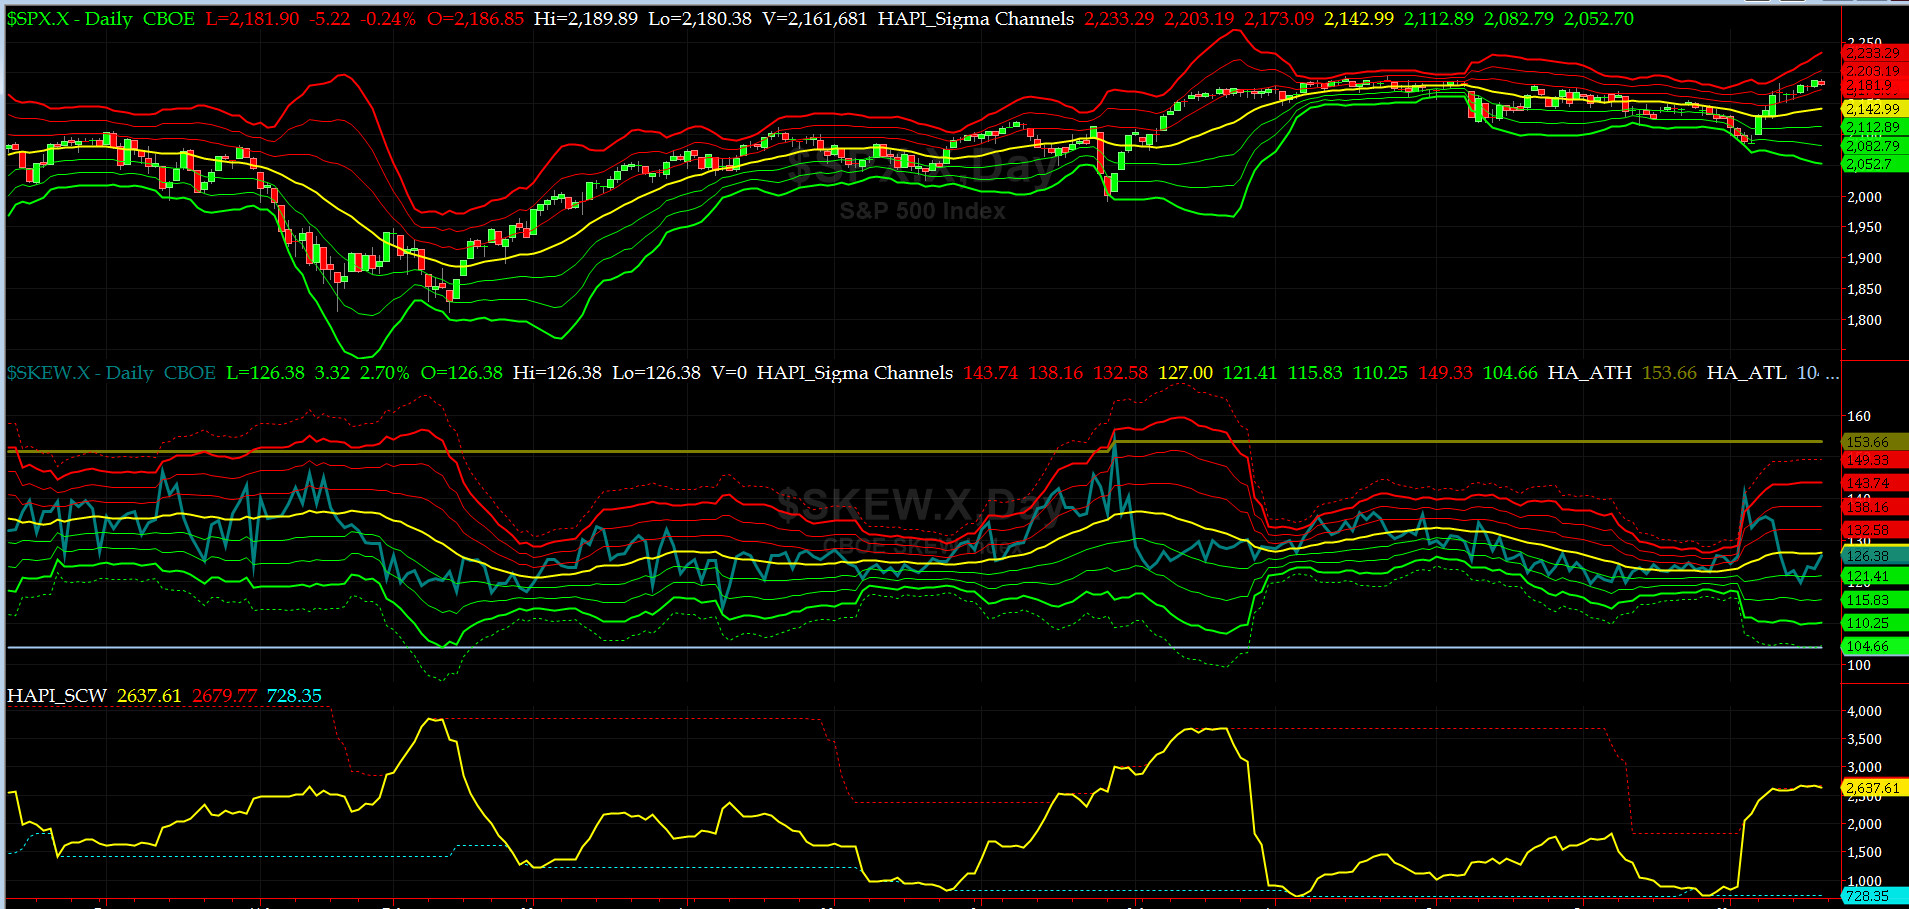
SPX SKEW (Tail Risk) Chart
Last week SPX SKEW (Tail Risk) first sank to its -1 sigma level and then rose to close at 126 this week, which is almost its zero sigma level (normal = 120-125, range 100-150).
All is getting quieter on the Eastern Front (WASH-BOS Elite Corridor).
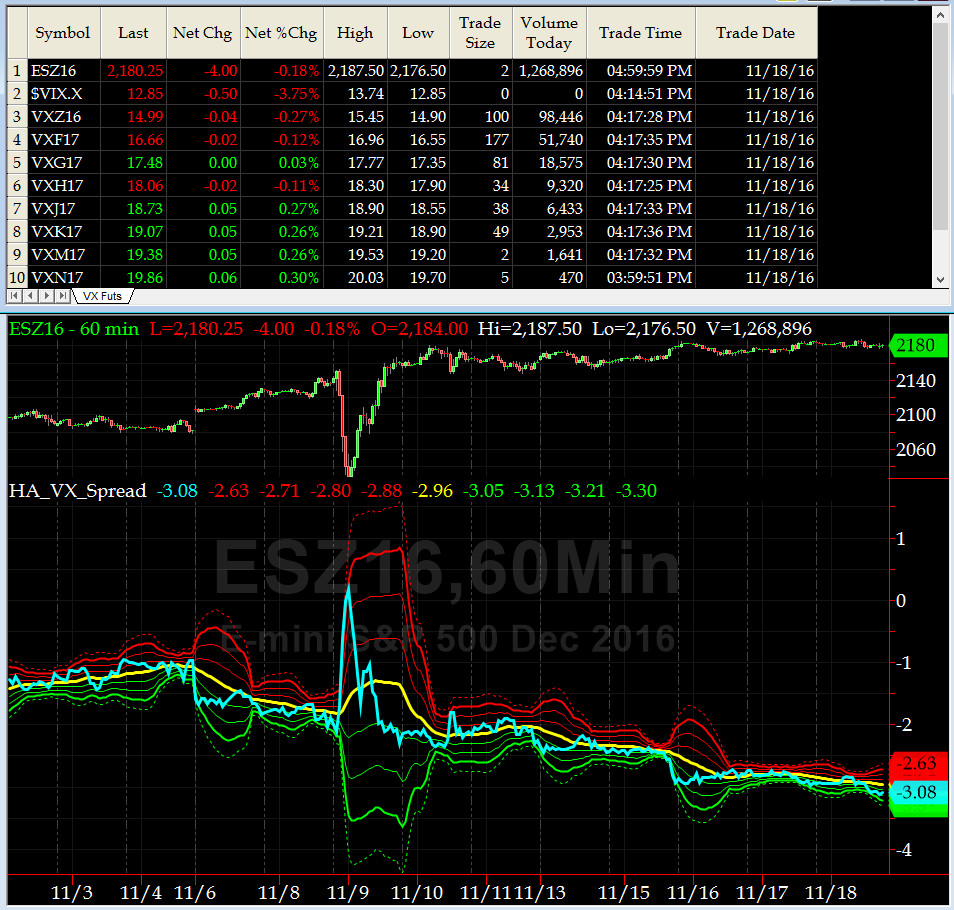
3-month VIX Futures Spread(VX) Chart
Our 3-month VIX Futures Spread (LONG DEC16 & SHORT MAR17) closed at -3.08 on Friday. This spread continued to drop as we slowly grinded up.

HA_SP2 Chart
HA_SP2 = 71.26 (Buy signal <= 25, Sell Signal >= 75)
This indicator is OverBought now. Tiko was dead right two weeks ago. #TunaPower. Keep in mind, it can stay overbought just like it did in late July.

SPX 2000 Analog for SPX 2016
This is The End (of this Analog Chart) -- just as Jim Morrison sang it, almost exactly 50 years ago, at Whiskey a Go Go on Sunset Strip in LA.
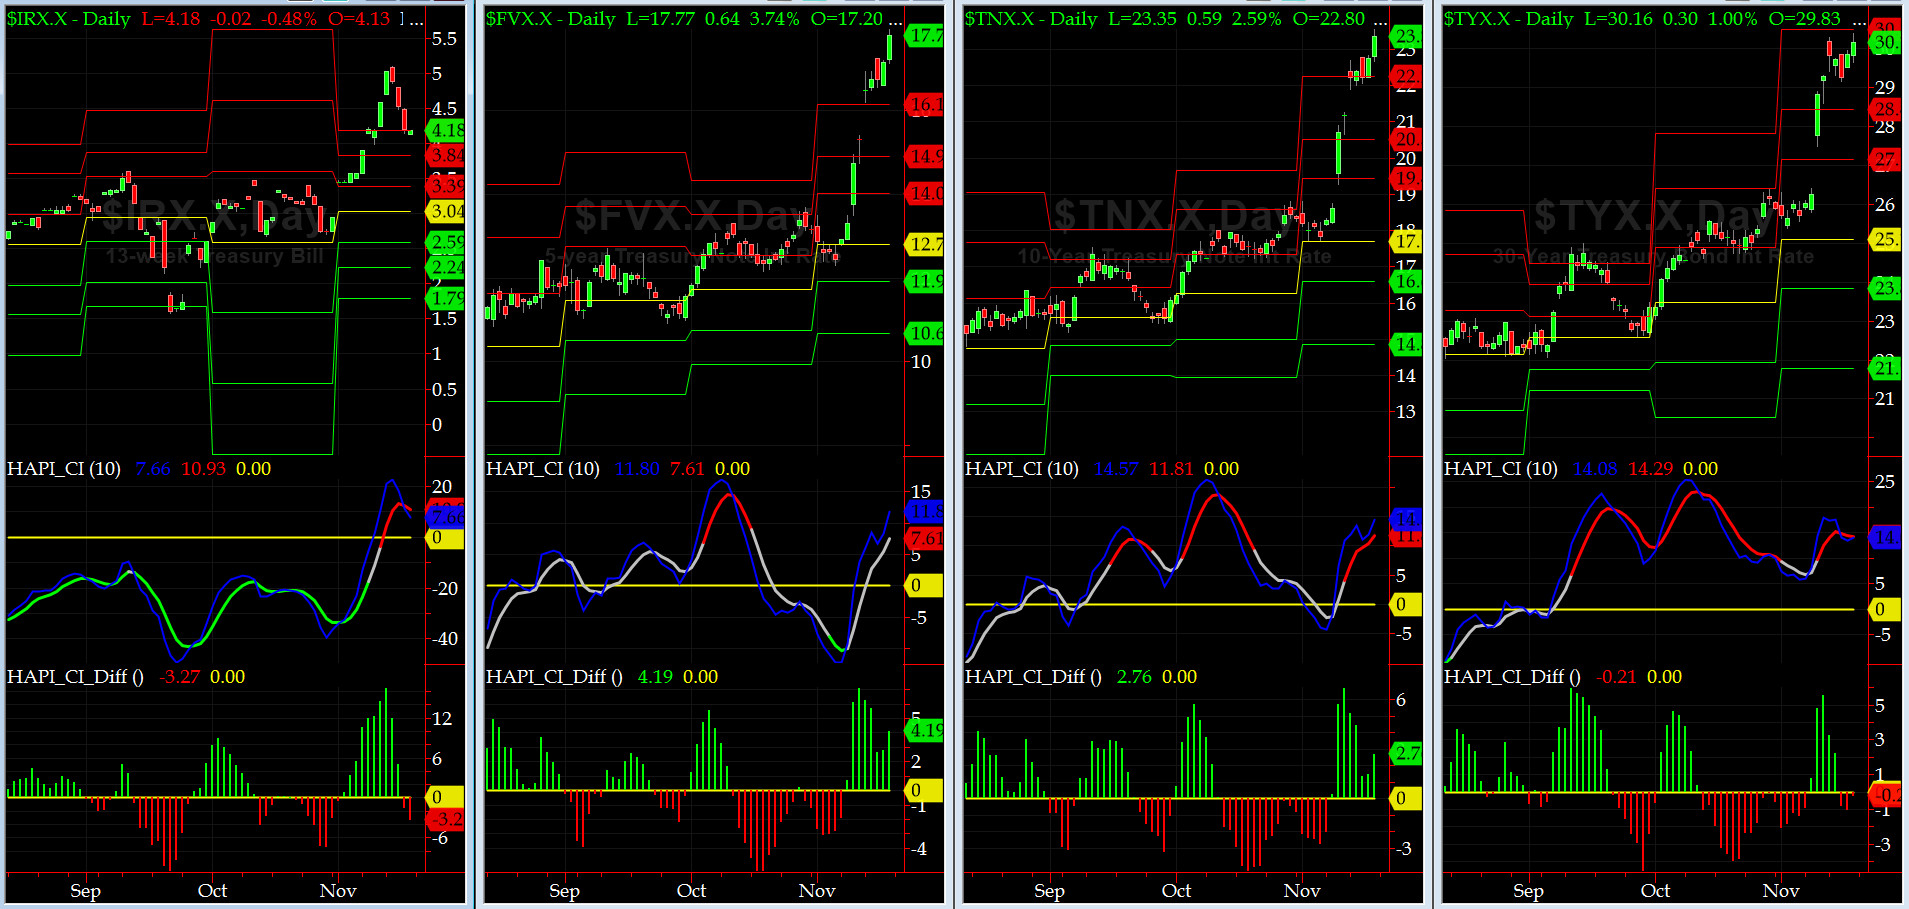
US Treasury T-Notes & T-Bonds Yields Chart
The YTMs on Treasury Complex shot up further except in the front end. The expected uptick in Asset Allocation trade is finally here just as our much-awaited OTF Treasury Streamer is launched. Only in the NEW AMERICA........CHEERS.
Fari Hamzei
|


 Proactive Market Timing