|
Monday, December 26, 2016, 2300ET
Market Timing Charts, Analysis & Commentary for Issue #173
Timer Charts of S&P-500 Cash Index (SPX) + NASDAQ-100 Cash Index (NDX)
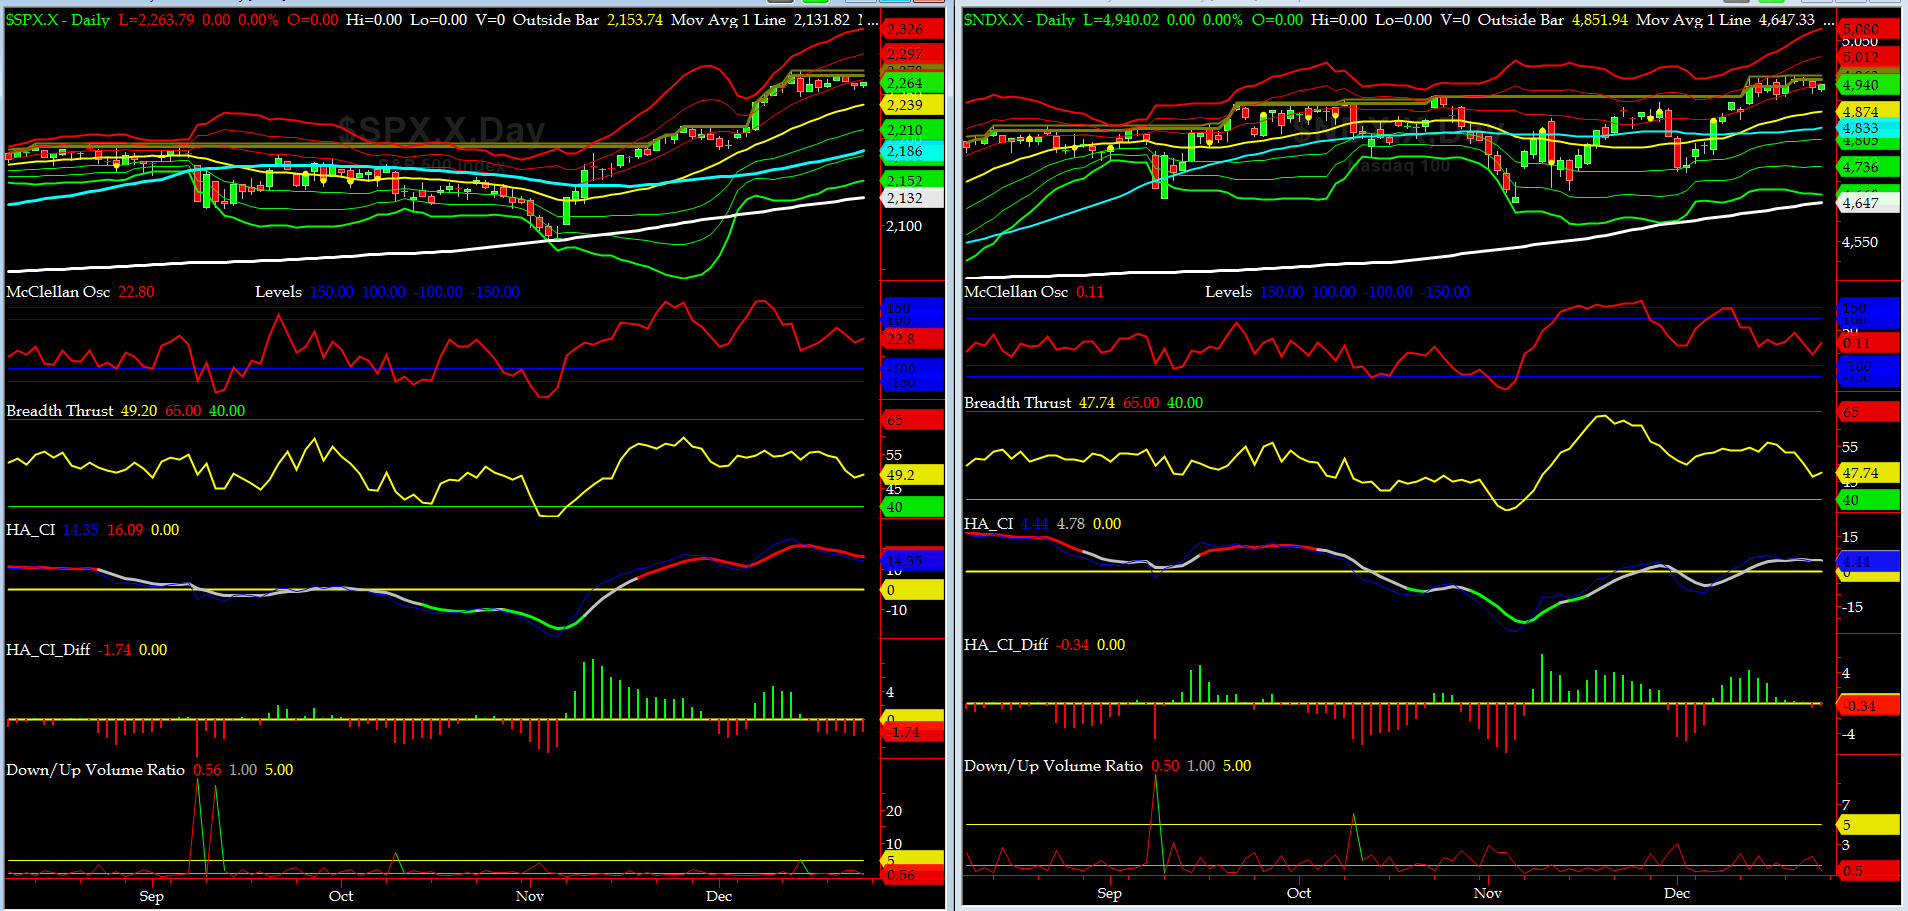
Most recent S&P-500 Cash Index (SPX): 2263.79 up +5.72 (up 0.25%) for the week ending Friday, December 23th, 2016, which closed near its +1 sigma.
SPX ALL TIME INTRADAY HIGH = 2277.53 (reached on Tuesday, December 13, 2016)
SPX ALL TIME CLOSING HIGH = 2271.72 (reached on Tuesday, December 13, 2016)
Current DAILY +2 Sigma SPX = 2297 with WEEKLY +2 Sigma = 2266
Current DAILY 0 Sigma (20 day MA) SPX = 2239 with WEEKLY 0 Sigma = 2174
Current DAILY -2 Sigma SPX = 2181 with WEEKLY -2 Sigma = 2083
NYSE McClellan Oscillator = +23 (-150 is start of the O/S area; around -275 to -300 area or lower, we go into the �launch-pad� mode, over +150, we are in O/B area)
NYSE Breadth Thrust = 49.2 (40 is considered as oversold and 65 as overbought)
Not much change was seen from prior week.

Canaries [in the Coal Mine] Chart for DJ TRAN & RUT Indices
200-Day MA DJ TRAN = 8042 or 14.3% below DJ TRAN (max observed in last 5 yrs = 20.2%, min = -20.3%)
200-Day MA RUT = 1202 or 14.1% below RUT (max observed in last 5 yrs = 21.3%, min = -22.6%)
DJ Transports (proxy for economic conditions 6 to 9 months hence) changed very little last week.
Russell 2000 small caps (proxy for Risk ON/OFF) changed very little last week.
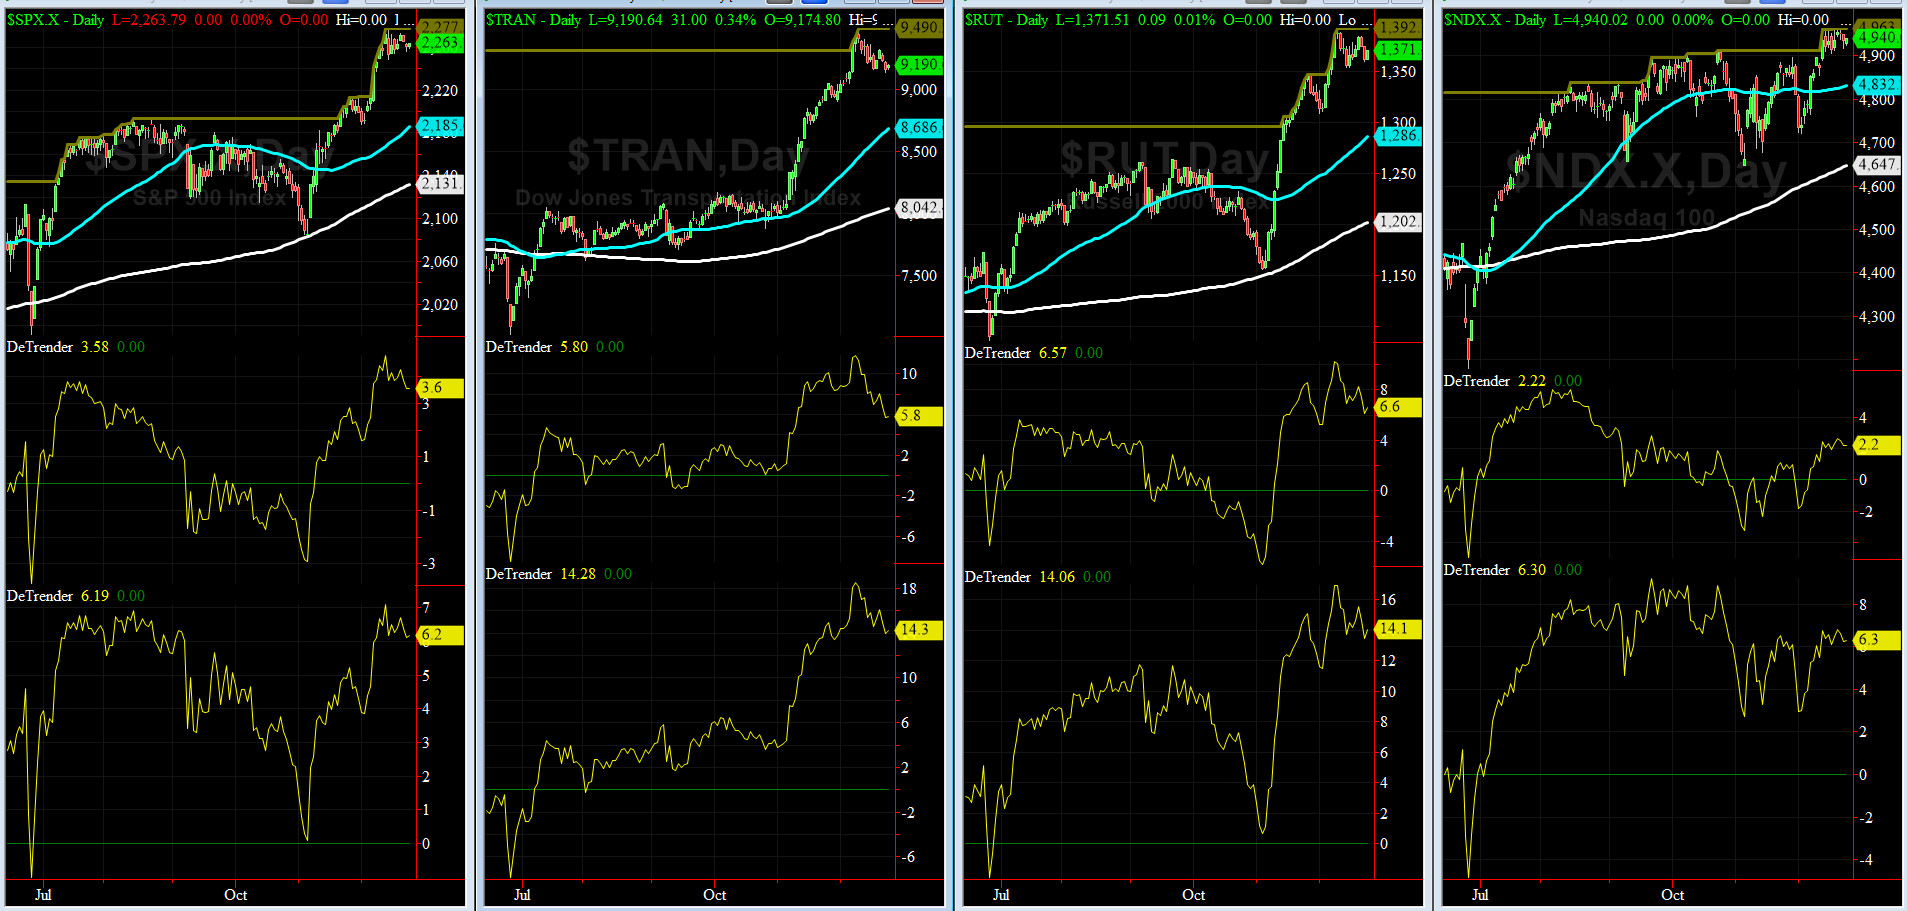
DeTrenders Charts for SPX, NDX, TRAN & RUT Indices
50-Day MA SPX = 2185 or 3.6% below SPX closed on Friday (max observed in last 5 yrs = +8.6%, min = -9.3%)
200-Day MA SPX = 2131 or 6.2% below SPX (max observed in last 5 yrs = 15.2%, min = -14%)
NONE of our eight DeTrenders are negative. The DeTrenders for DJ TRAN & RUT will continue to be harbingers of future price behavior in broad indices.
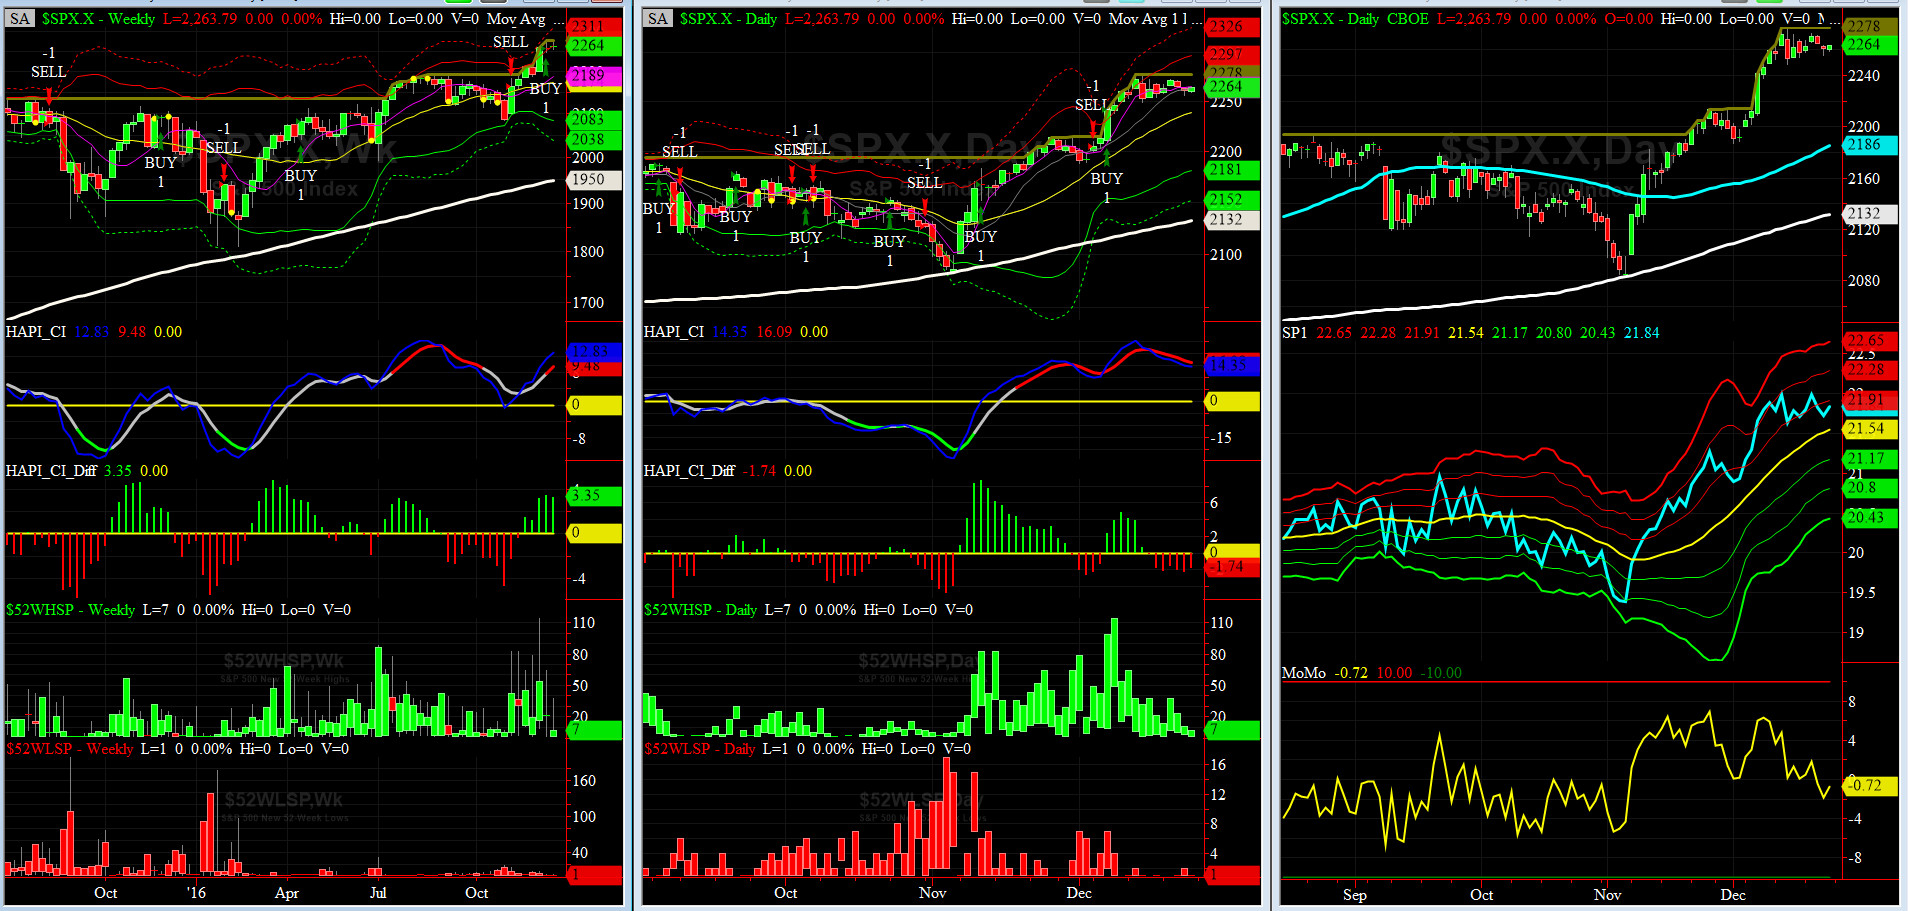
HA_SP1_Momo Chart
WEEKLY Timing Model = on a BUY Signal since Friday 12/16/16 CLOSE at 2258
DAILY Timing Model = on a BUY Signal since Wednesday 12/07/16 CLOSE at 2241
Max SPX 52wk-highs reading last week = 37 (over 120-140, the local maxima is in)
Max SPX 52wk-Lows reading last week = 2 (over 40-60, the local minima is in)
HA_SP1 = very near its +1 sigma channels
HA_Momo = -0.7 (reversals most likely occur above +10 or below -10)
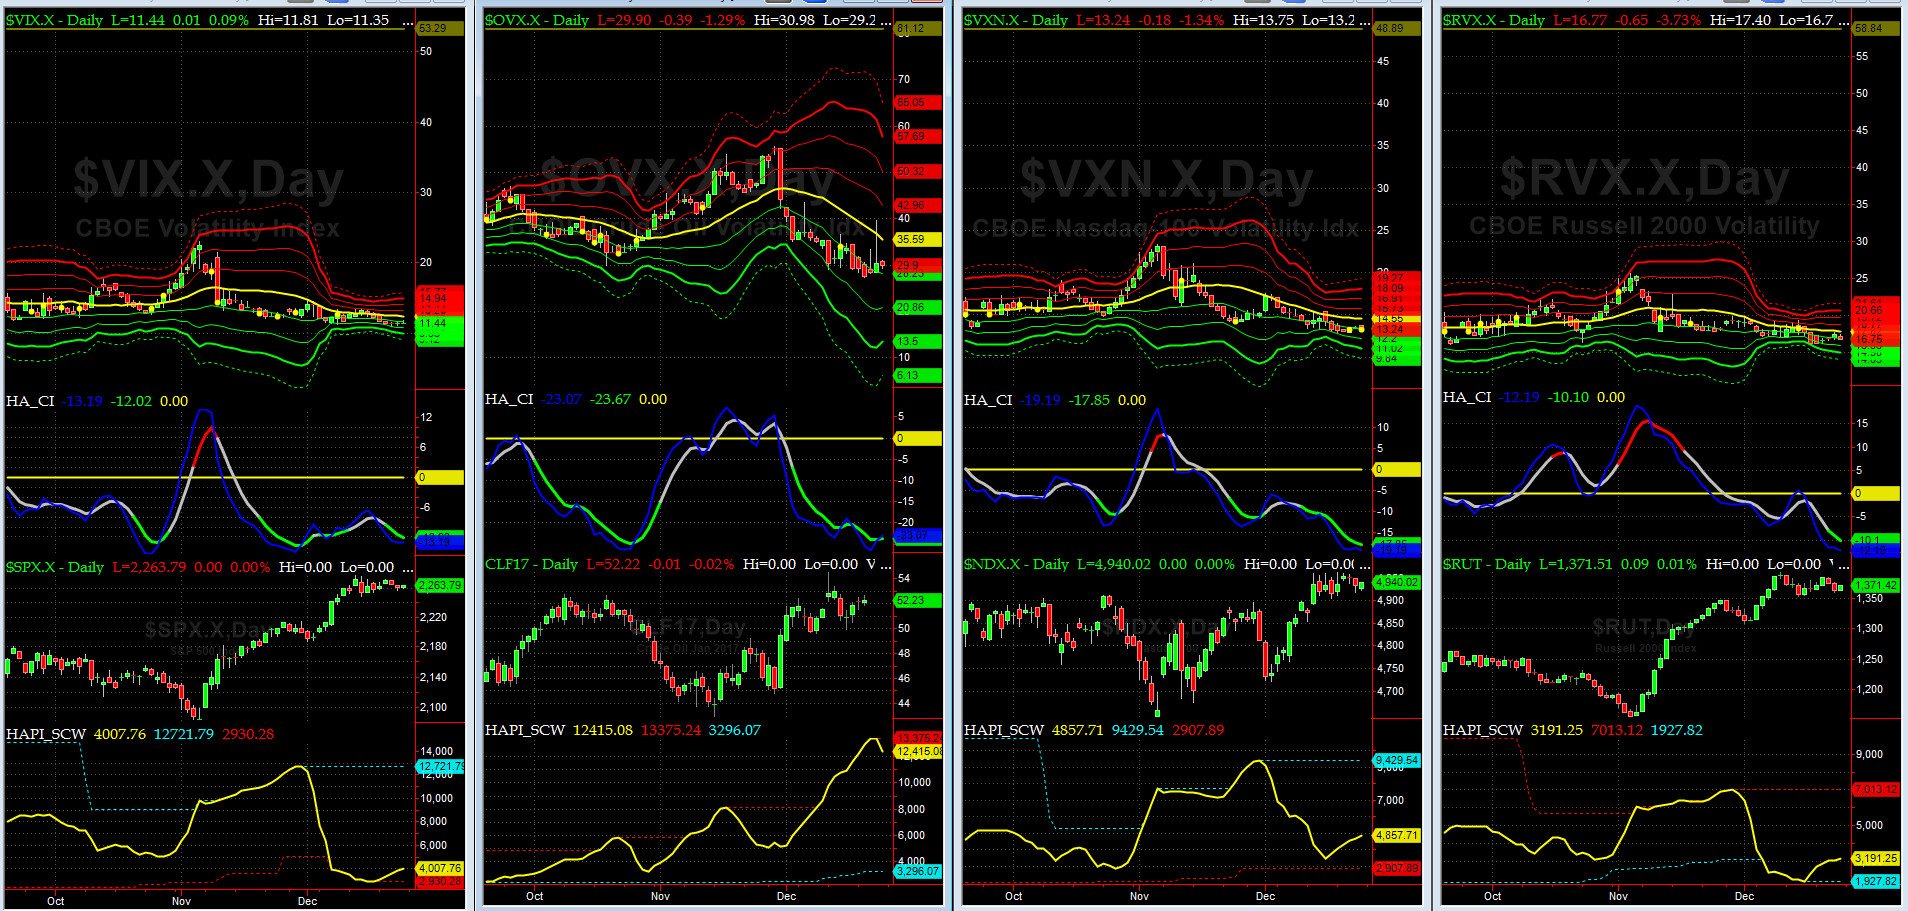
Vol of the Vols Chart
VIX is currently at its -1 sigma level at 11.5 (remember it�s the VIX�s vol pattern (its sigma channels) that matters, and not the level of VIX itself (this is per Dr. Robert Whaley, a great mentor and the inventor of original VIX, now called VXO). VIX usually peaks around a test of its +4 sigma).
VIX Complex changed very little last week.
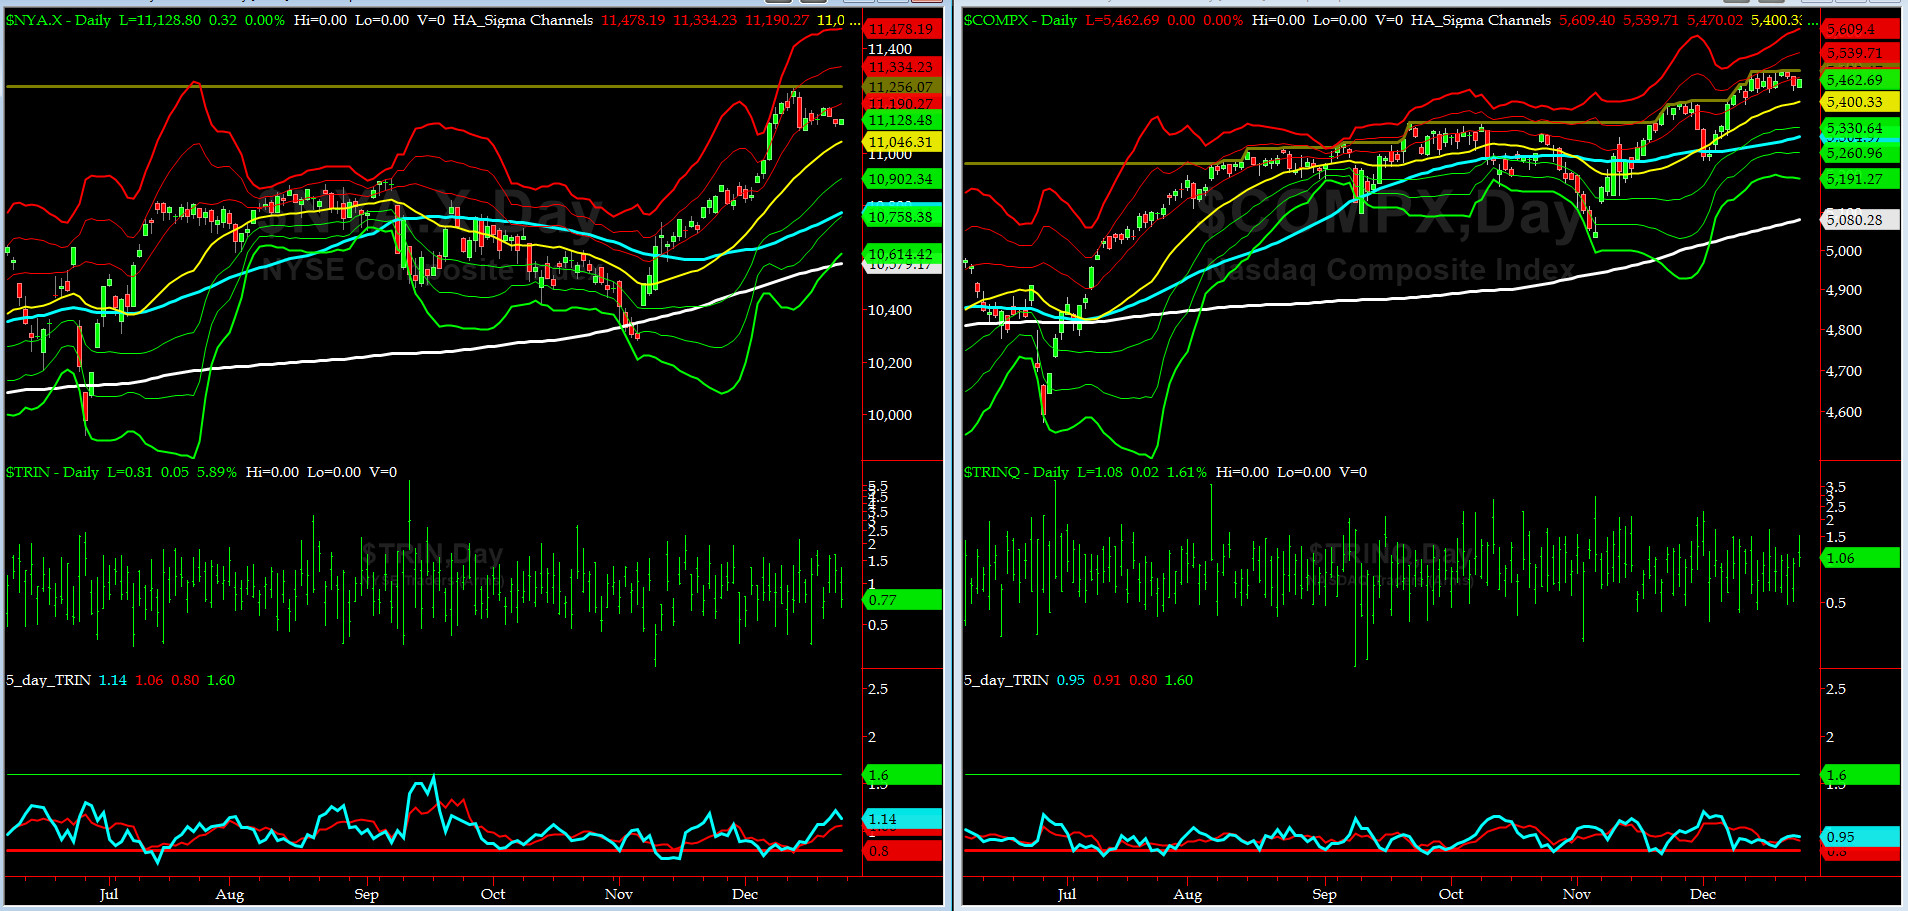
5-day TRIN & TRINQ Charts
Both NYSE & NASDAQ 5-day TRINs are NEUTRAL right now.
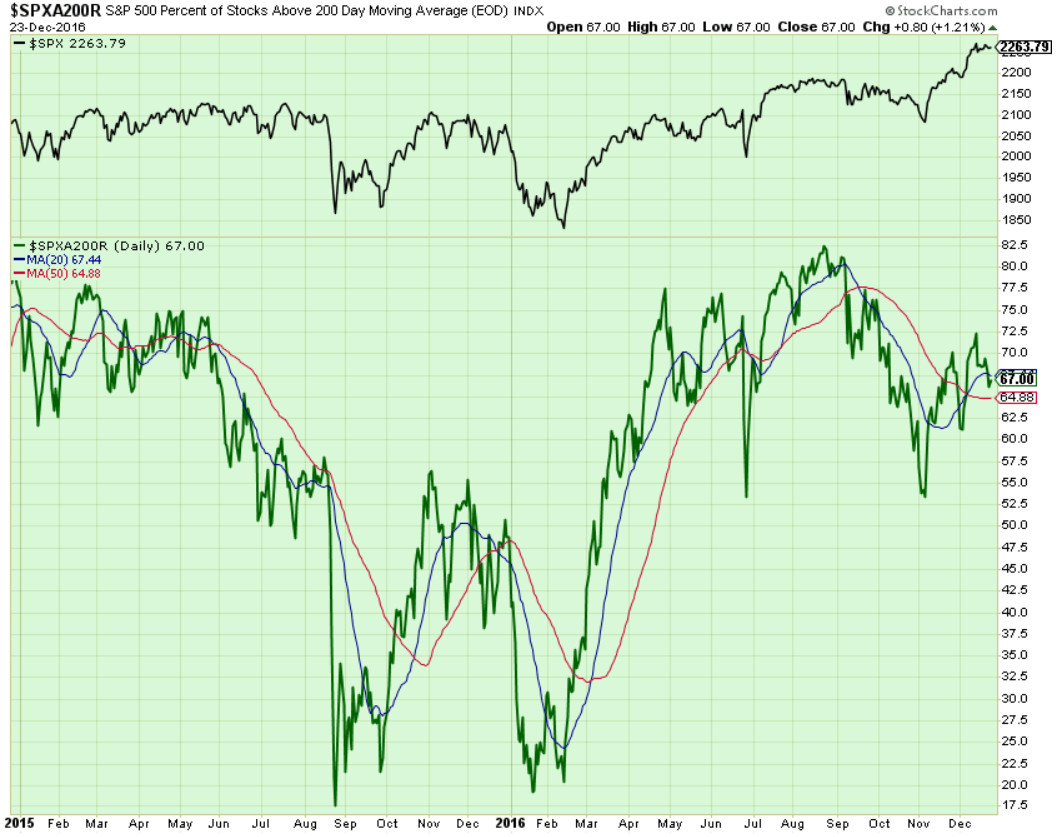
Components of SPX above their respective 200day MA Chart
This scoring indicator retreated to 67% which shows very little change from last week.
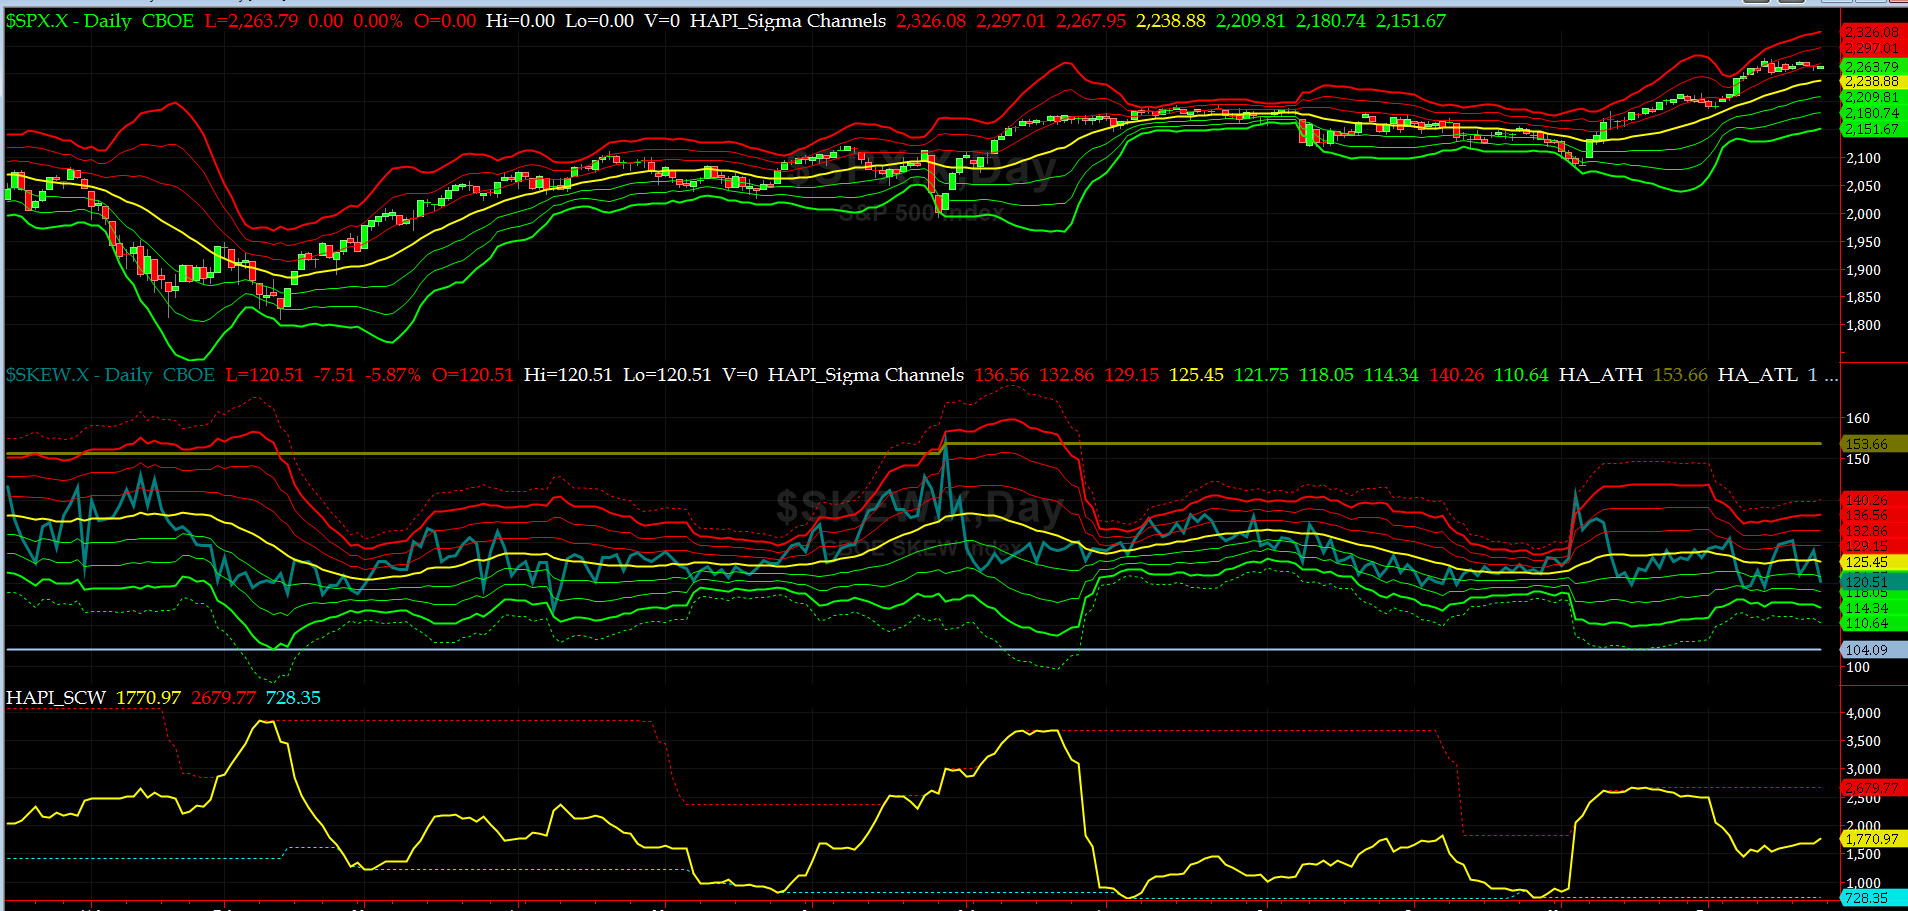
SPX SKEW (Tail Risk) Chart
Last week SPX SKEW (Tail Risk) spiked to its +1 sigma level then back down to -1 sigma and then closed at 120. (normal = 120-125, range 100-150).
All remain quiet on the Eastern & Mid-Western Fronts as SKEW sigma channels are very tightly spaced.
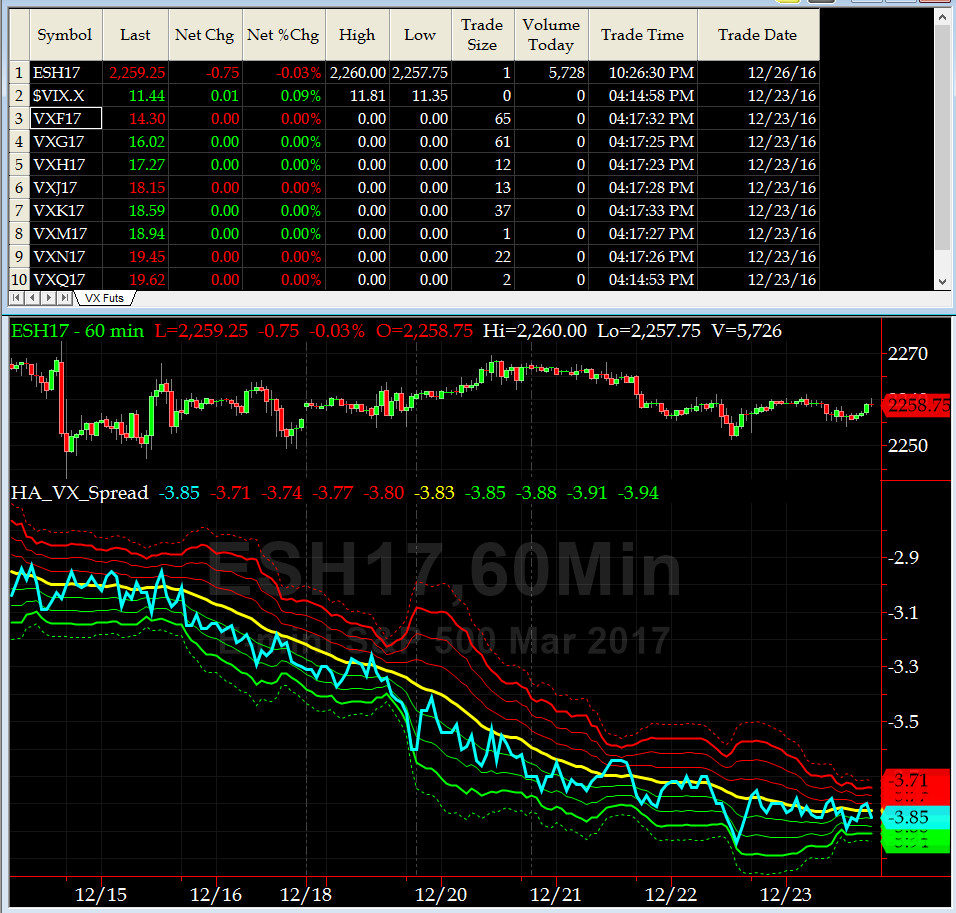
3-month VIX Futures Spread(VX) Chart
So, Our 3-month VIX Futures Spread (LONG JAN17 & SHORT APR17) closed at -3.85 on Friday. This spread was also very flat last week.
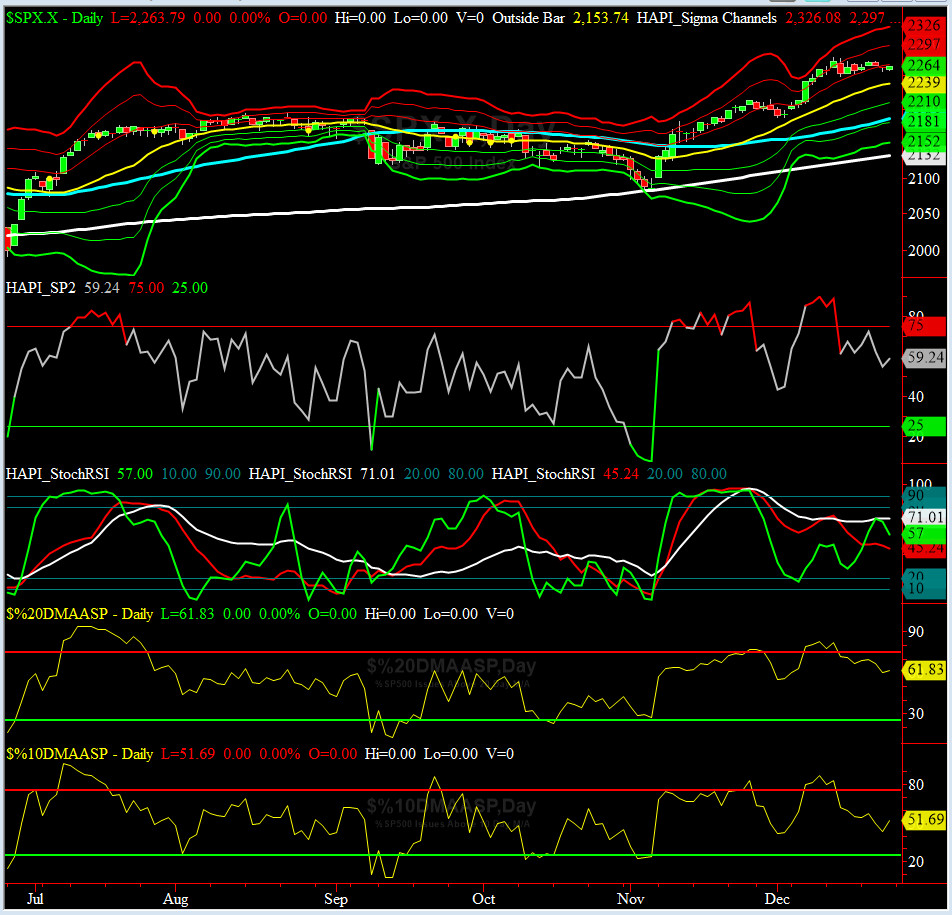
HA_SP2 Chart
HA_SP2 = 59 (Buy signal <= 25, Sell Signal >= 75)
SP2 also changed very little last week.

US Treasury T-Notes & T-Bonds Yields Chart
The YTMs on Treasury Complex hardly changed last week.
Fari Hamzei
|


 Proactive Market Timing


