|
Sunday, February 12, 2017, 1600ET
Market Timing Charts, Analysis & Commentary for Issue #180
Timer Charts of S&P-500 Cash Index (SPX) + NASDAQ-100 Cash Index (NDX)
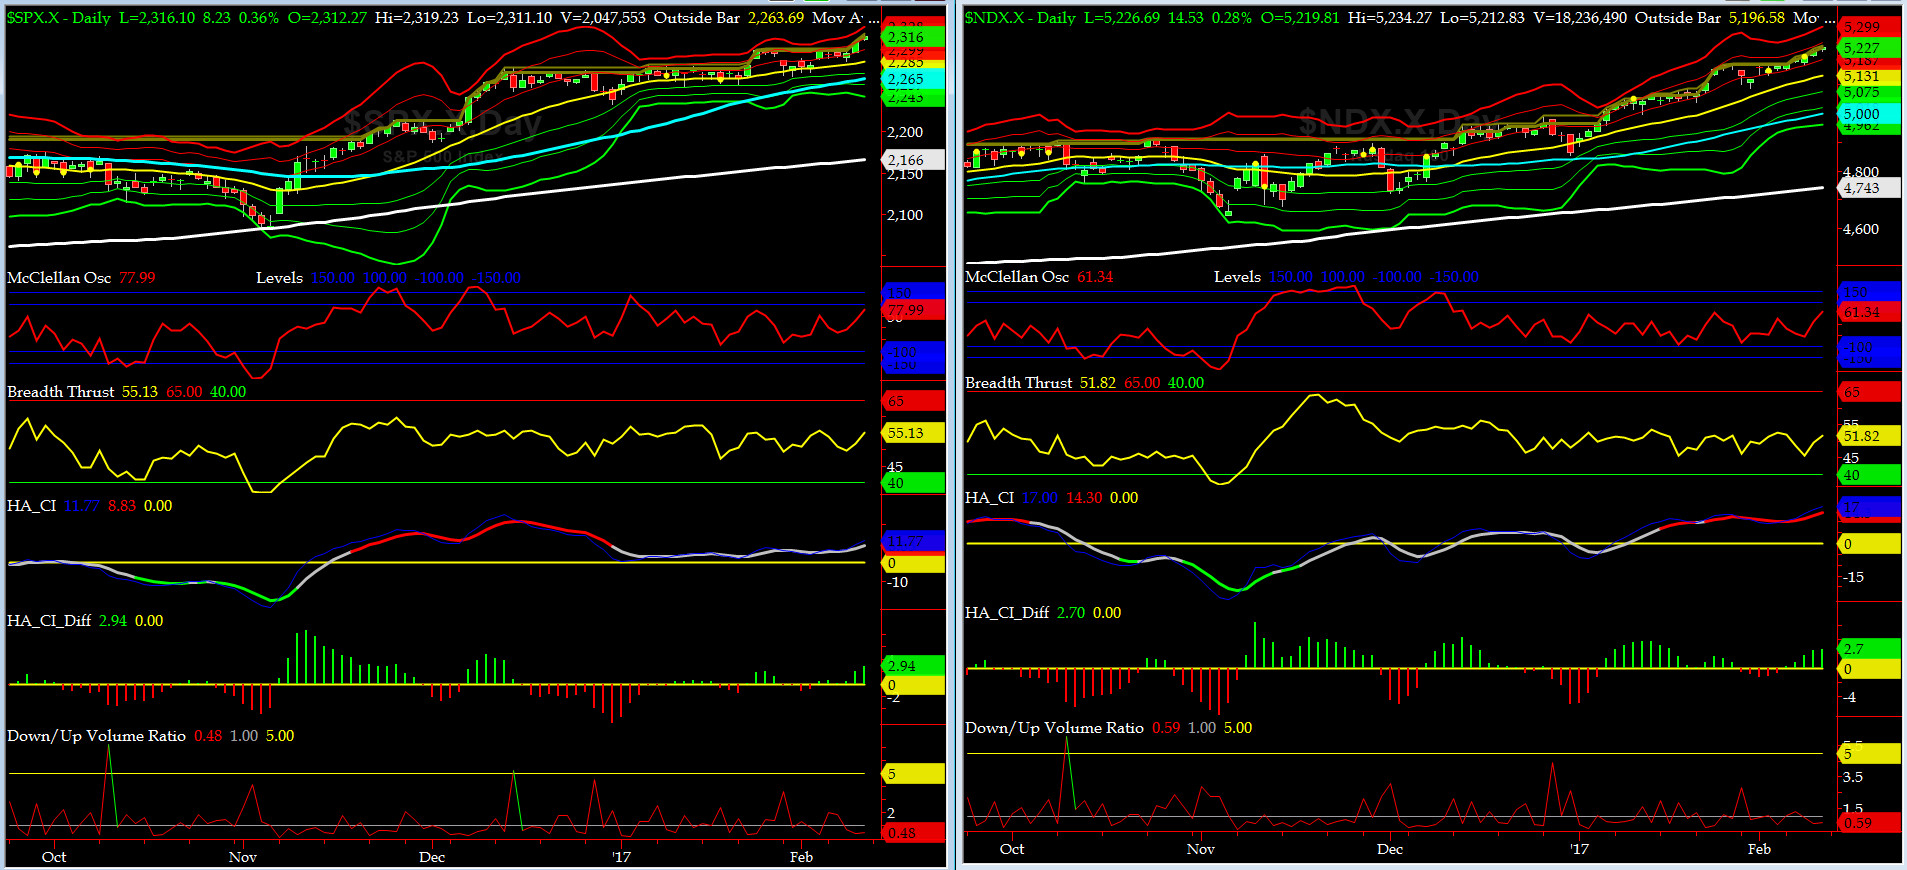
Most recent S&P-500 Cash Index (SPX): 2316.10 up +18.68 (up +0.8%) for the week ending Friday, February 10th, 2017, closed near its +2 sigma.
SPX ALL TIME INTRADAY HIGH = 2319.23 (reached on Friday, February 10, 2017)
SPX ALL TIME CLOSING HIGH = 2316.10 (reached on Friday, February 10, 2017)
Current DAILY +2 Sigma SPX = 2314 with WEEKLY +2 Sigma = 2348
Current DAILY 0 Sigma (20 day MA) SPX = 2285 with WEEKLY 0 Sigma = 2216
Current DAILY -2 Sigma SPX = 2257 with WEEKLY -2 Sigma = 2083
NYSE McClellan Oscillator = +78 (-150 is start of the O/S area; around -275 to -300 area or lower, we go into the �launch-pad� mode, over +150, we are in O/B area)
NYSE Breadth Thrust = 55 (40 is considered as oversold and 65 as overbought)
On Wednesday, Grumpie said I will have a new tax proposal next week, and Markets said BUY BUY BUY..... the rest is history. Only in AMERICA.
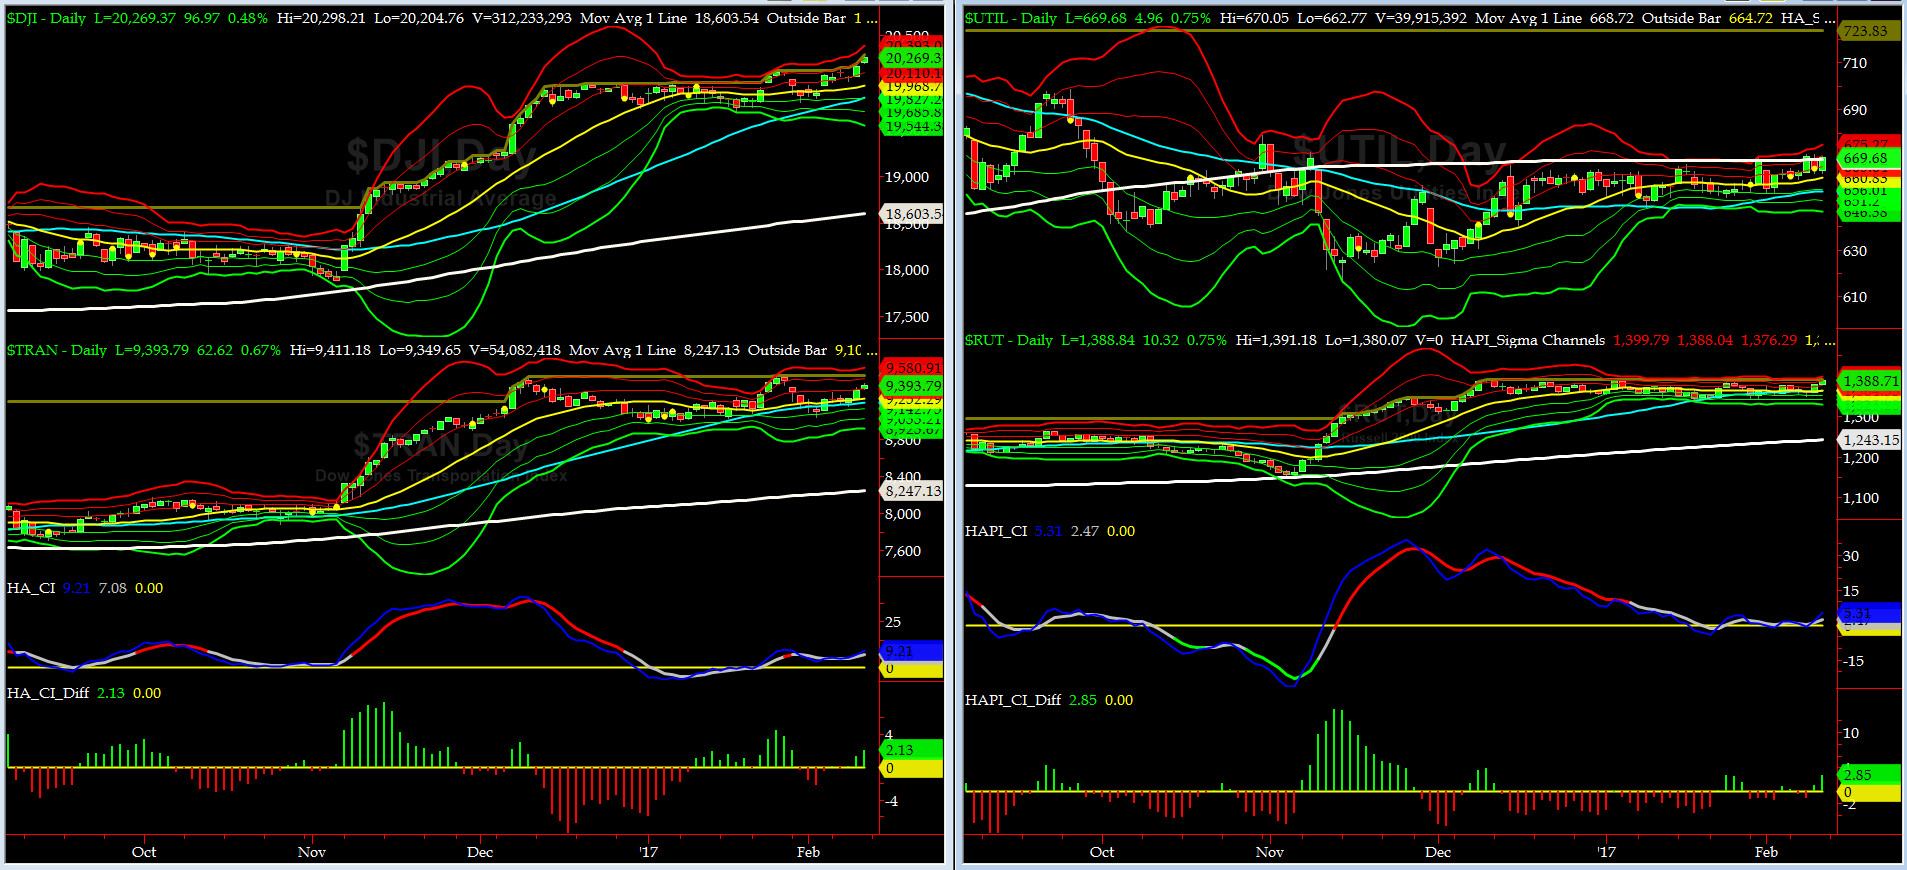
Canaries [in the Coal Mine] Chart for DJ TRAN & RUT Indices
200-Day MA DJ TRAN = 8247 or 13.9% below DJ TRAN (max observed in last 5 yrs = 20.2%, min = -20.3%)
200-Day MA RUT = 1243 or 11.7% below RUT (max observed in last 5 yrs = 21.3%, min = -22.6%)
DJ Transports (proxy for economic conditions 6 to 9 months hence) bounced one more off of its 50-bar MA (4th time during this rally since the general election).
Russell 2000 small caps (proxy for Risk ON/OFF) rallied very strongly on Thursday & Friday to another near ATH. RISK remains HOT RED.
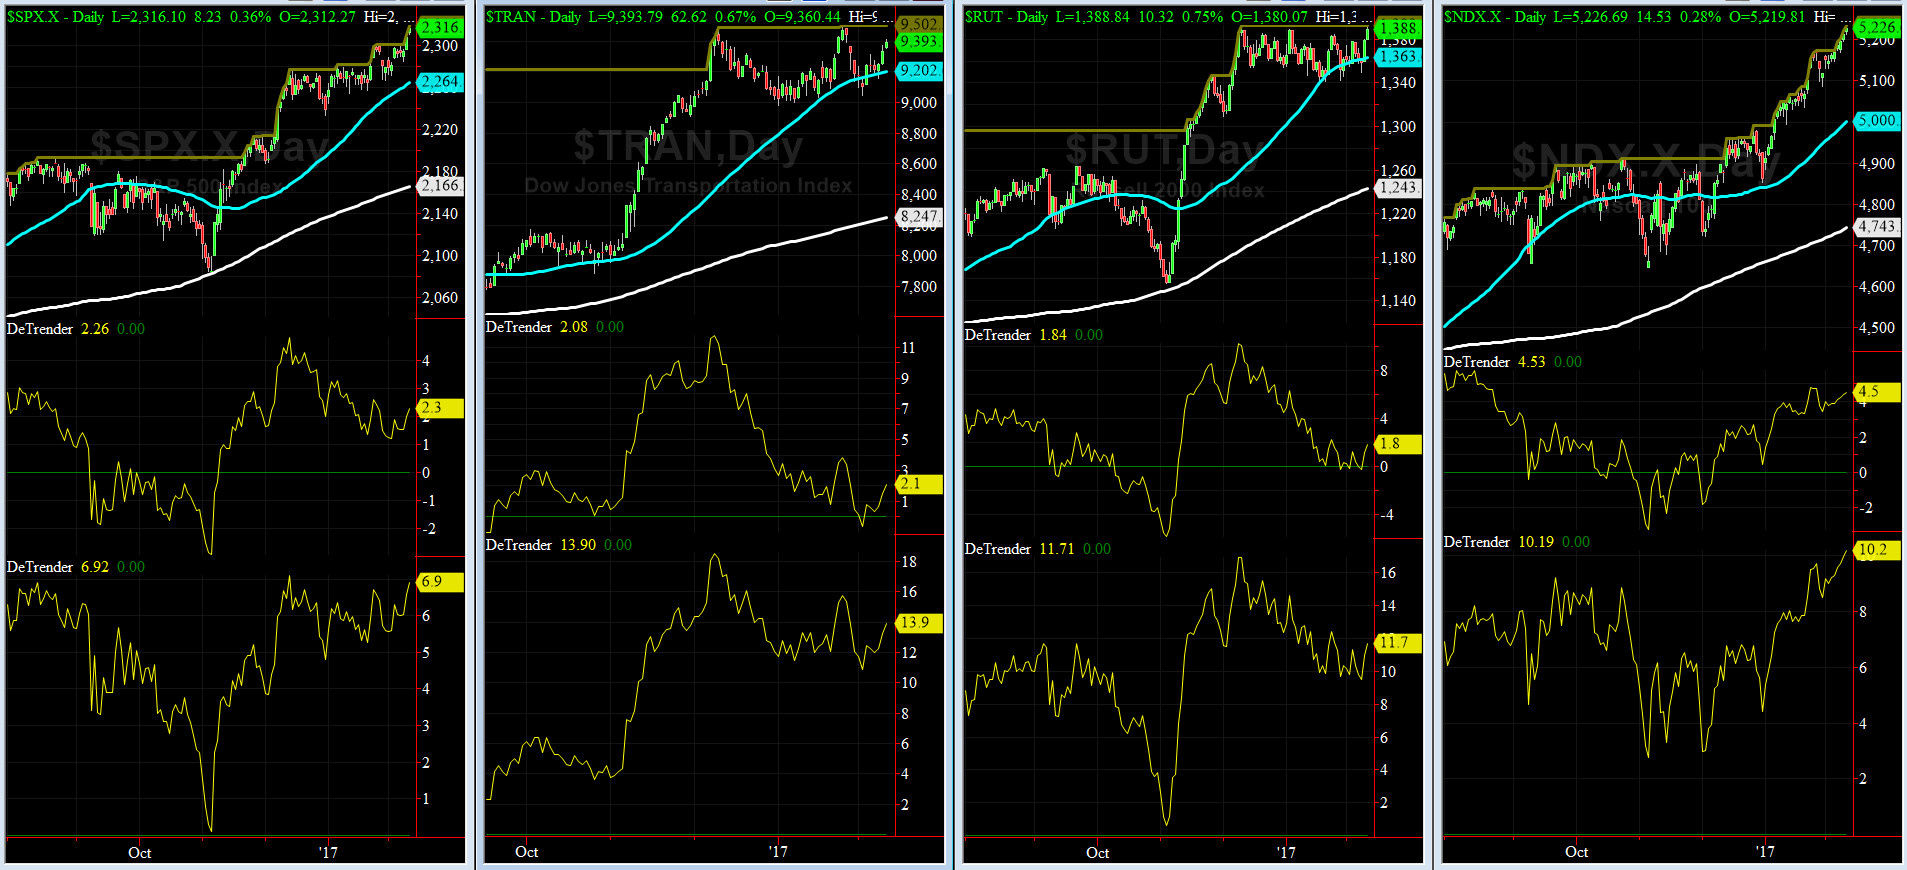
DeTrenders Charts for SPX, NDX, TRAN & RUT Indices
50-Day MA SPX = 2264 or 2.3% below SPX closed on Friday (max observed in last 5 yrs = +8.6%, min = -9.3%)
200-Day MA SPX = 2166 or 6.9% below SPX (max observed in last 5 yrs = 15.2%, min = -14%)
All of our eight De Trenders remain positive again. The De Trenders for DJ Tran & RUT will continue to be harbingers of future price behavior in broad indices.
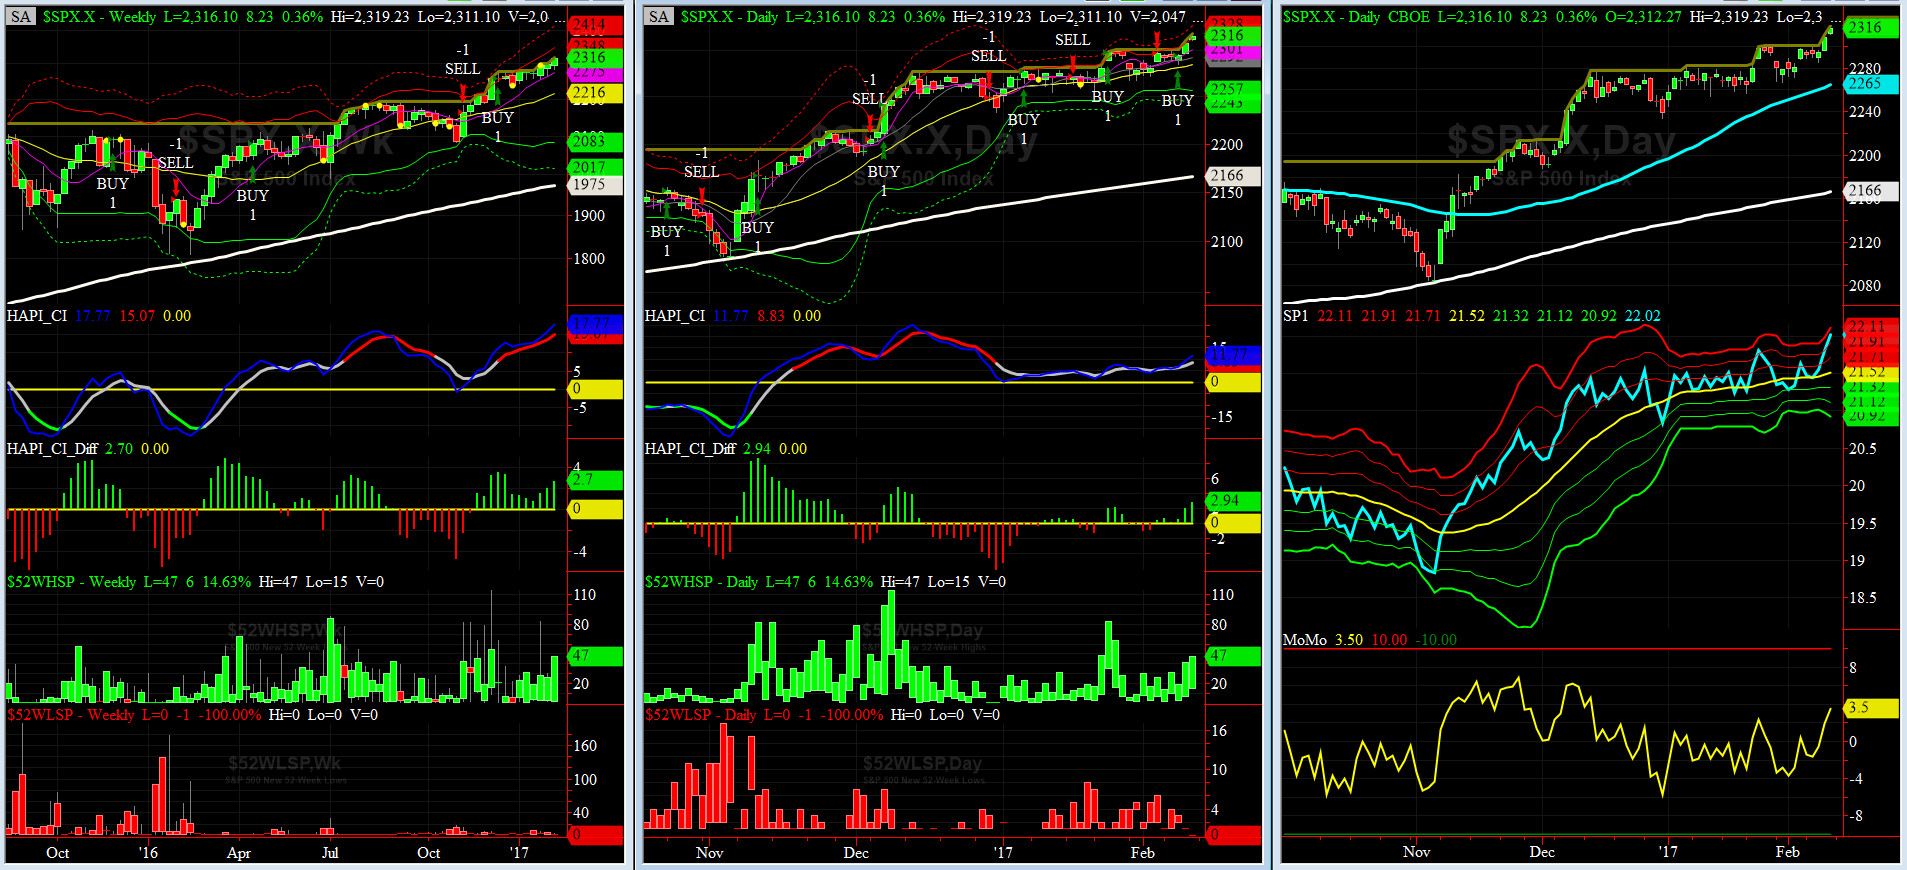
HA_SP1_Momo Chart
WEEKLY Timing Model = on a BUY Signal since Friday 12/16/16 CLOSE at 2258
DAILY Timing Model = on a BUY Signal since Wednesday 2/8/17 CLOSE at 2295
Max SPX 52wk-highs reading last week = 30 (over 120-140, the local maxima is in)
Max SPX 52wk-Lows reading last week = 6 (over 40-60, the local minima is in)
HA_SP1 at just above its +2.5 sigma channels
HA_Momo = +3.4 (reversals most likely occur above +10 or below -10)
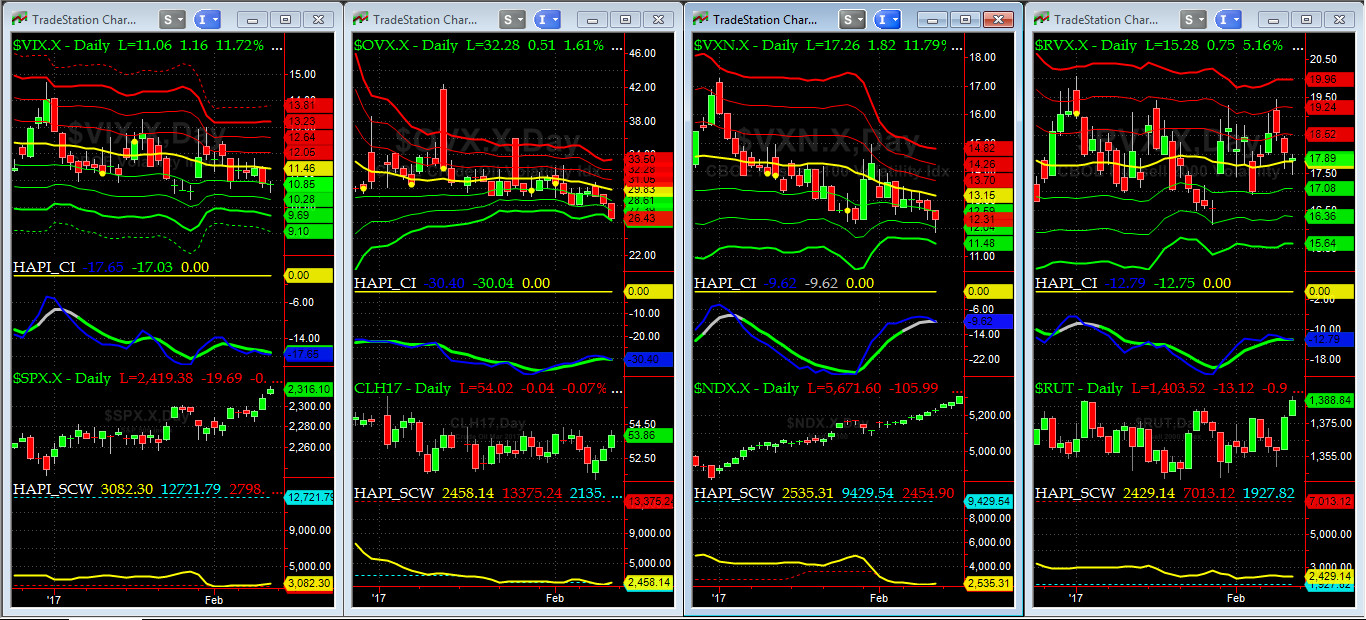
Vol of the Vols Chart
VIX is currently at its -1 sigma level at 10.85 (remember it�s the VIX�s vol pattern (its sigma channels) that matters, and not the level of VIX itself (this is per Dr. Robert Whaley, a great mentor and the inventor of original VIX, now called VXO). VIX usually peaks around a test of its +4 sigma).
The VOL Complex again moved LOWER this past week.
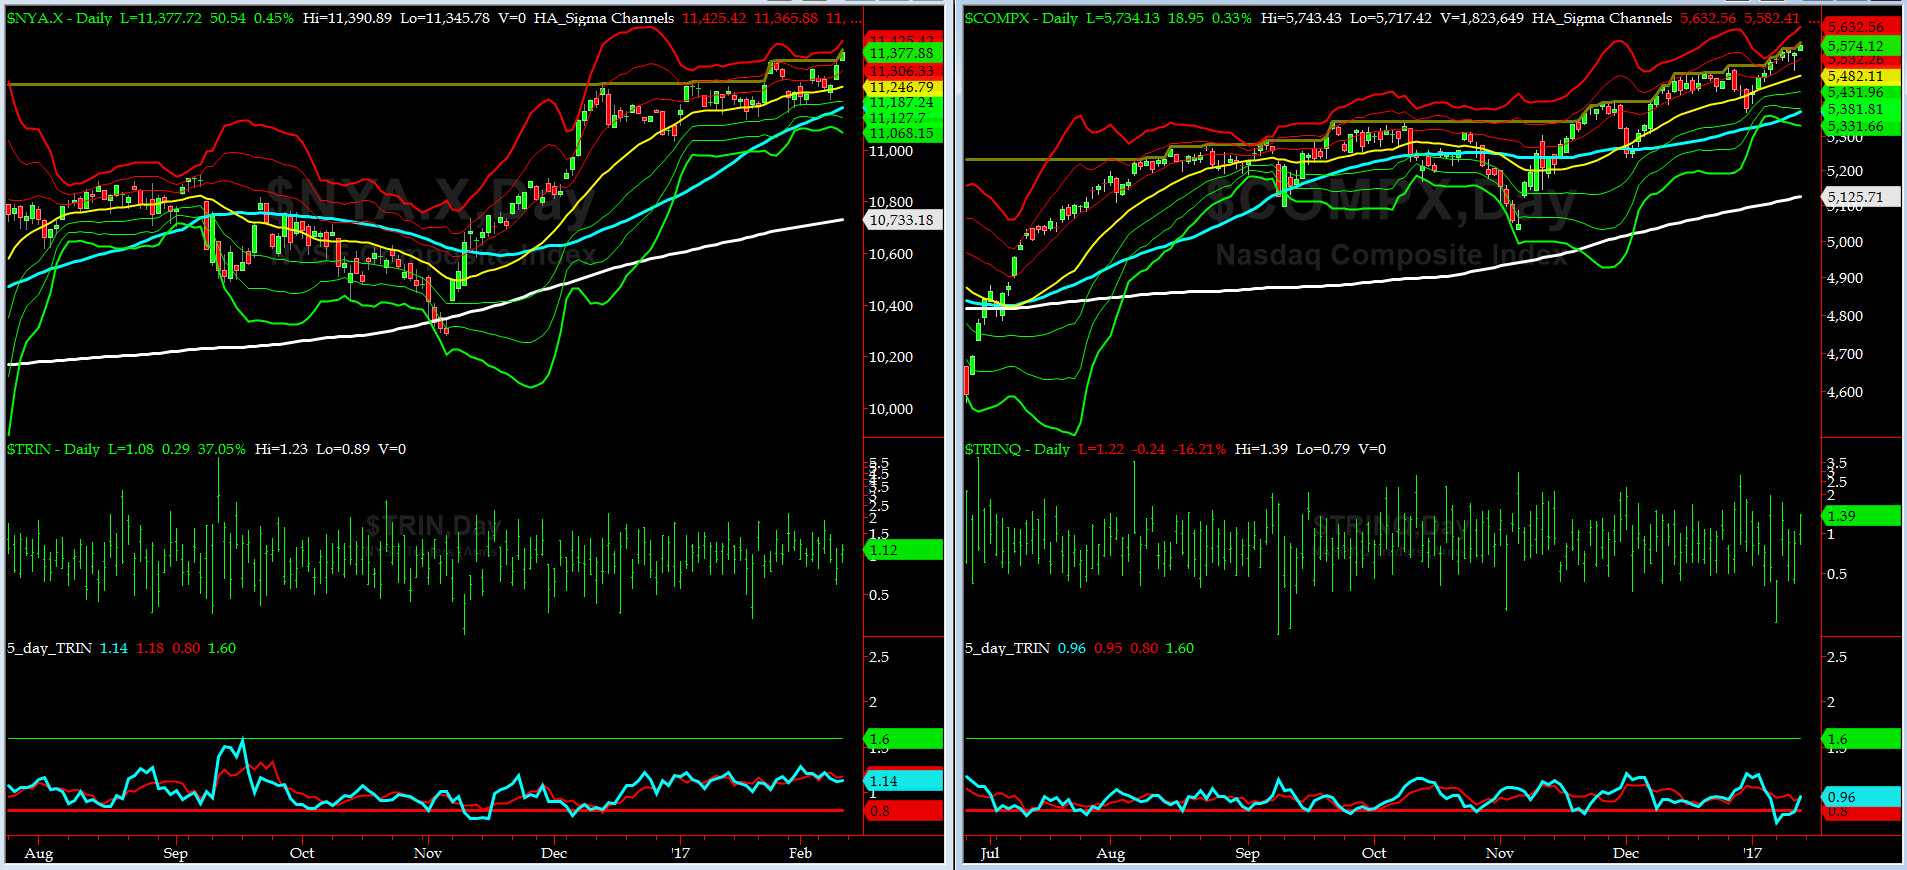
5-day TRIN & TRINQ Charts
Both NYSE & NASDAQ 5-day TRINs are again NEUTRAL for now. No Signal here.

Components of SPX above their respective 200day MA Chart
This discussed here last week, this scoring indicator rose to ~76% (our target posted in last issue wsa "Target: 75%-77%"). Targeting info is courtesy of HRH @Capt_Tiko, KBE. Bravo Tiko.
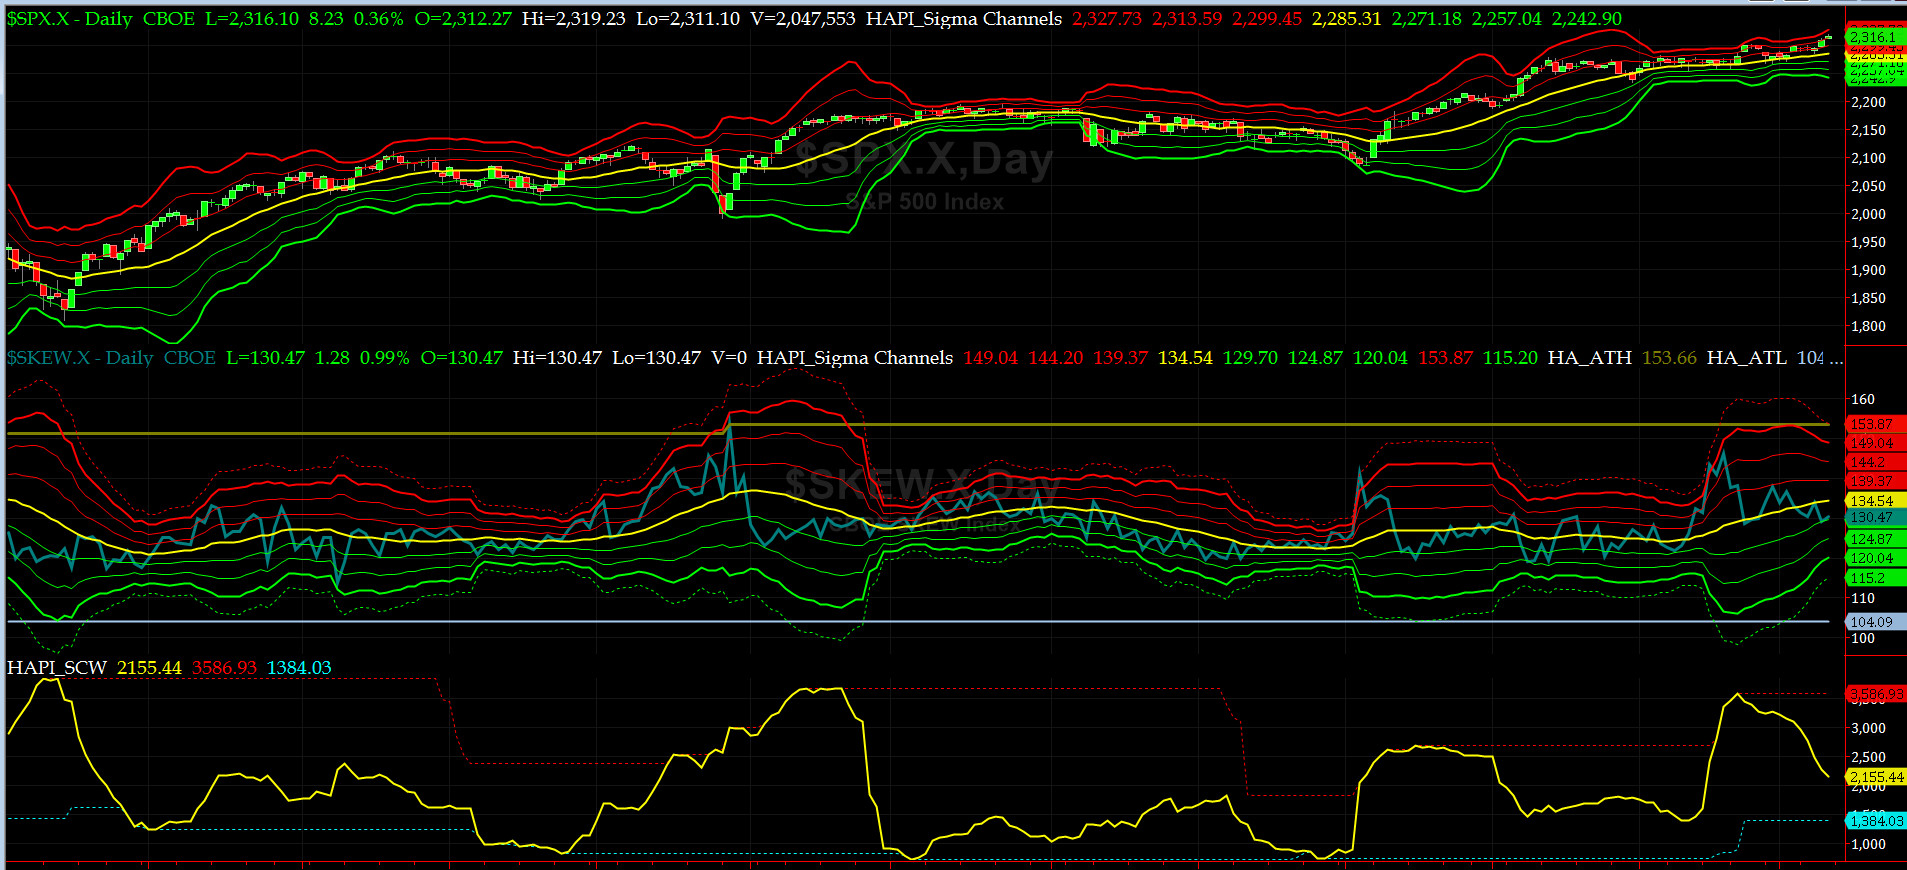
SPX SKEW (Tail Risk) Chart
Last week SPX SKEW (Tail Risk) moved lower and ended just above its -1 sigma at 130. (normal = 120-125, range 100-150).
All is [relatively] quiet again on the Eastern & Mid-Western Fronts....
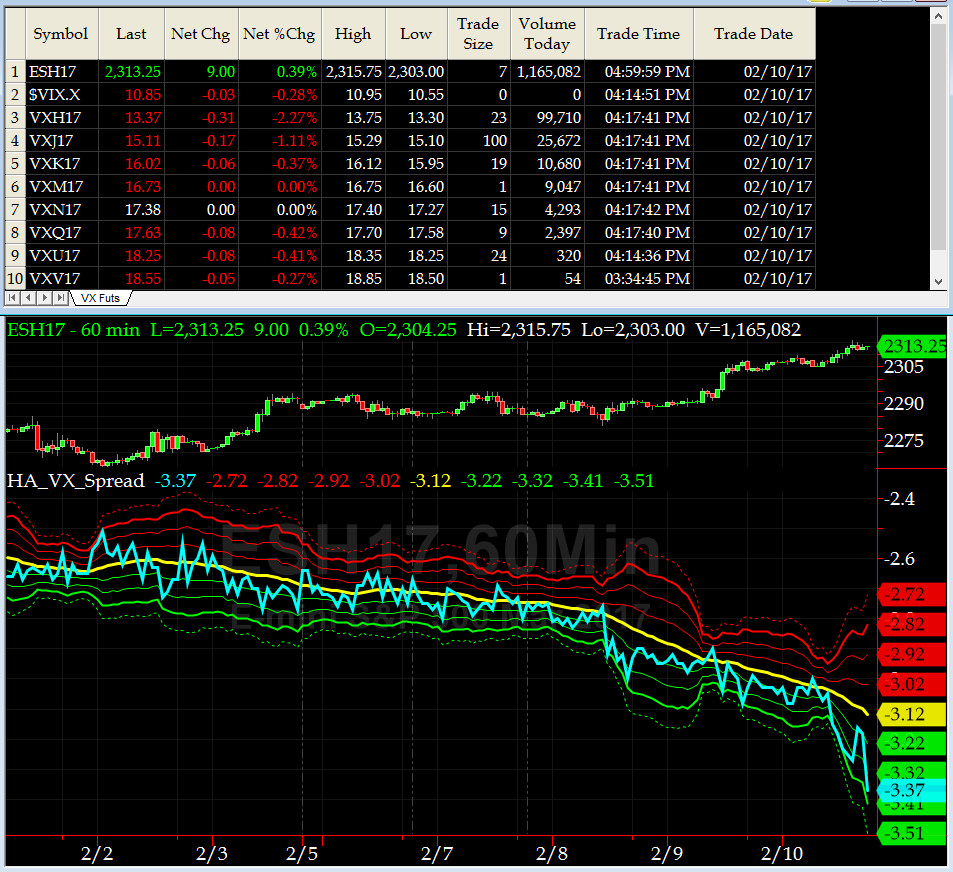
3-month VIX Futures Spread(VX) Chart
Next Wednesday is FEB VIX expiration so, per our standard protocol for this indicator, on Friday, we rolled forward our VX Spread. Our new 3-month VIX Futures Spread (LONG MAR & SHORT JUN) dropped further and closed at -3.37 near its -3 sigma on Friday. We are nearing OVERBOUGHT HERE.
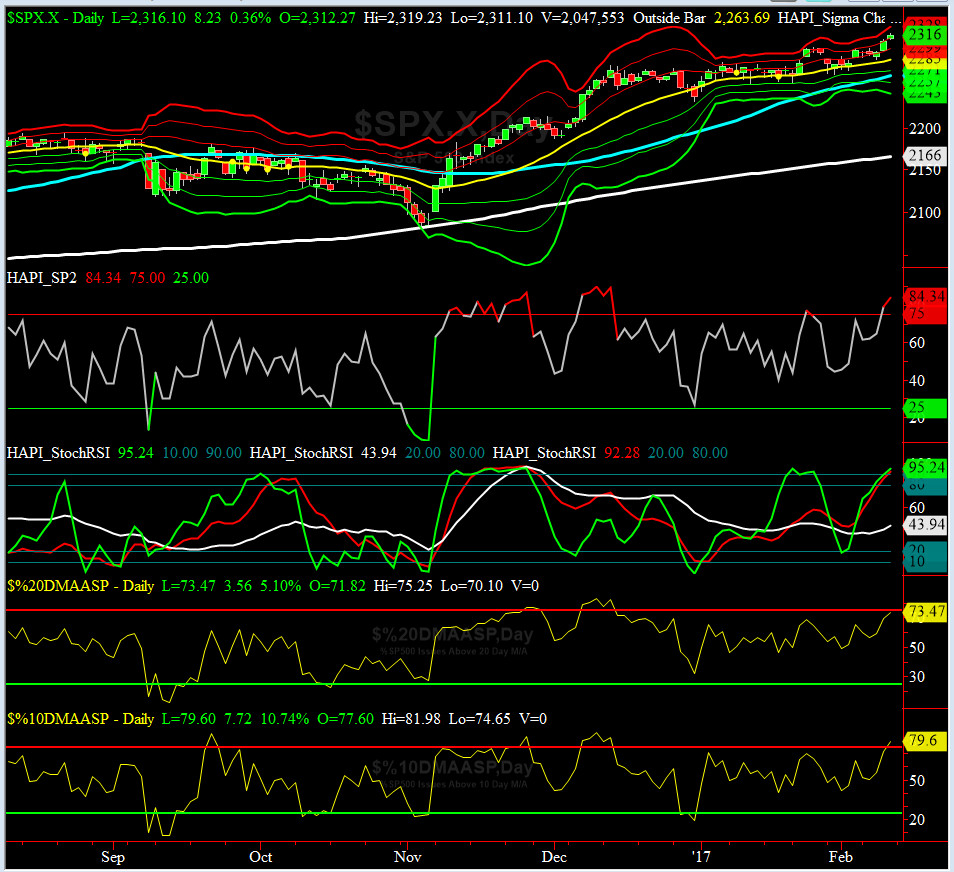
HA_SP2 Chart
HA_SP2 = 84.4 (Buy signal <= 25, Sell Signal >= 75)
SP2 is now in OVERBOUGHT zone, thanks to Grumpie LLC. That's part of the reason we went flat before the Close on Friday.
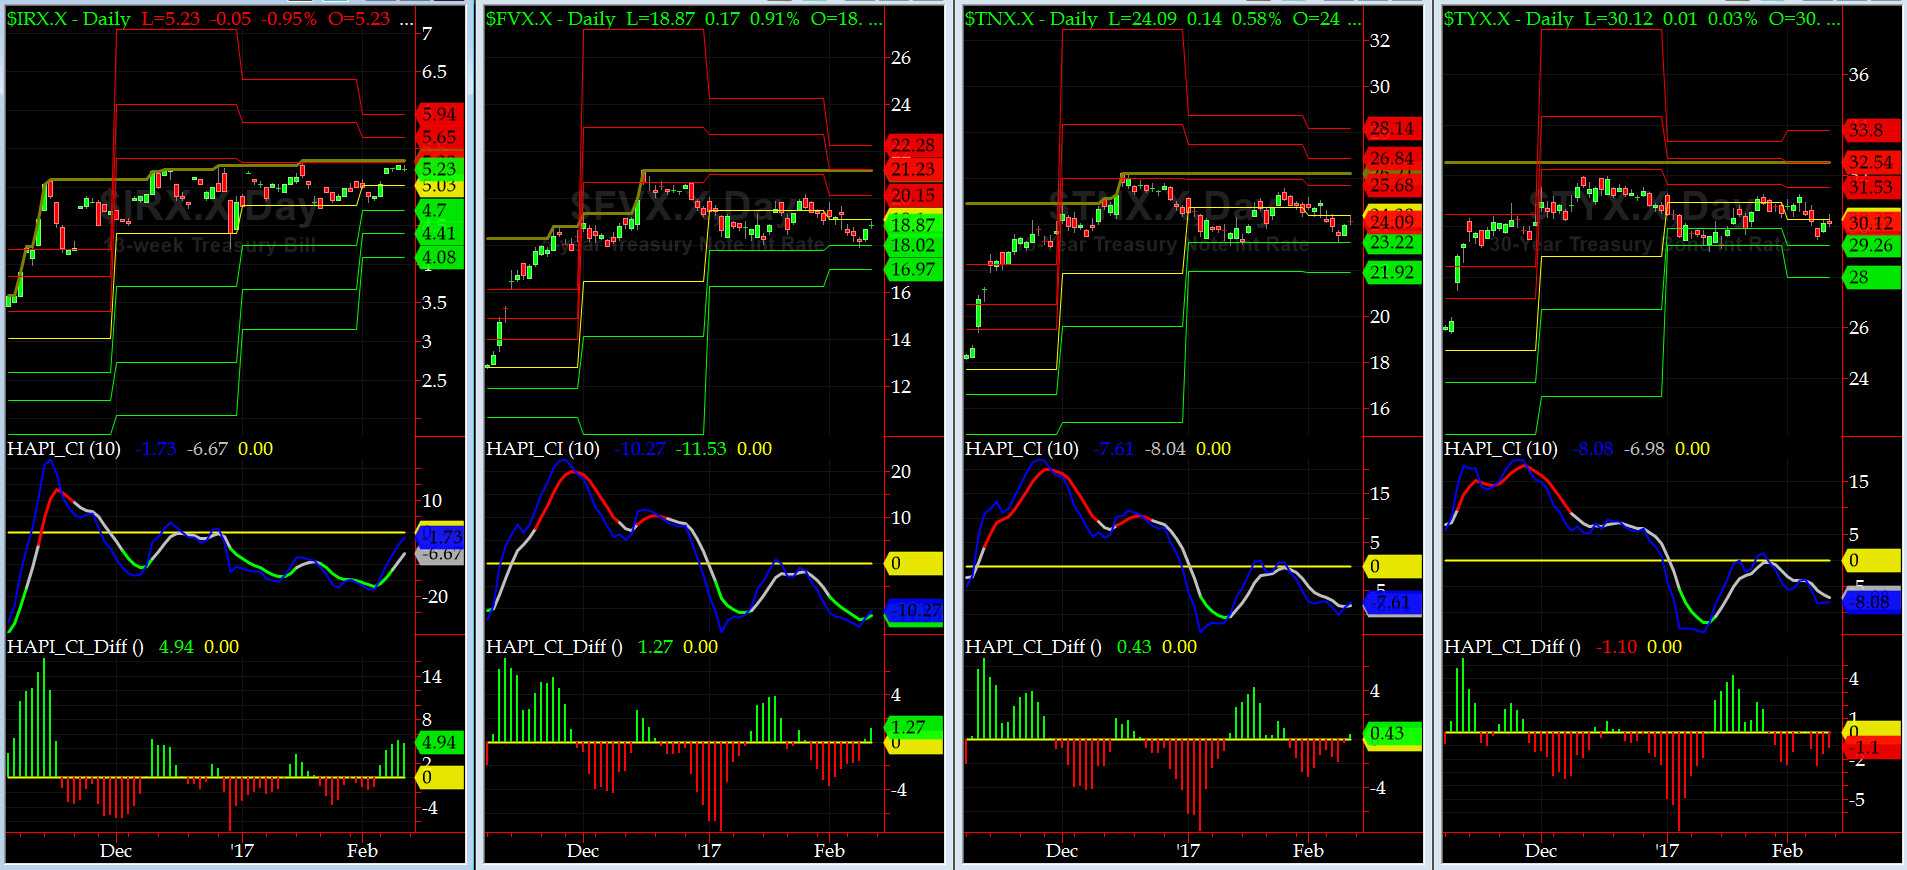
US Treasury T-Notes & T-Bonds Yields Chart
The front-end EBY rose above its monthly pivot while longer-dated paper YTMs sank somewhat and settled near their respective monthly pivots.
HRH @Capt_Tiko had NE at neg 3. He won big time, thanks to Tom Brady and he's been happy as a clam ever since. Only in AMERICA.
Fari Hamzei
|


 Proactive Market Timing


