|
Sunday, March 5, 2017, 1400ET
Market Timing Charts, Analysis & Commentary for Issue #183
Timer Charts of S&P-500 Cash Index (SPX) + NASDAQ-100 Cash Index (NDX)
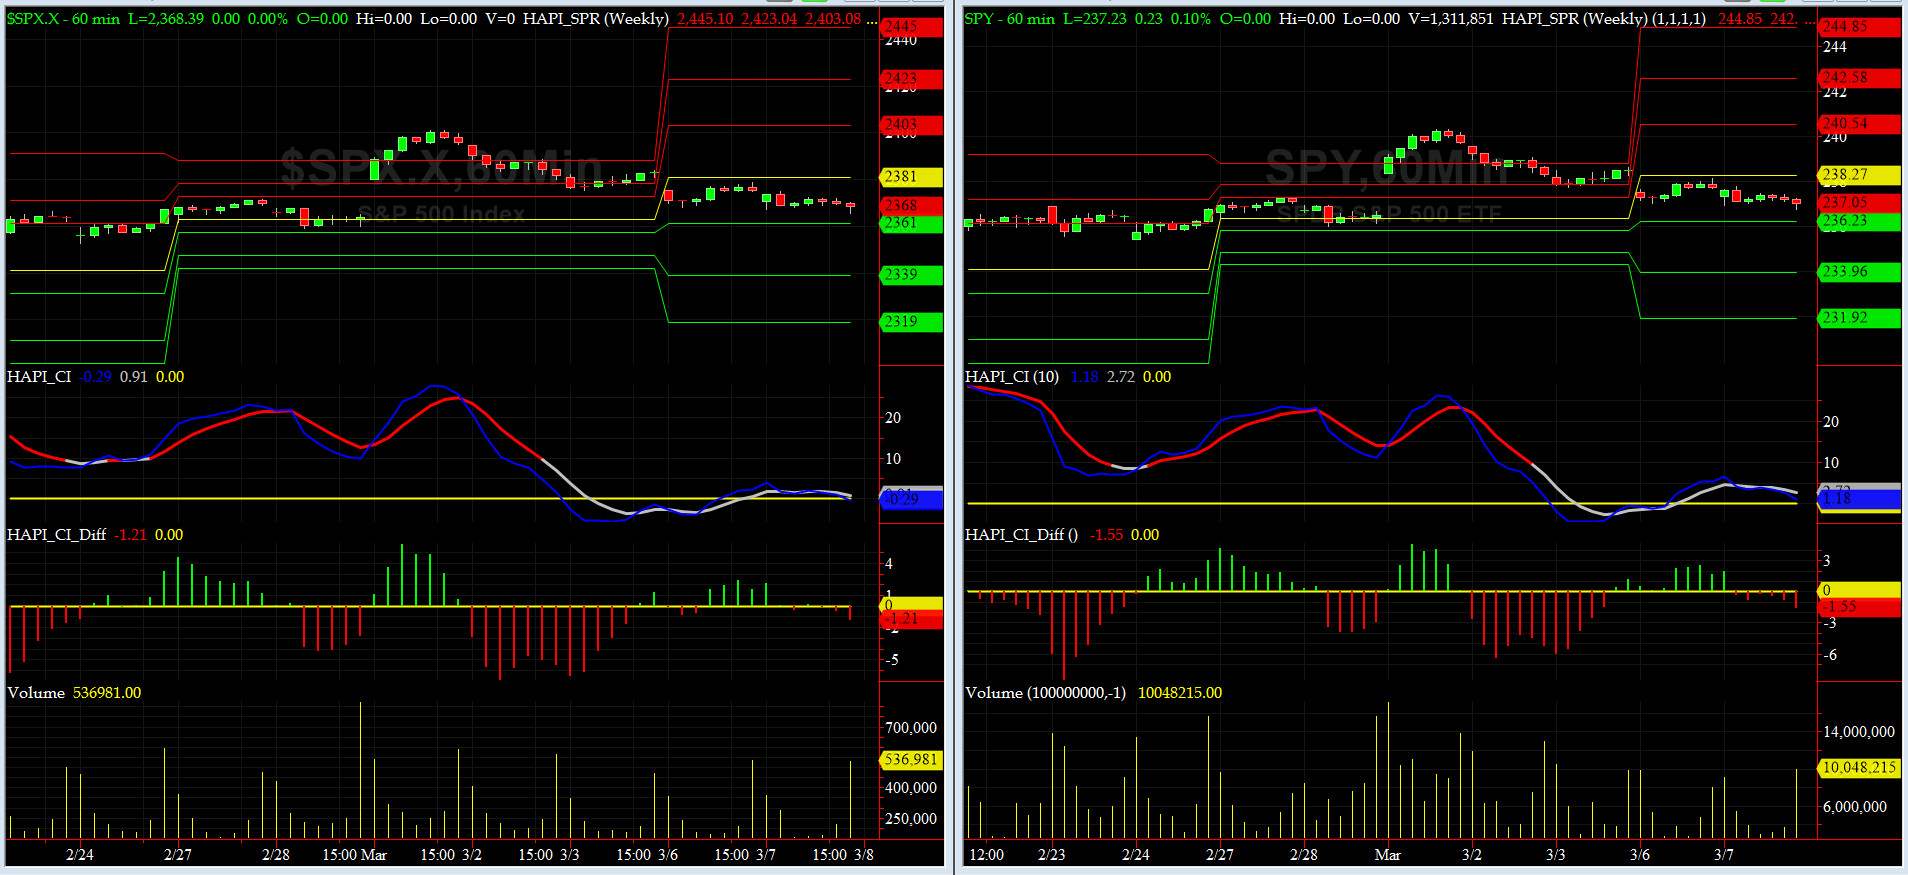
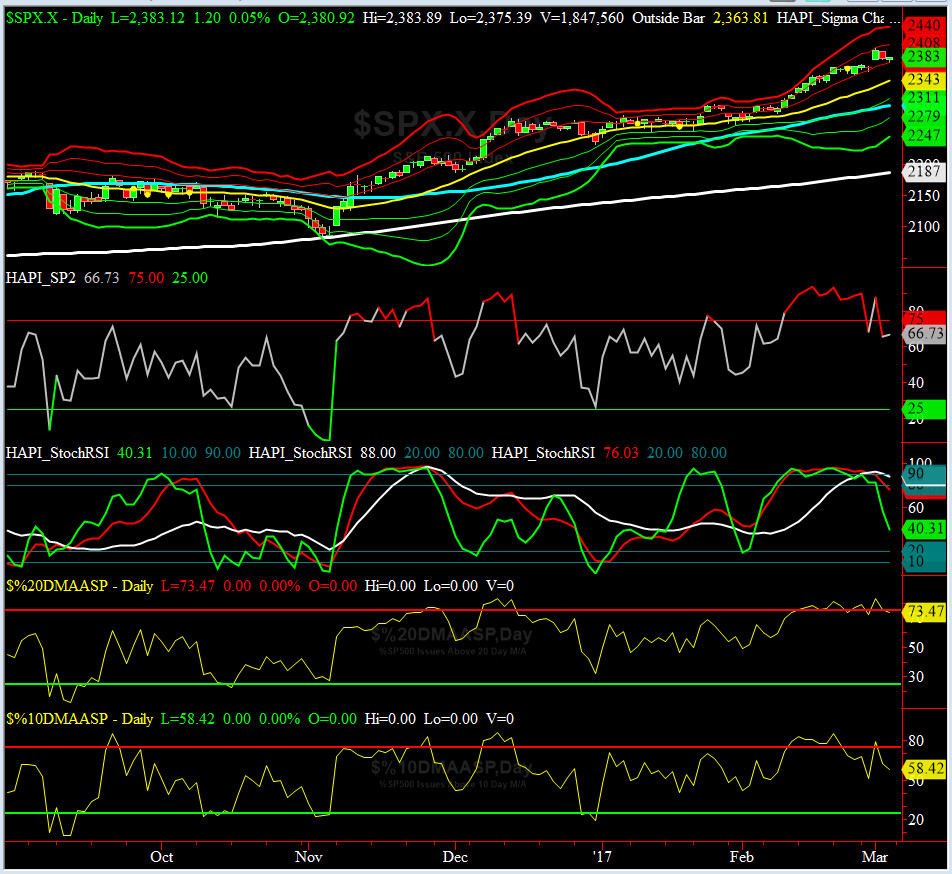
Most recent S&P-500 Cash Index (SPX): 2383.12 up +15.78 (up +0.67%) for the week ending Friday, March 3rd, 2017, which closed near its +1 sigma.
SPX ALL TIME INTRADAY HIGH = 2400.98 (reached on Wednesday, March 1, 2017)
SPX ALL TIME CLOSING HIGH = 2395.96 (reached on Wednesday, March 1, 2017)
Current DAILY +2 Sigma SPX = 2408 with WEEKLY +2 Sigma = 2405
Current DAILY 0 Sigma (20 day MA) SPX = 2343 with WEEKLY 0 Sigma = 2235
Current DAILY -2 Sigma SPX = 2279 with WEEKLY -2 Sigma = 2091
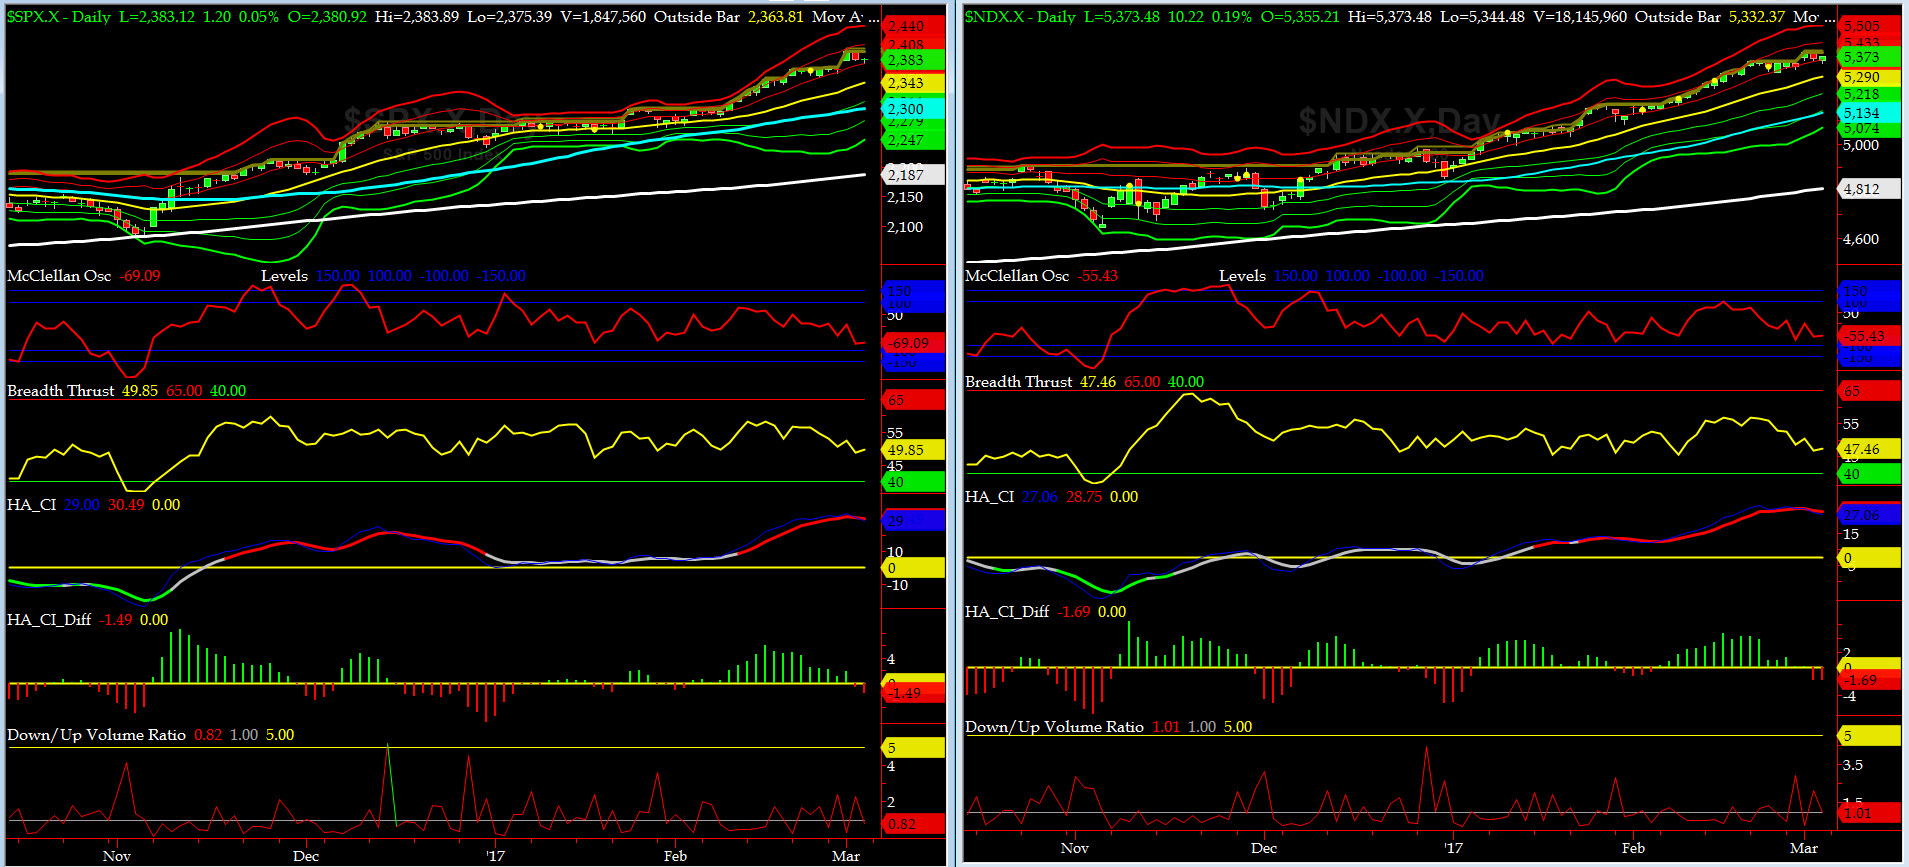
NYSE McClellan Oscillator = -69 (-150 is start of the O/S area; around -275 to -300 area or lower, we go into the �launch-pad� mode, over +150, we are in O/B area)
NYSE Breadth Thrust = 49.85 (40 is considered as oversold and 65 as overbought)
Grumpie is now passed the FULL (of hot gas) mark and our markets still can't figure him out. Still seeing no catalyst in sight for a major pullback while we remain uber overbought. A small pullback will be bought. That's a given. So, for now, just locate the Ejection Seat Handle, but keep its SAFETY PIN IN for now. We will issue you the EJECT COMMAND, sooner than you think, sailors.

Canaries [in the Coal Mine] Chart for DJ TRAN & RUT Indices
200-Day MA DJ TRAN = 8368 or 13.4% below DJ TRAN (max observed in last 5 yrs = 20.2%, min = -20.3%)
200-Day MA RUT = 1262 or 10.4% below RUT (max observed in last 5 yrs = 21.3%, min = -22.6%)
DJ Transports (proxy for economic conditions 6 to 9 months hence) made what we call SAUSAGE on WHEELS. what a week it was for DJ TRAN.
Russell 2000 small caps (proxy for Risk ON/OFF) sold off hard one day and rallied up the next day. Then repeat the pattern. RISK still remains HOT RED.
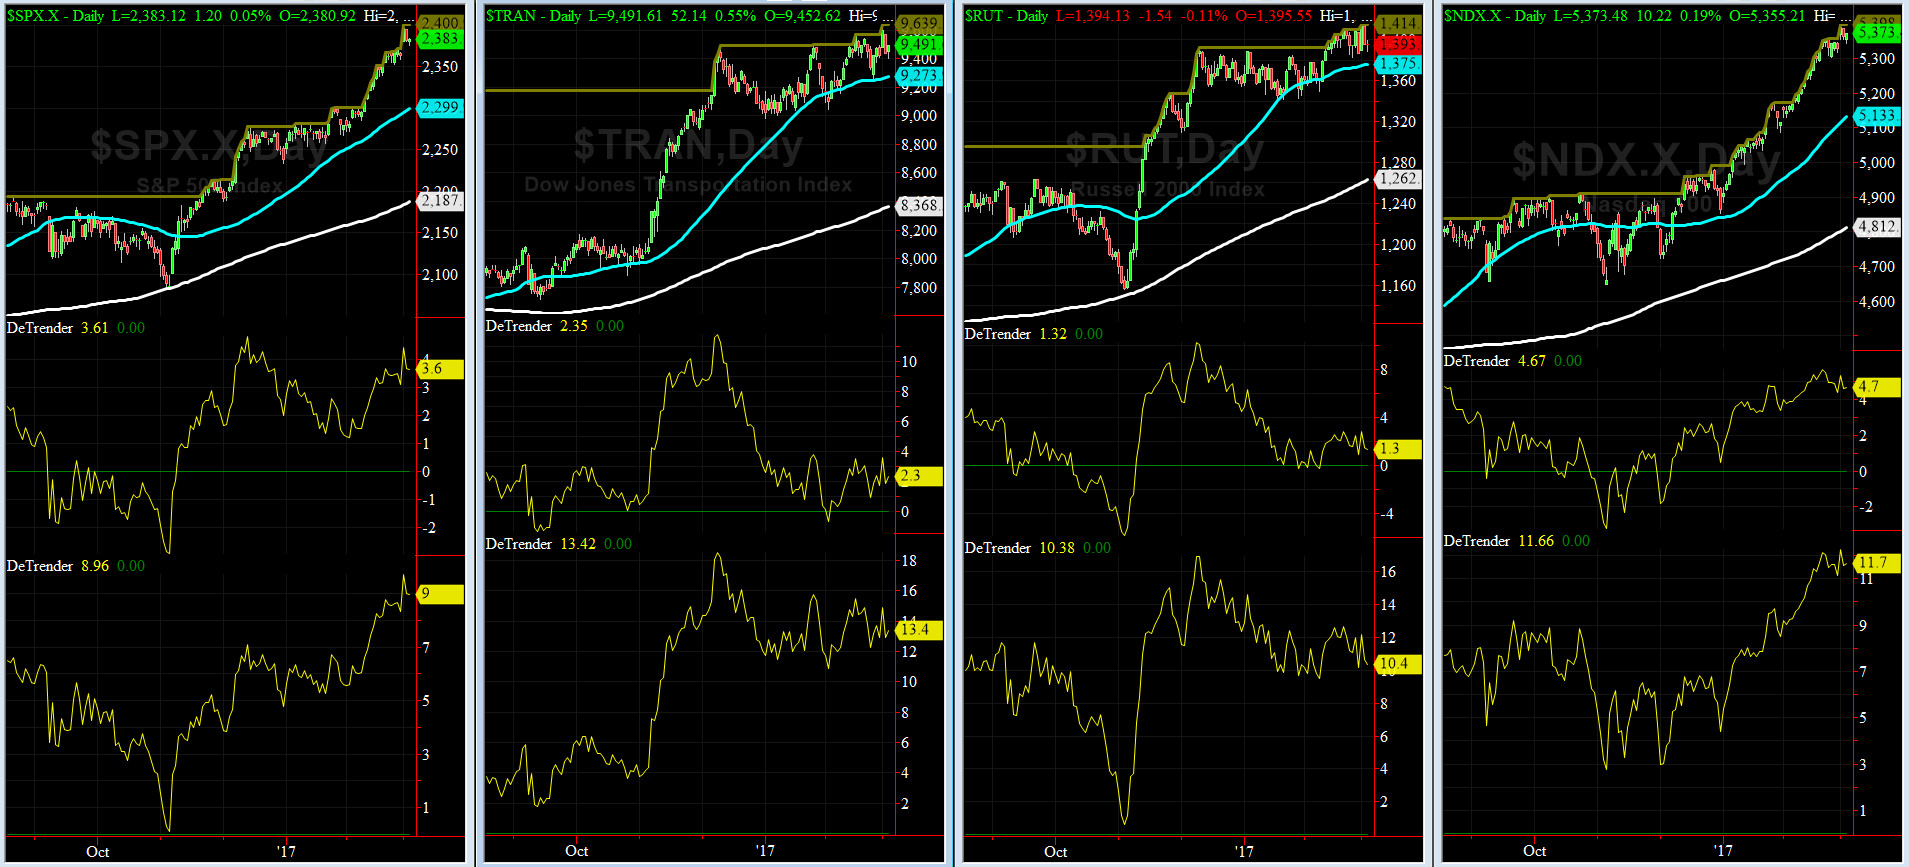
DeTrenders Charts for SPX, NDX, TRAN & RUT Indices
50-Day MA SPX = 2288 or 3.5% below SPX closed on Friday (max observed in last 5 yrs = +8.6%, min = -9.3%)
200-Day MA SPX = 2179 or 8.6% below SPX (max observed in last 5 yrs = 15.2%, min = -14%)
Still all eight of our De Trenders remain positive again. The De Trenders for DJ Tran & RUT will continue to be harbingers of future price behavior in broad indices.
HA_SP1_Momo Chart
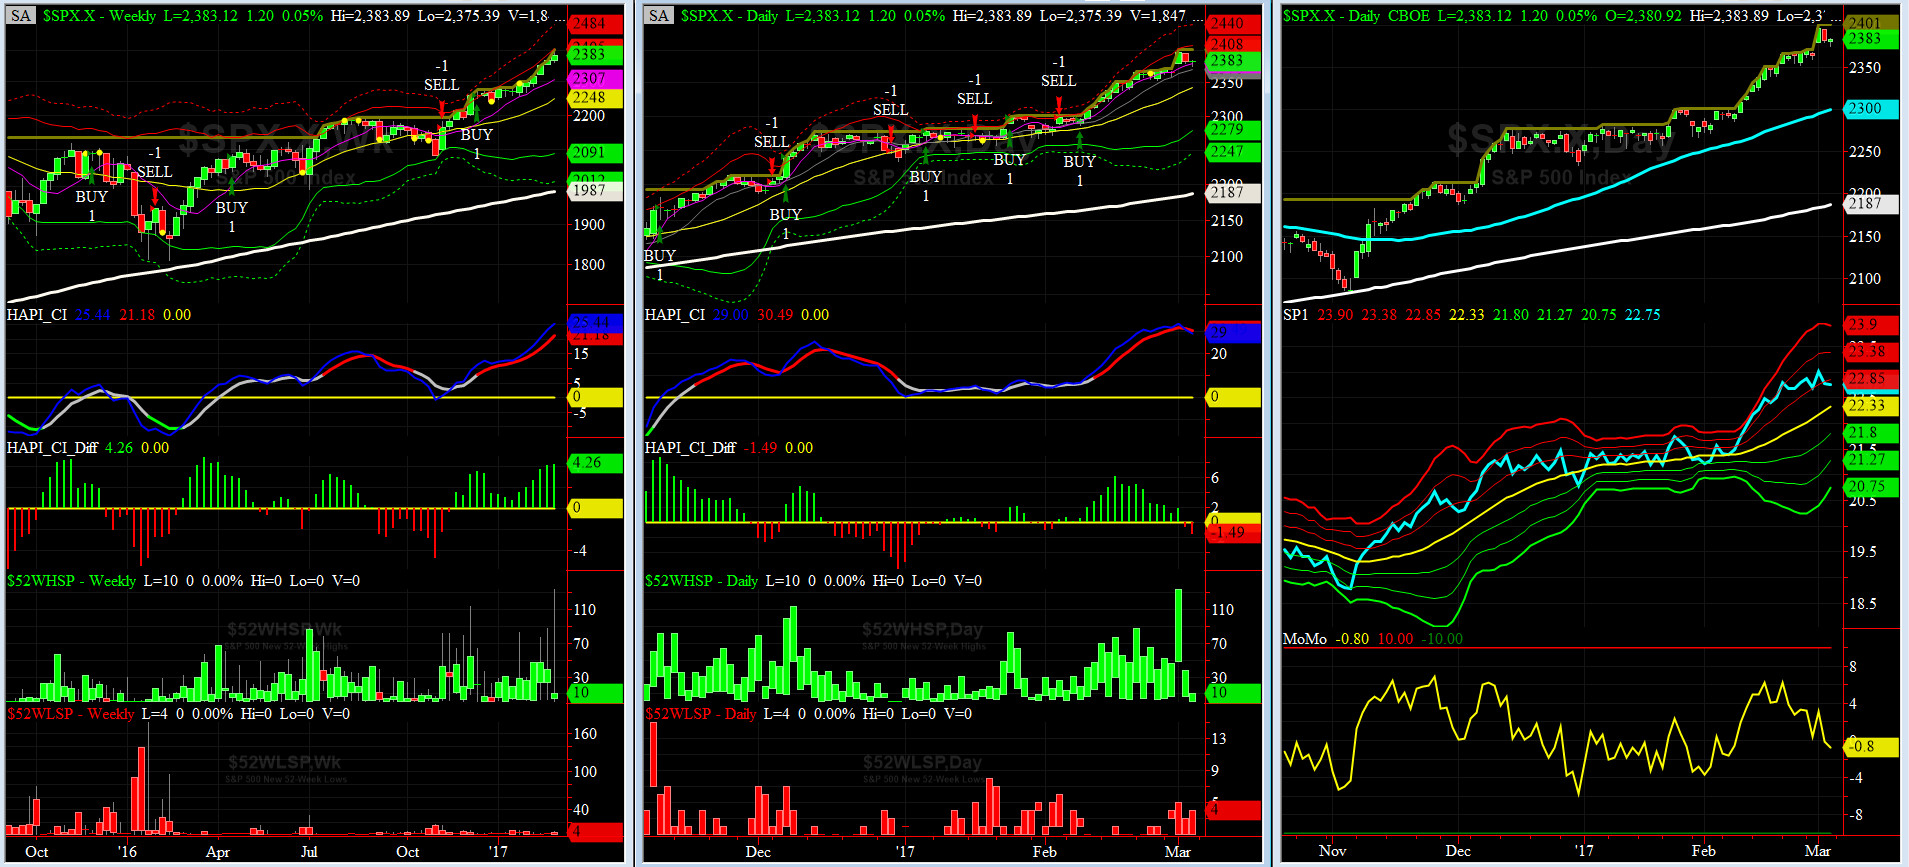
WEEKLY Timing Model = on a BUY Signal since Friday 12/16/16 CLOSE at 2258
DAILY Timing Model = on a BUY Signal since Wednesday 2/8/17 CLOSE at 2295
Max SPX 52wk-highs reading last week = 134 (over 120-140, the local maxima is in)
Max SPX 52wk-Lows reading last week = 5 (over 40-60, the local minima is in)
HA_SP1 at just below its +1 sigma channels
HA_Momo = -0.8 (reversals most likely occur above +10 or below -10)
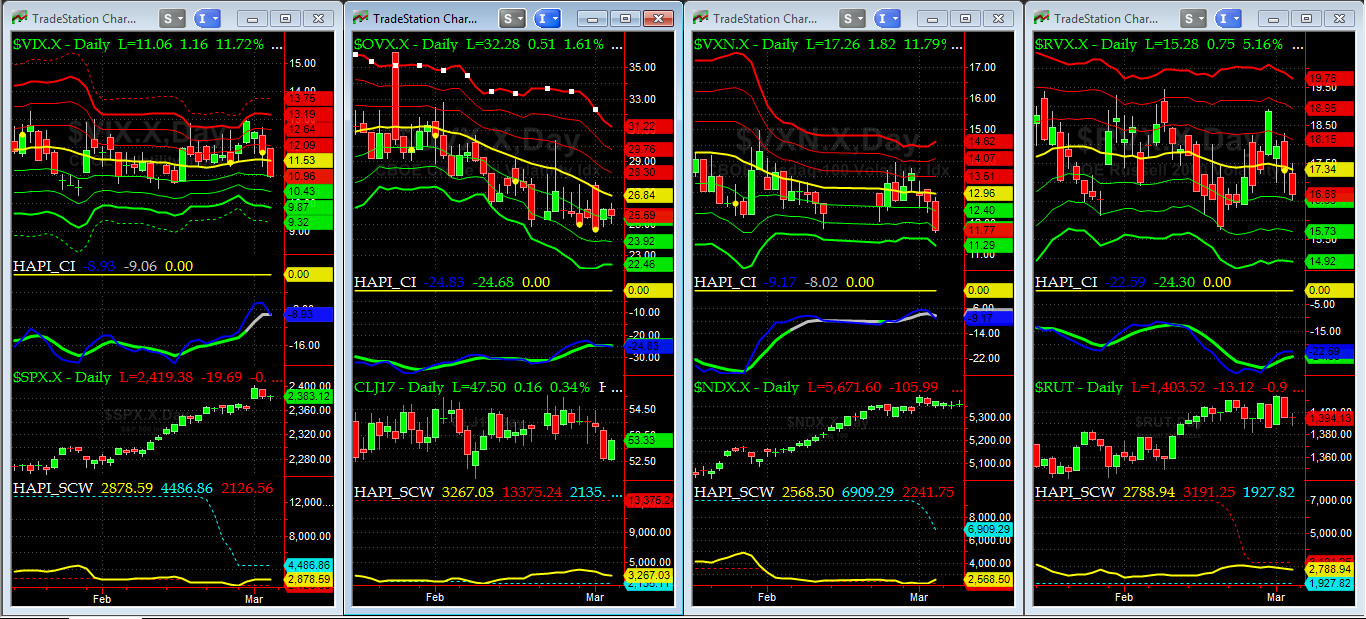
Vol of the Vols Chart
VIX is currently at its -1 sigma level at 10.96 (remember it�s the VIX�s volatility pattern (its sigma channels) that matters, and not the level of VIX itself (this is per Dr. Robert Whaley, a great mentor and the inventor of original VIX, now called VXO). VIX usually peaks around a test of its +4 sigma).
Net net the VOL Complex retreated last week by a tad.
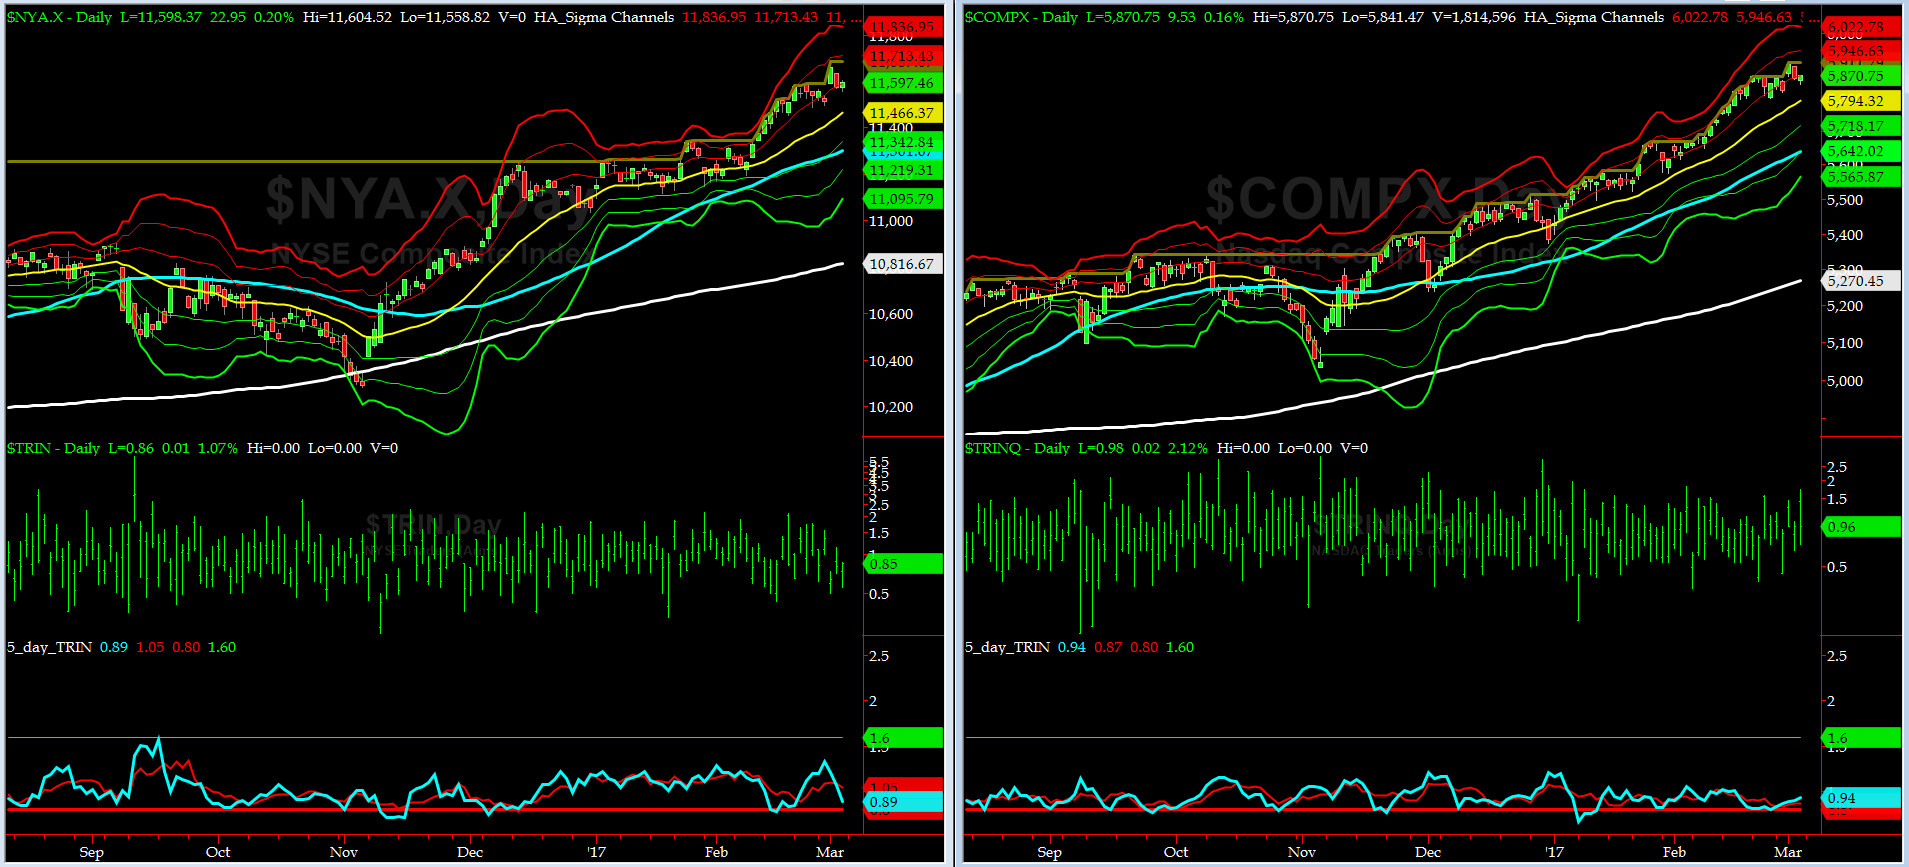
5-day TRIN & TRINQ Charts
NYSE 5-day TRIN is on a SELL now while NASDAQ 5-day TRIN is on NEUTRAL signal. Stay tuned sailors....
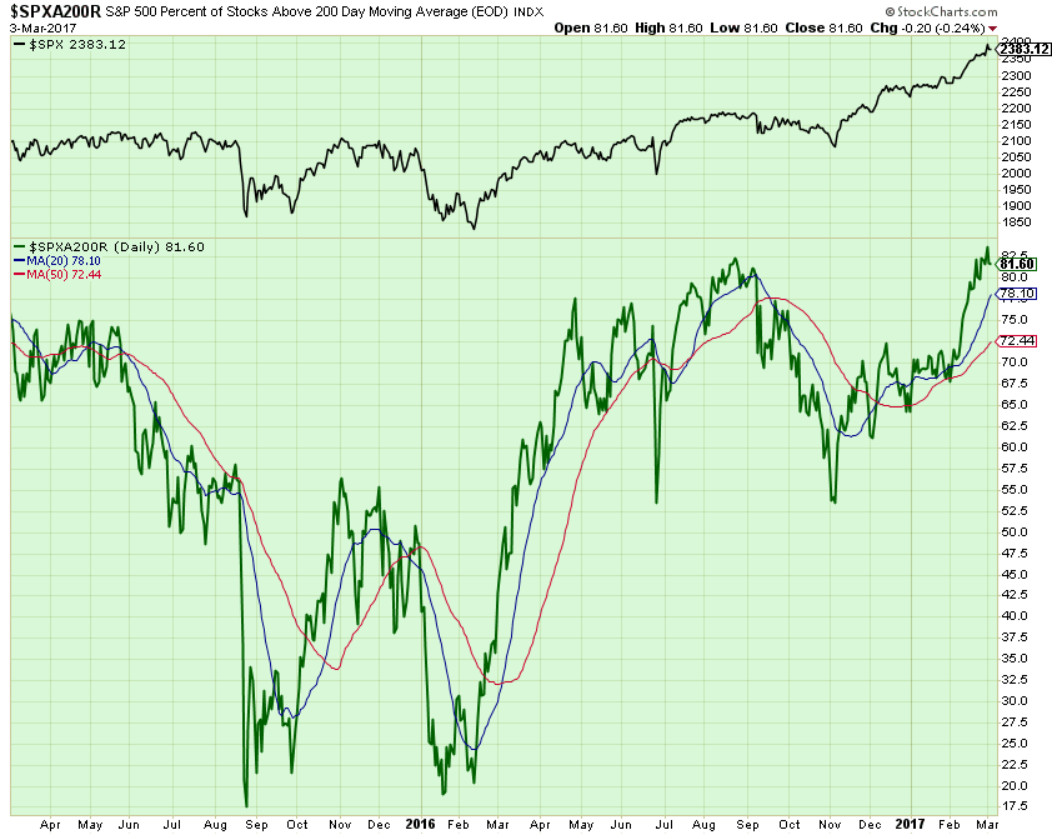
Components of SPX above their respective 200day MA Chart
Last Wednesday this scoring indicator rose to 83.6%... now comes the waiting game of seeing it diverge with SPX soon. Stock up on iced tea, my Executive Officer(XO), @Capt_Tiko says. He knows too well. One time it took us 6 divergences before everything fell apart. OUCH.
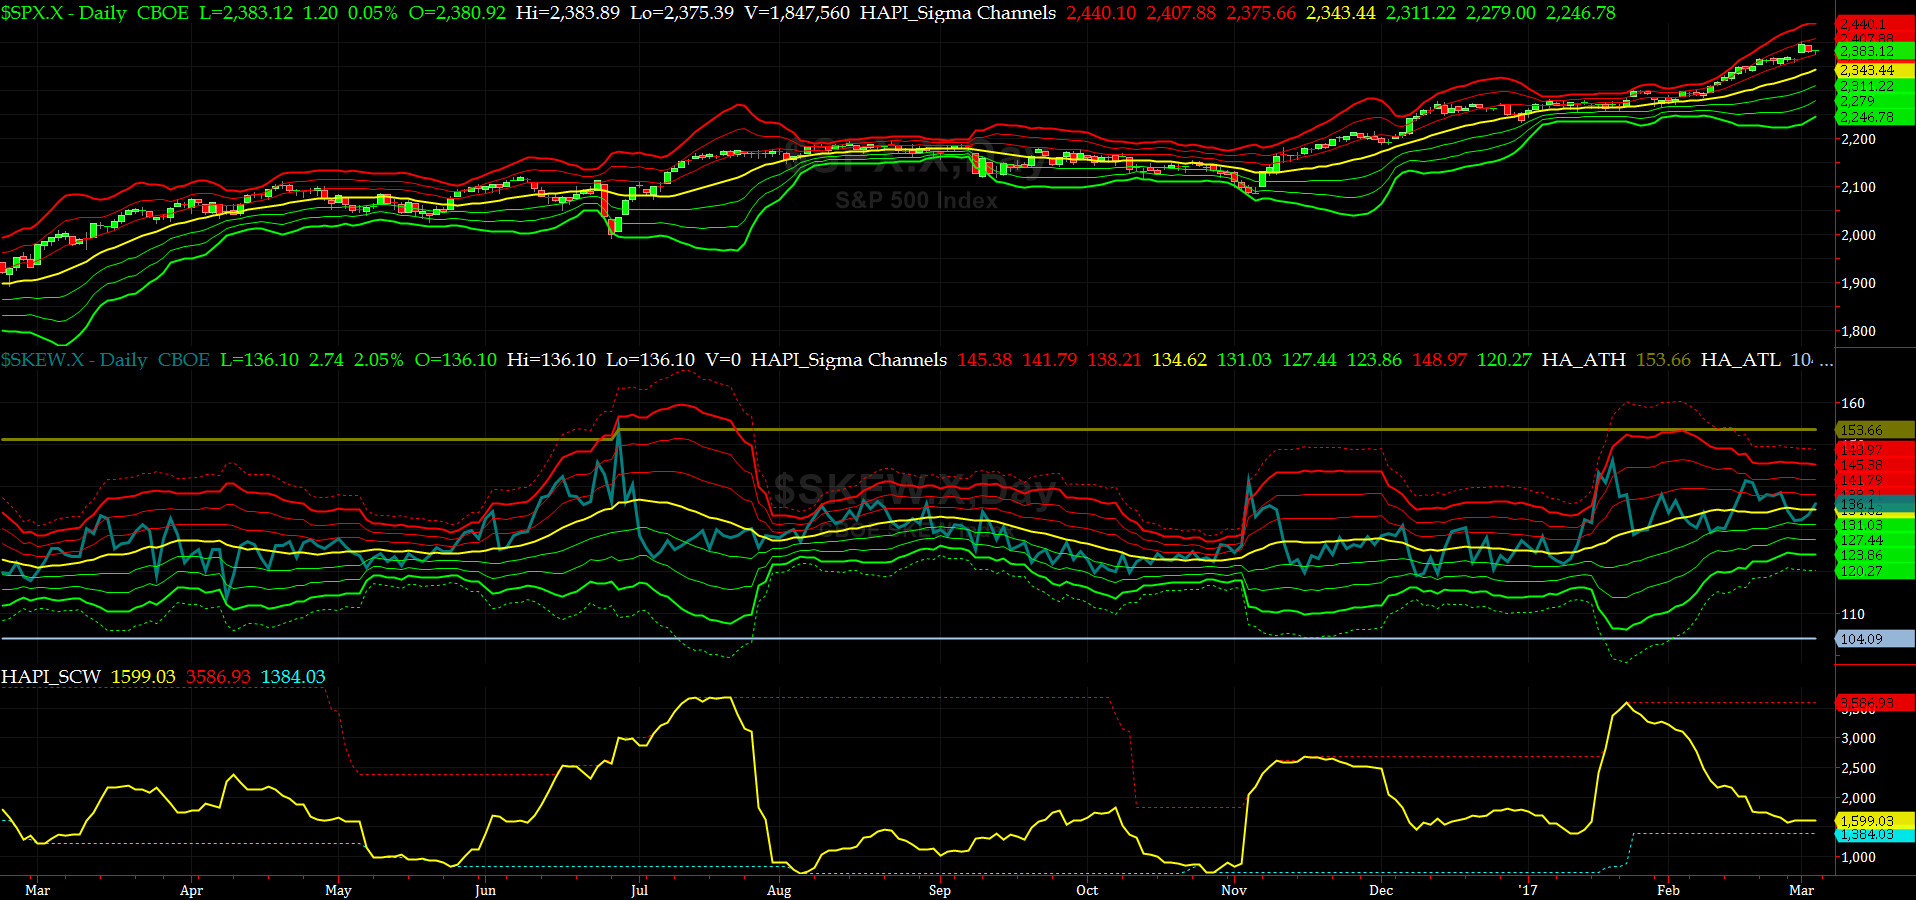
SPX SKEW (Tail Risk) Chart
Last week SPX SKEW (Tail Risk) fell sharply on Wednesday but then rallied a tad ending just about its zero sigma at 136. (normal = 120-125, range 100-150).
All is quiet on the Eastern & Mid-Western Fronts.....
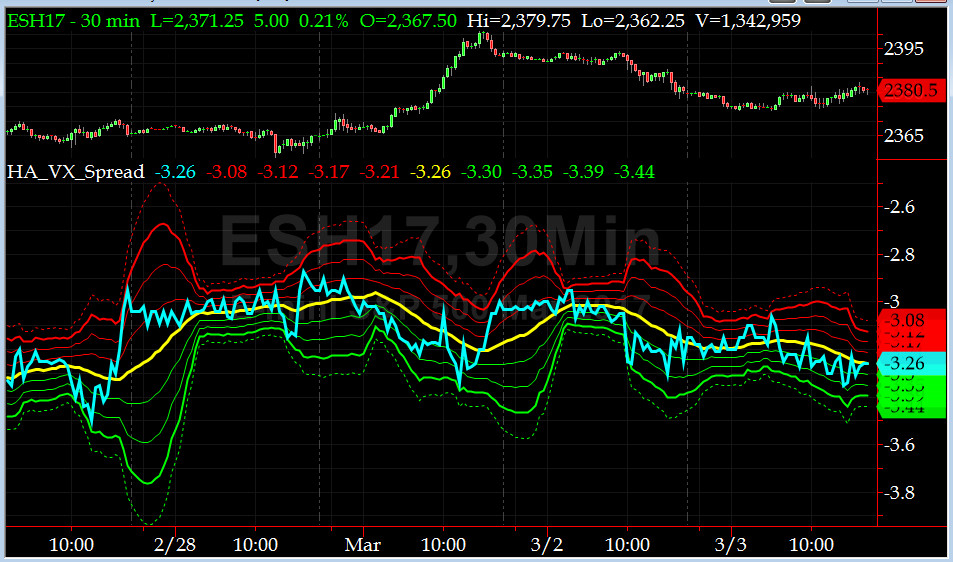
3-month VIX Futures Spread(VX) Chart
Our VX Spread (LONG MAR SHORT JUN) is back to behaving normally as shown on the chart. On Friday, the spread closed at -3.26 near its -1 sigma.
HA_SP2 Chart
HA_SP2 = 66.73 (Buy signal <= 25, Sell Signal >= 75)
SP2 is no longer in OVERBOUGHT zone, thanks to Grumpie's back to early morning tweeting (with typos). We are keeping an eye on our StochRSI (subgraph under SP2) as its three timeframes are finally merged in overbought zone and now the fastest one is down to 40.
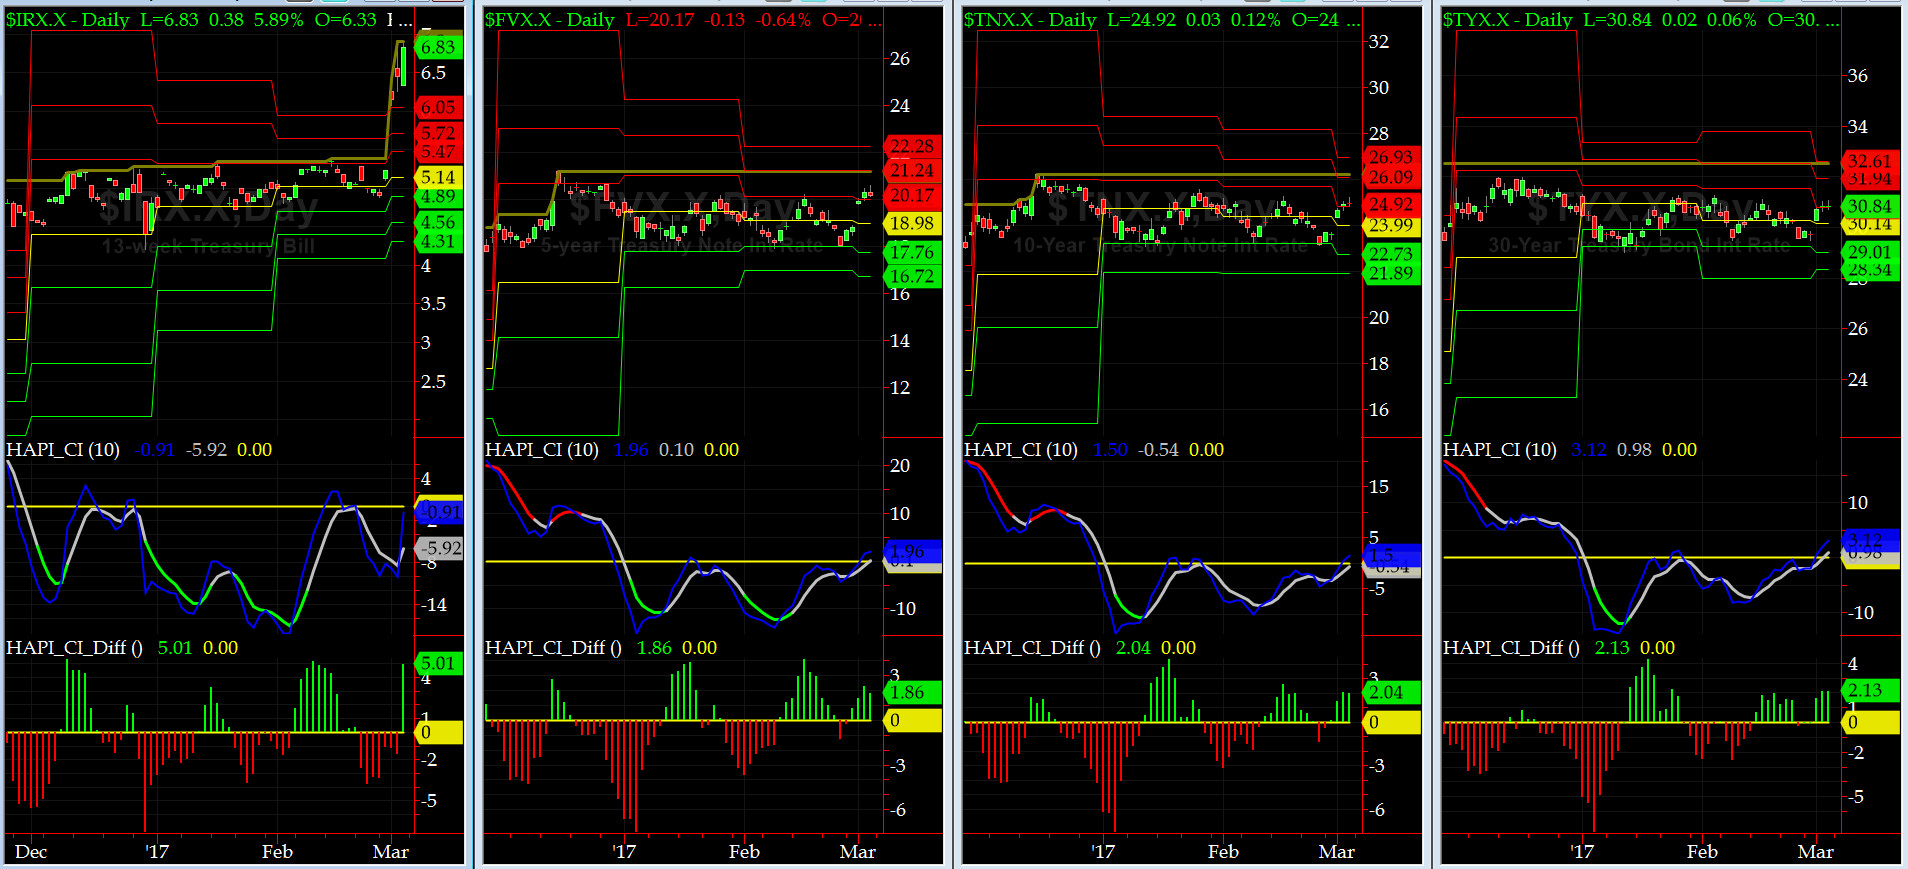
US Treasury T-Notes & T-Bonds Yields Chart
HOUSTON, we have a lift-off of the Yield Curve, all three main engines at MIL POWER, ready to throttle up.....
The short end reacted specially hard to Fed Chair Dr Yellen's (aka AuntieJanet) comments on Friday.
Fari Hamzei
|


 Proactive Market Timing