|
Sunday, March 12, 2017, 1300ET
Market Timing Charts, Analysis & Commentary for Issue #184
Timer Charts of S&P-500 Cash Index (SPX) + NASDAQ-100 Cash Index (NDX)
Most recent S&P-500 Cash Index (SPX): 2372.60 down -10.52 (down -0.44%) for the week ending Friday, March 10, 2017, which closed just above its zero sigma.
SPX ALL TIME INTRADAY HIGH = 2400.98 (reached on Wednesday, March 1, 2017)
SPX ALL TIME CLOSING HIGH = 2395.96 (reached on Wednesday, March 1, 2017)
Current DAILY +2 Sigma SPX = 2398 with WEEKLY +2 Sigma = 2418
Current DAILY 0 Sigma (20 day MA) SPX = 2361 with WEEKLY 0 Sigma = 2259
Current DAILY -2 Sigma SPX = 2325 with WEEKLY -2 Sigma = 2101
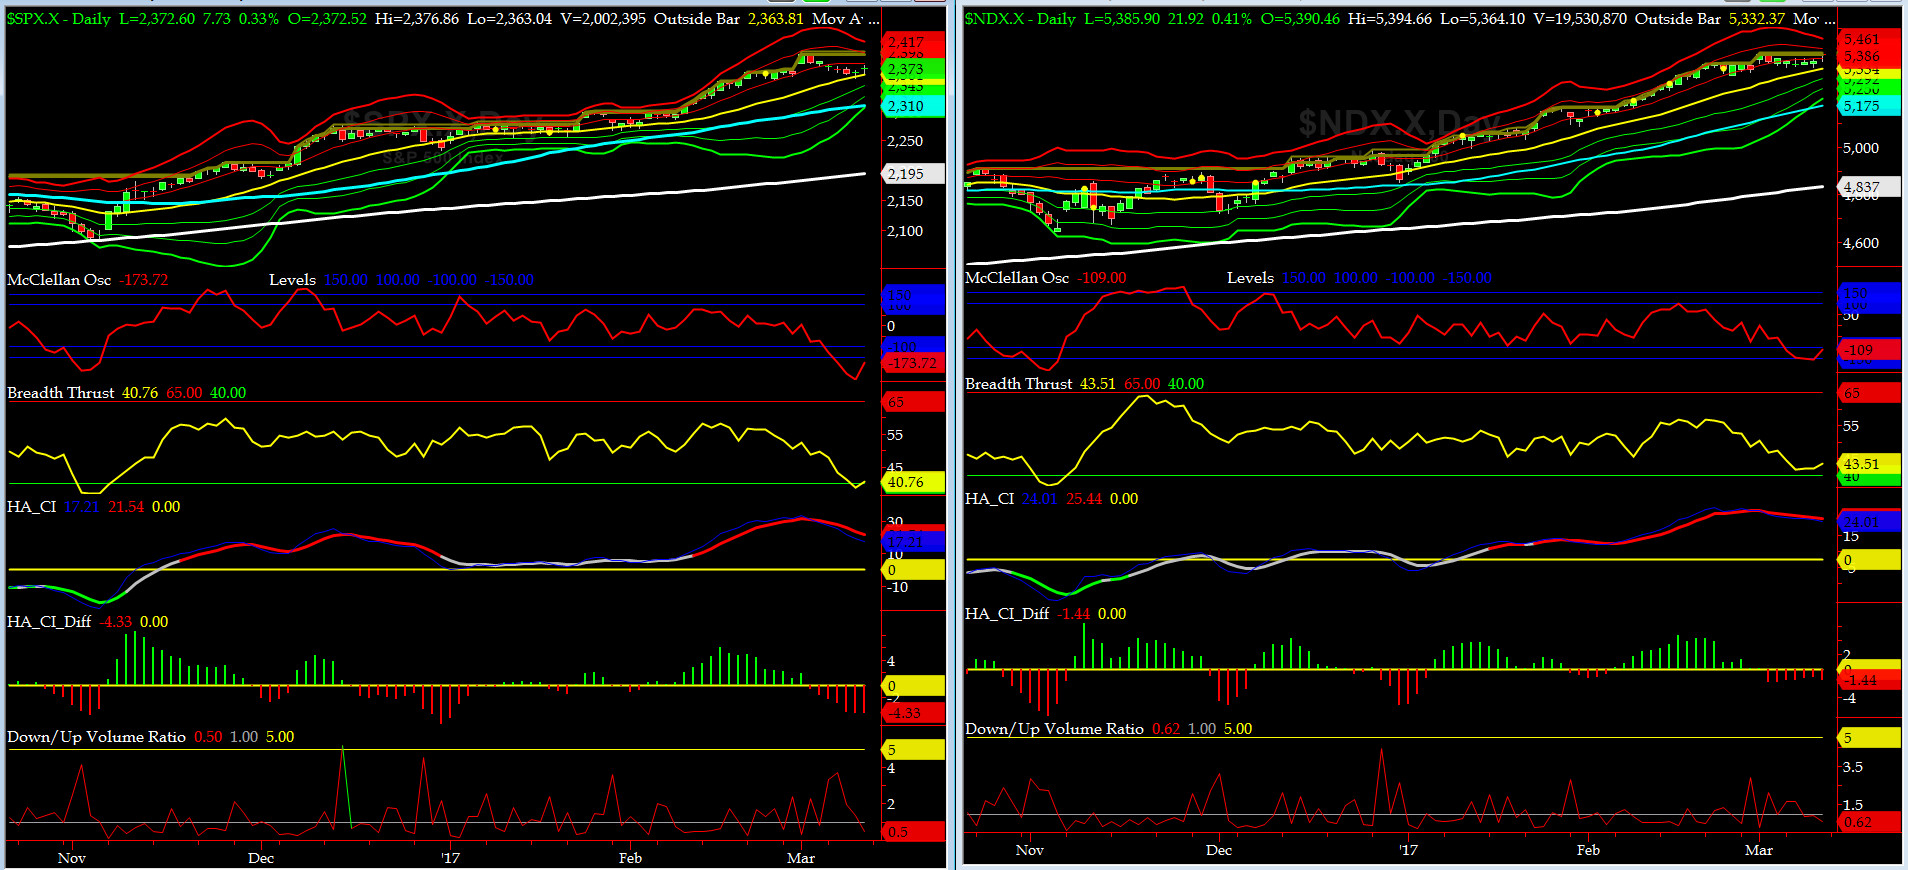
NYSE McClellan Oscillator = -173 (-150 is start of the O/S area; around -275 to -300 area or lower, we go into the �launch-pad� mode, over +150, we are in O/B area)
NYSE Breadth Thrust = 40.76 (40 is considered as oversold and 65 as overbought)
Well, we finally got our small (1.9%) pullback but our prop indicators went dramatically low.... we should head up now, ioho.

Canaries [in the Coal Mine] Chart for DJ TRAN & RUT Indices
200-Day MA DJ TRAN = 8410 or 10.5% below DJ TRAN (max observed in last 5 yrs = 20.2%, min = -20.3%)
200-Day MA RUT = 1269 or 7.6% below RUT (max observed in last 5 yrs = 21.3%, min = -22.6%)
DJ Transports (proxy for economic conditions 6 to 9 months hence) made a dramatic run south from ATHs to -3 sigma and then bounced up its 50bar MA on Friday.
Russell 2000 small caps (proxy for Risk ON/OFF) also sold off hard from ATHs to -3 sigma and then went sideways on Friday (with over-the-top Feb NFP numbers reported). RISK still remains ON but no longer RED HOT.
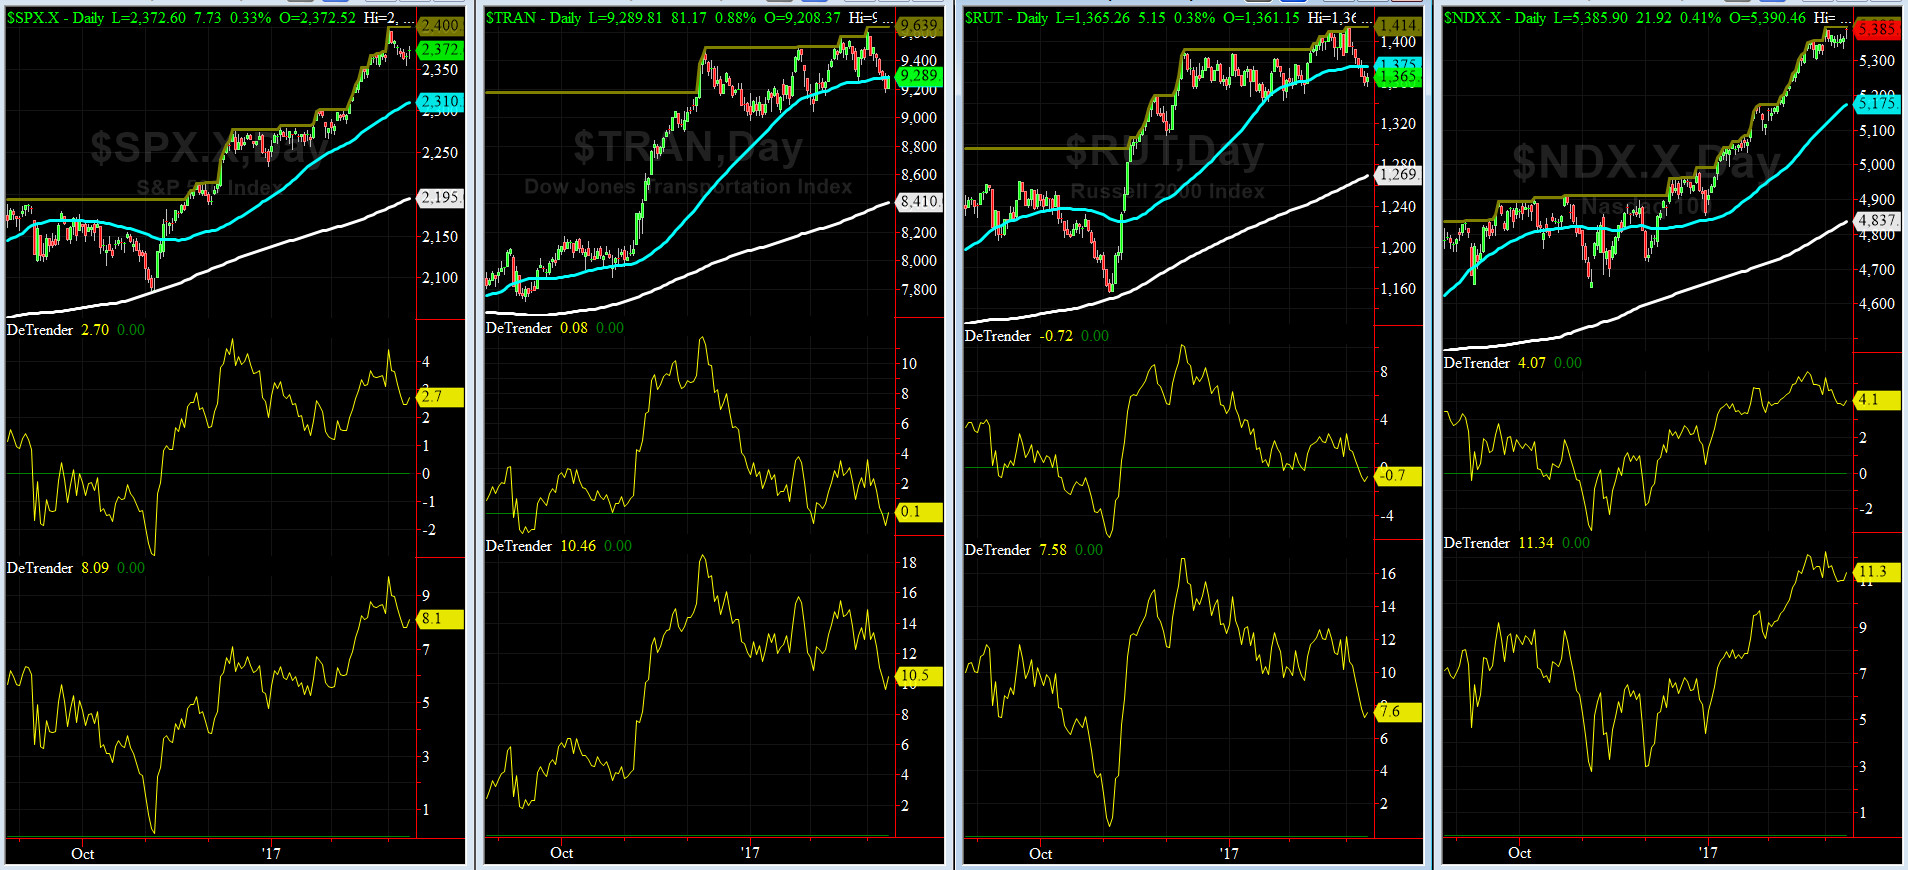
DeTrenders Charts for SPX, NDX, TRAN & RUT Indices
50-Day MA SPX = 2310 or 2.7% below SPX closed on Friday (max observed in last 5 yrs = +8.6%, min = -9.3%)
200-Day MA SPX = 2195 or 8.1% below SPX (max observed in last 5 yrs = 15.2%, min = -14%)
Two of our eight DeTrenders remain positive now. The DeTrenders for DJ Tran & RUT will continue to be harbingers of future price behavior in broad indices.

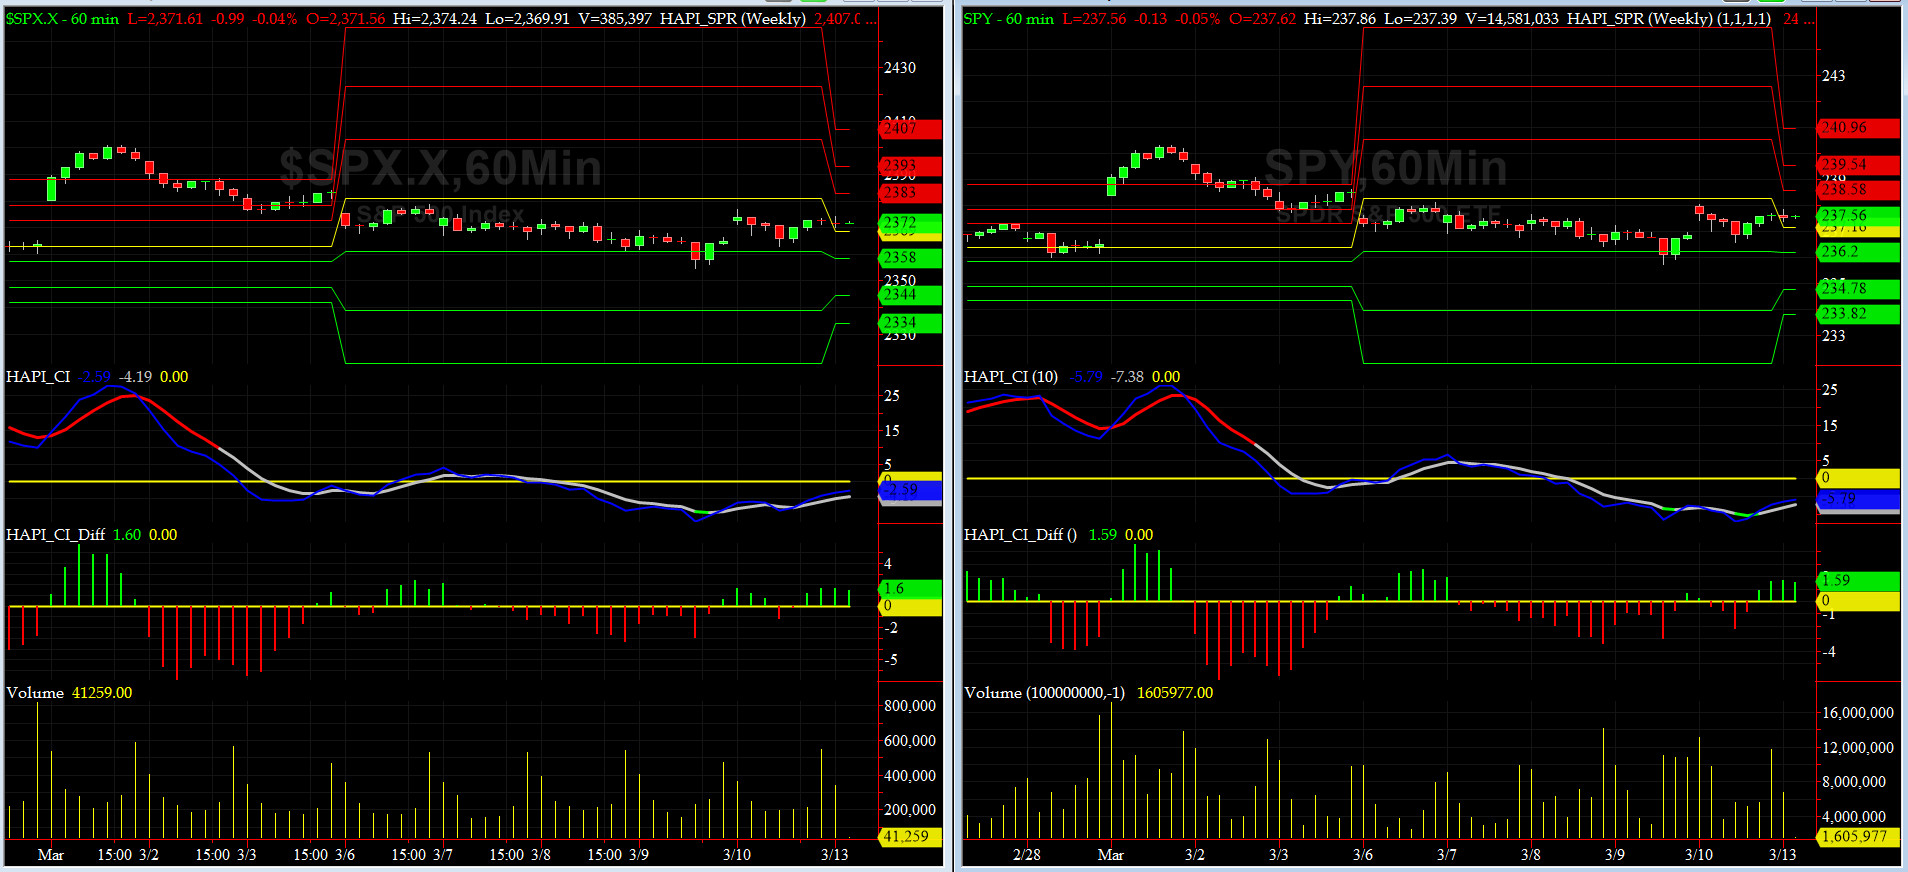
HA_SP1_Momo Chart
WEEKLY Timing Model = on a BUY Signal since Friday 12/16/16 CLOSE at 2258
DAILY Timing Model = on a BUY Signal since Wednesday 2/8/17 CLOSE at 2295
Max SPX 52wk-highs reading last week = 42 (over 120-140, the local maxima is in)
Max SPX 52wk-Lows reading last week = 14 (over 40-60, the local minima is in)
HA_SP1 at just below its zero sigma channels
HA_Momo = -2.86 (reversals most likely occur above +10 or below -10)
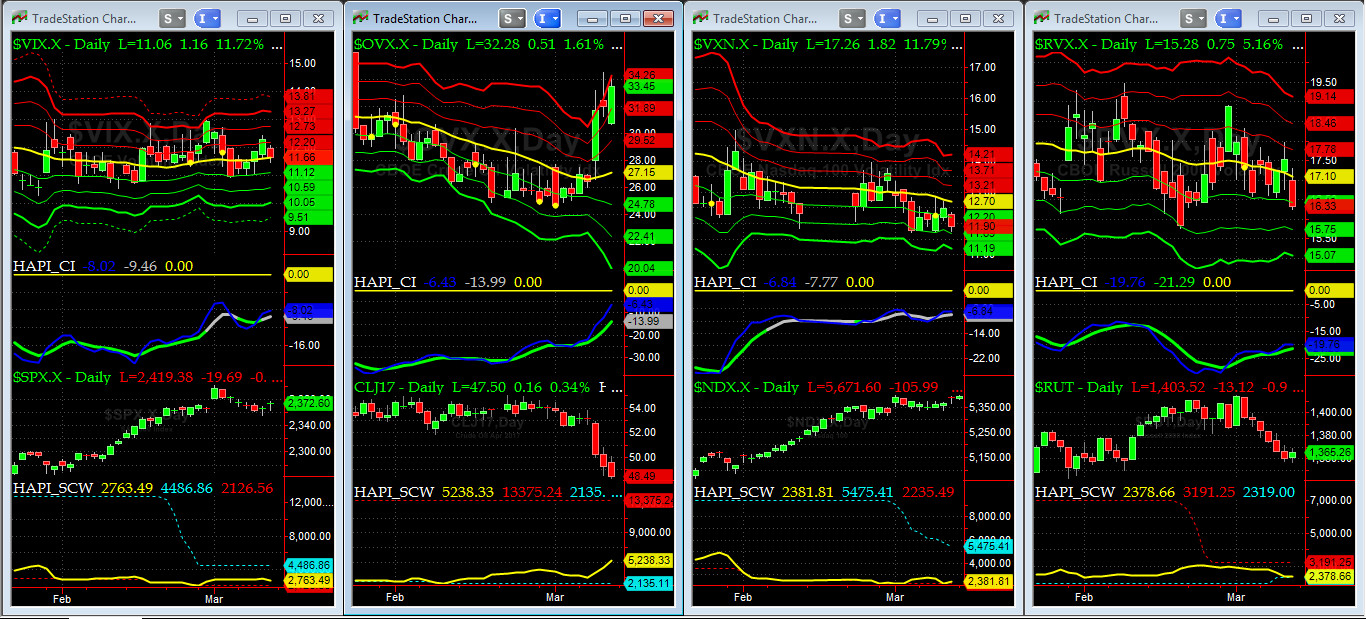
Vol of the Vols Chart
VIX is currently at its zero sigma level at 11.66 (remember it�s the VIX�s volatility pattern (its sigma channels) that matters, and not the level of VIX itself (this is per Dr. Robert Whaley, a great mentor and the inventor of original VIX, now called VXO). VIX usually peaks around a test of its +4 sigma).
The VOL Complex with exception of OVX (Crude) retreated last week by a tad.
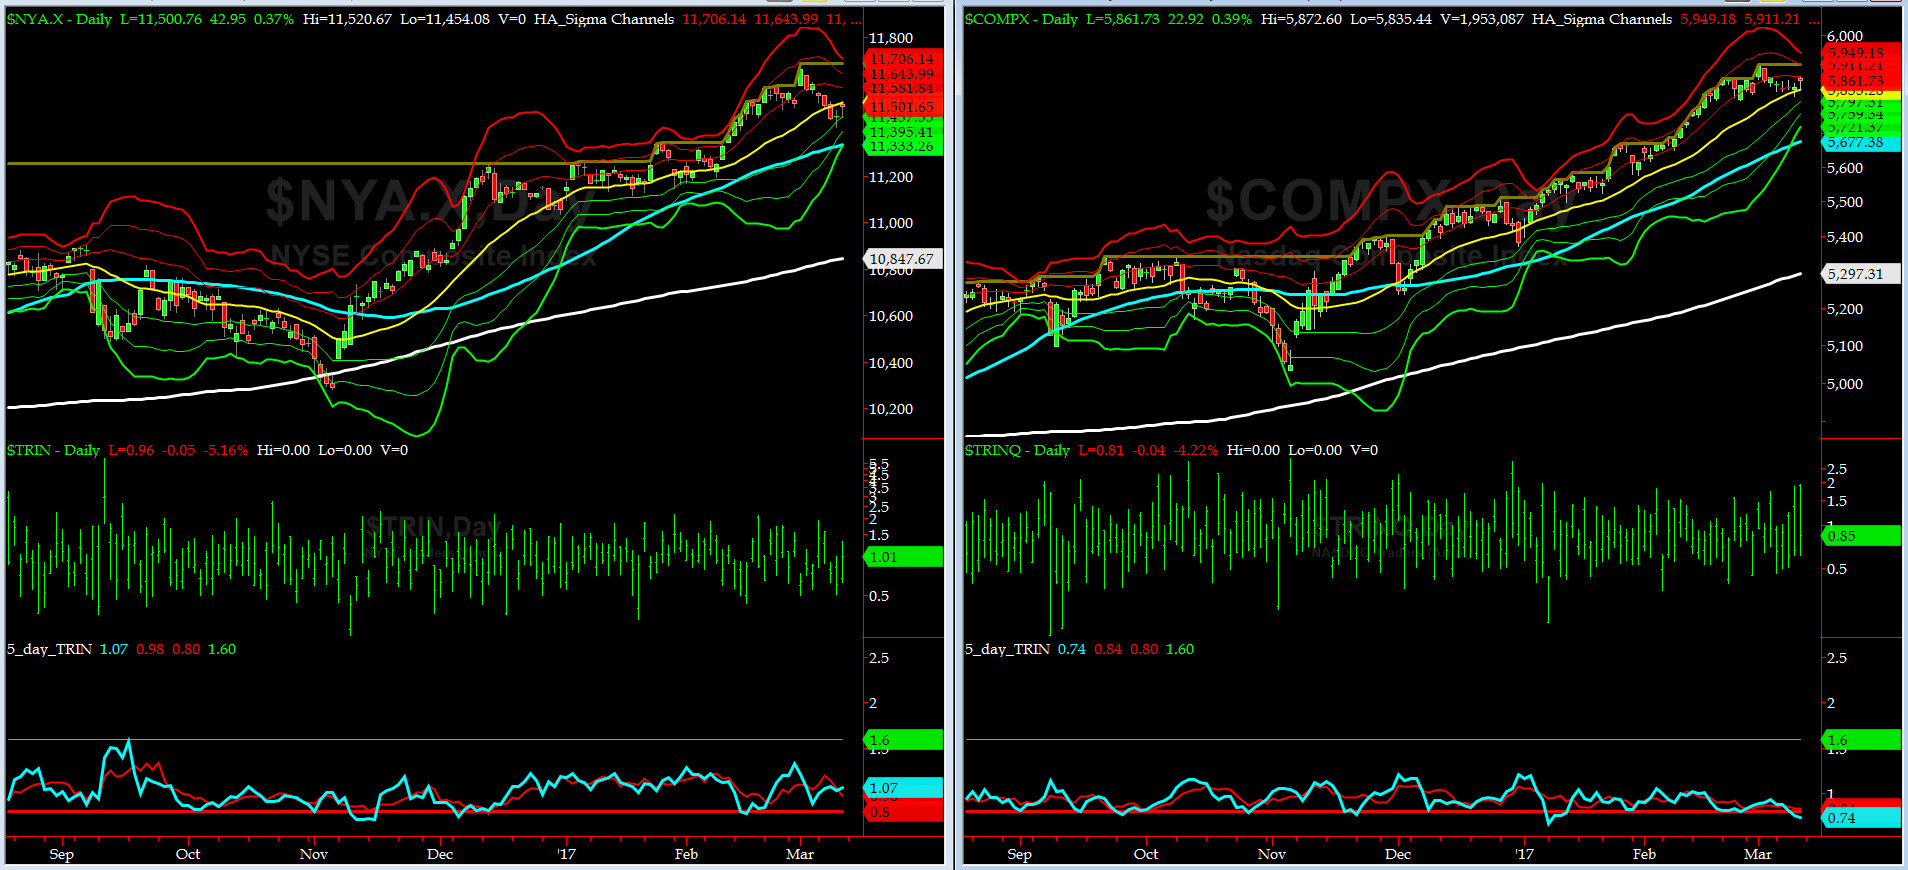
5-day TRIN & TRINQ Charts
NYSE 5-day TRIN is NEUTRAL now while NASDAQ 5-day TRIN is on SELL signal. That's the reverse pattern of last week !!
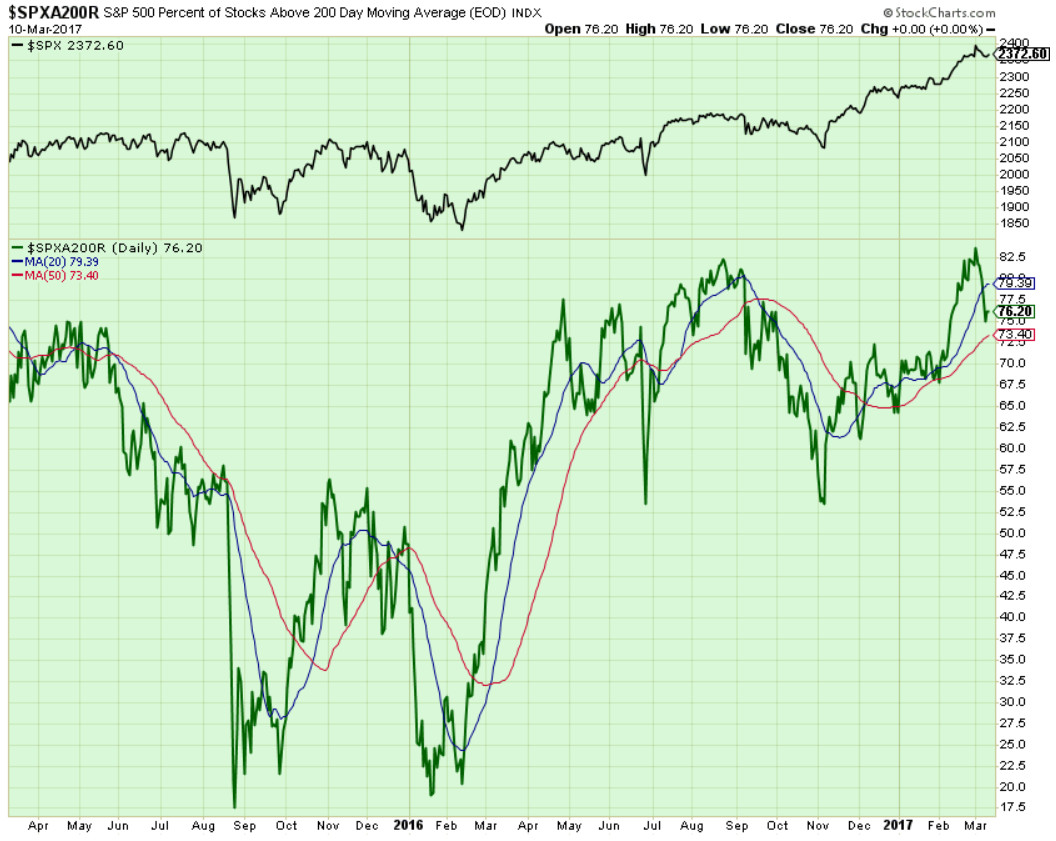
Components of SPX above their respective 200day MA Chart
As expected this scoring indicator took a dive this week after rising to over 83%... Stocking up on iced tea, per written orders of our Executive Officer(XO), @Capt_Tiko have paid off. He simply knows this game too well.
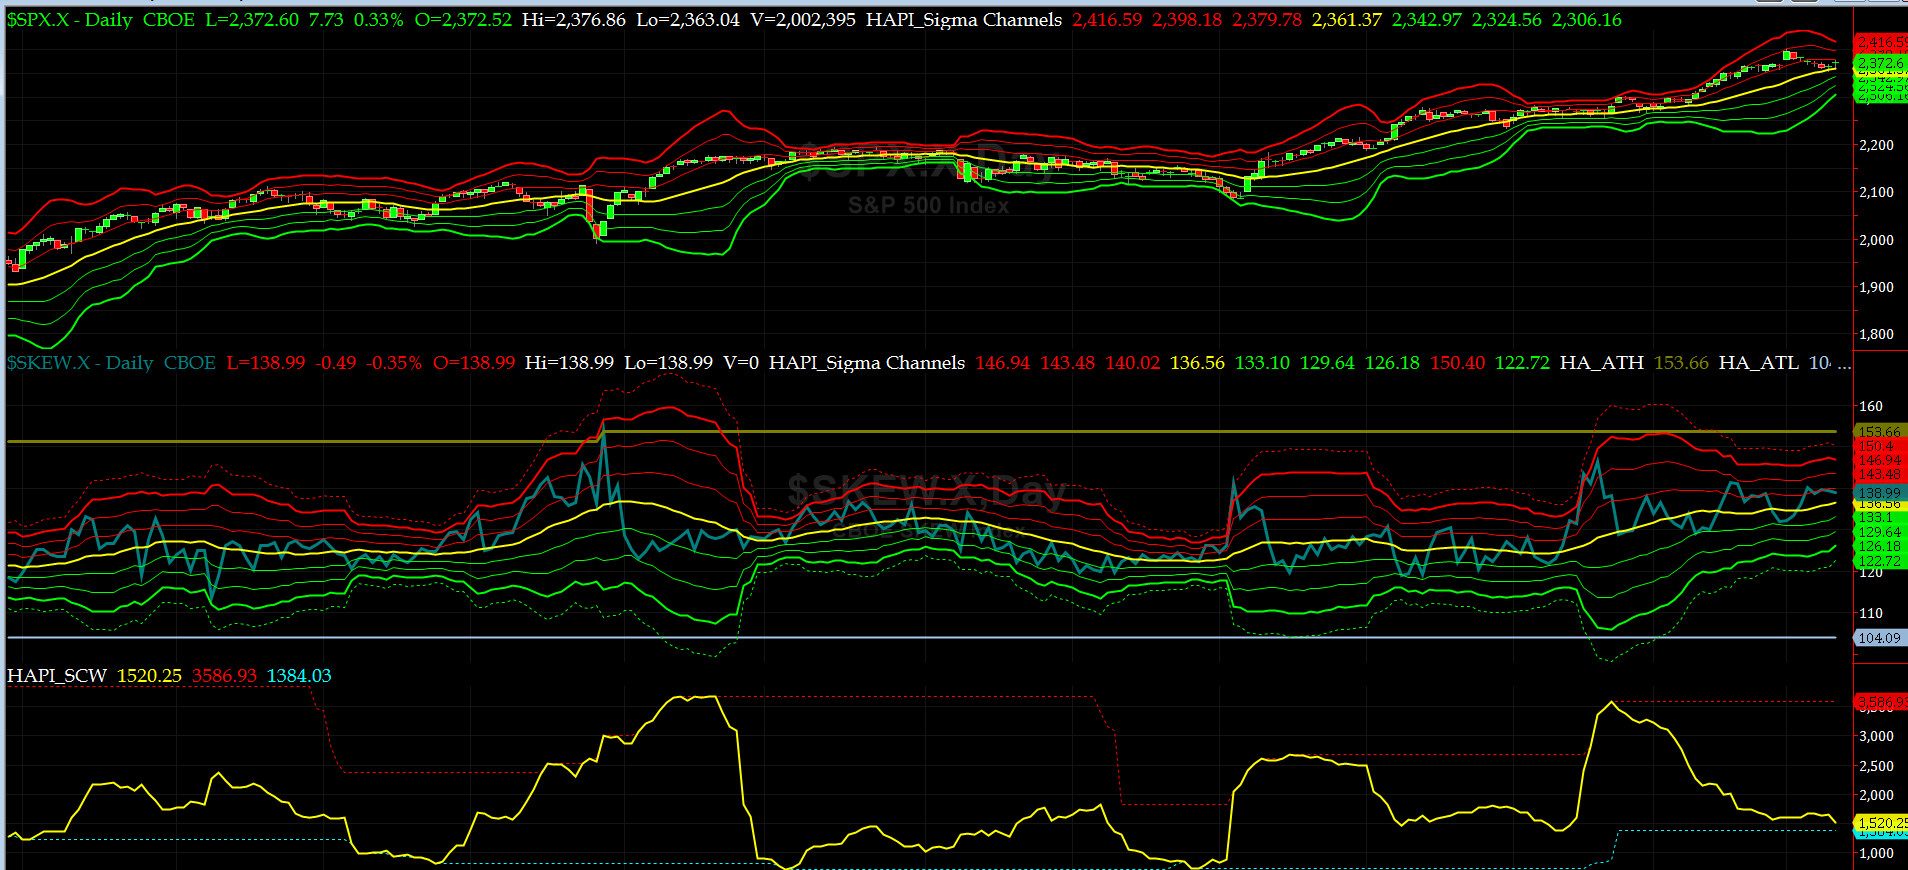
SPX SKEW (Tail Risk) Chart
Last week SPX SKEW (Tail Risk) went ROMAN and created nothing but Sausage and ended just about its zero sigma at 139. (normal = 120-125, range 100-150).
All is quiet on the Eastern & Mid-Western Fronts.....
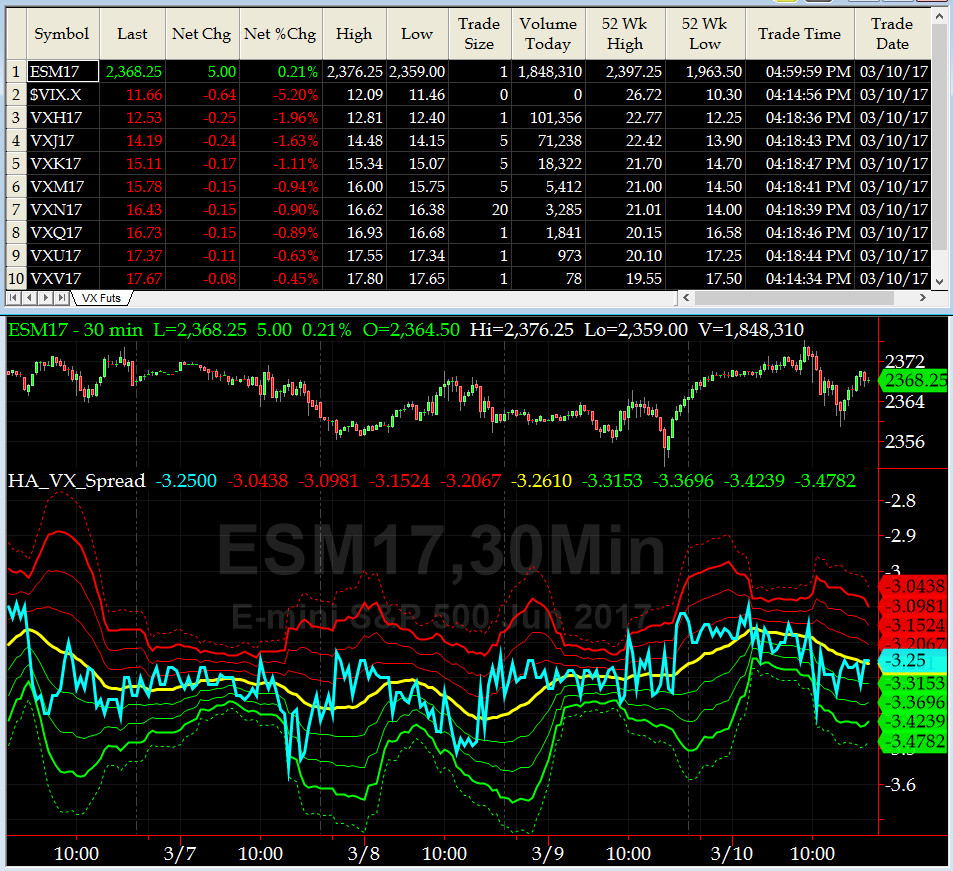
3-month VIX Futures Spread(VX) Chart
Our VX Spread (LONG MAR SHORT JUN) behaved pretty docile this past week, closing at -3.25 near its zero sigma on Friday.

HA_SP2 Chart
HA_SP2 = 56 (Buy signal <= 25, Sell Signal >= 75)
SP2 have a dramatic dive to 39 then reversed on Thursday (one day ahead of price). I love this indicator.
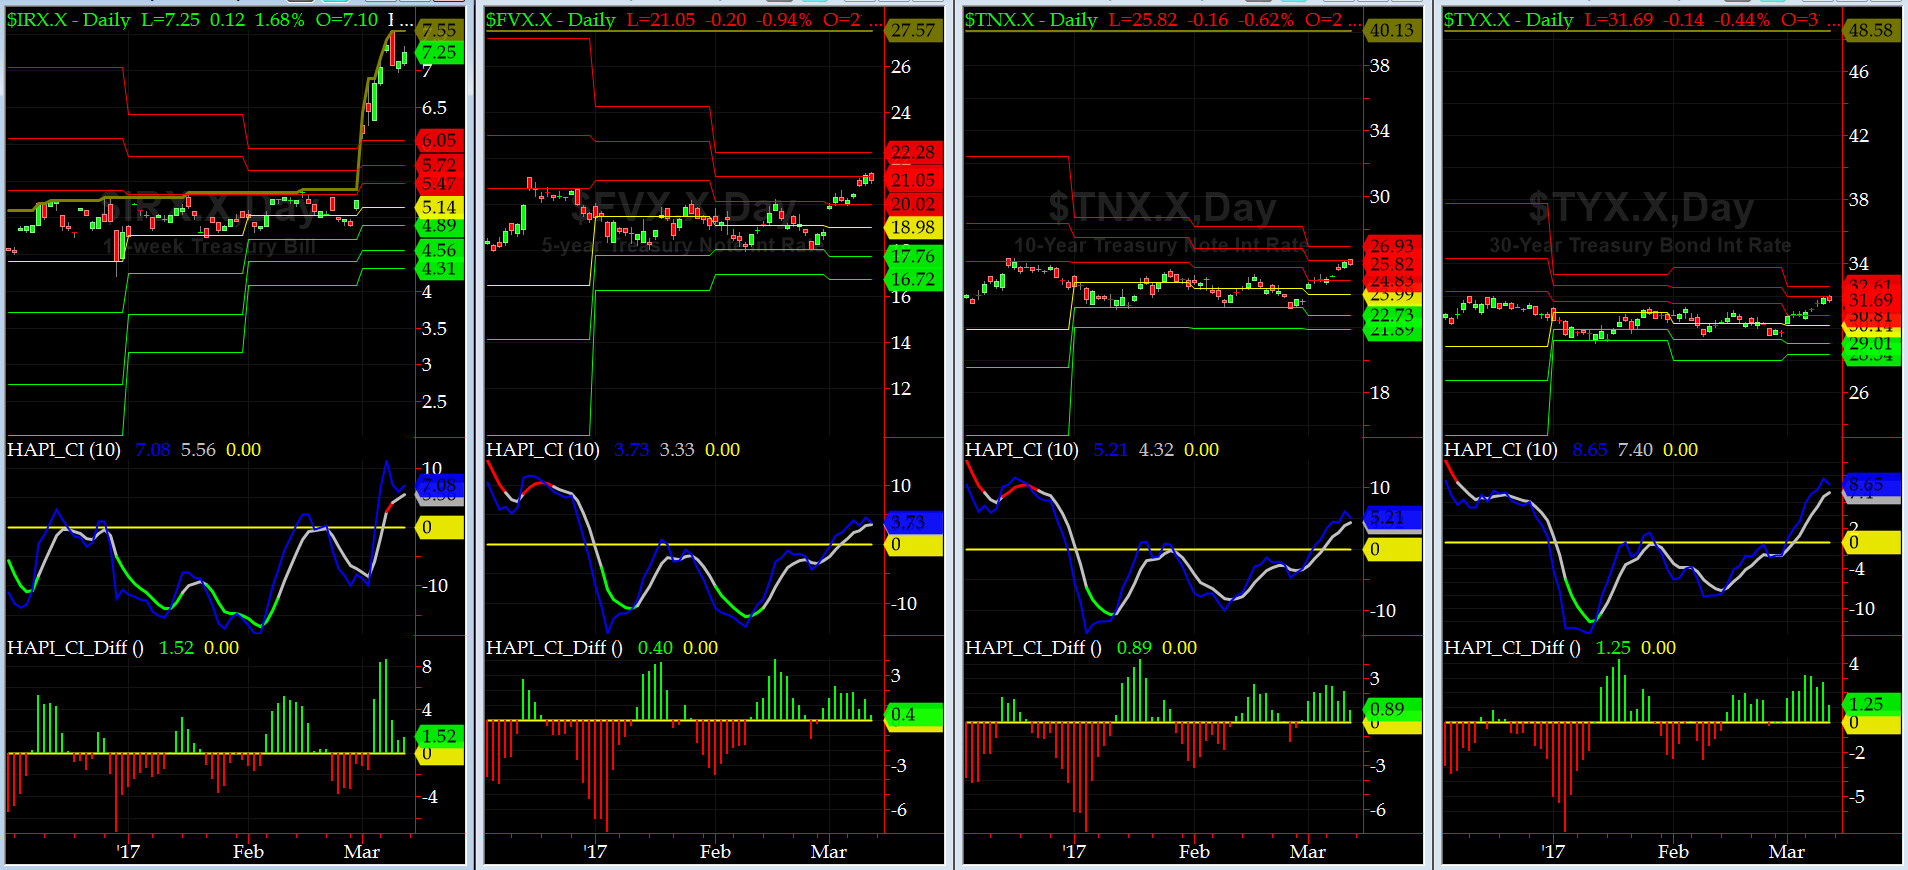
US Treasury T-Notes & T-Bonds Yields Chart
HOUSTON, the lift-off of the Yield Curve continues, specially the front end..... MAX Q is ahead.
Fari Hamzei
|


 Proactive Market Timing