|
Sunday, March 26, 2017, 2100ET
Market Timing Charts, Analysis & Commentary for Issue #185
Timer Charts of S&P-500 Cash Index (SPX) + NASDAQ-100 Cash Index (NDX)
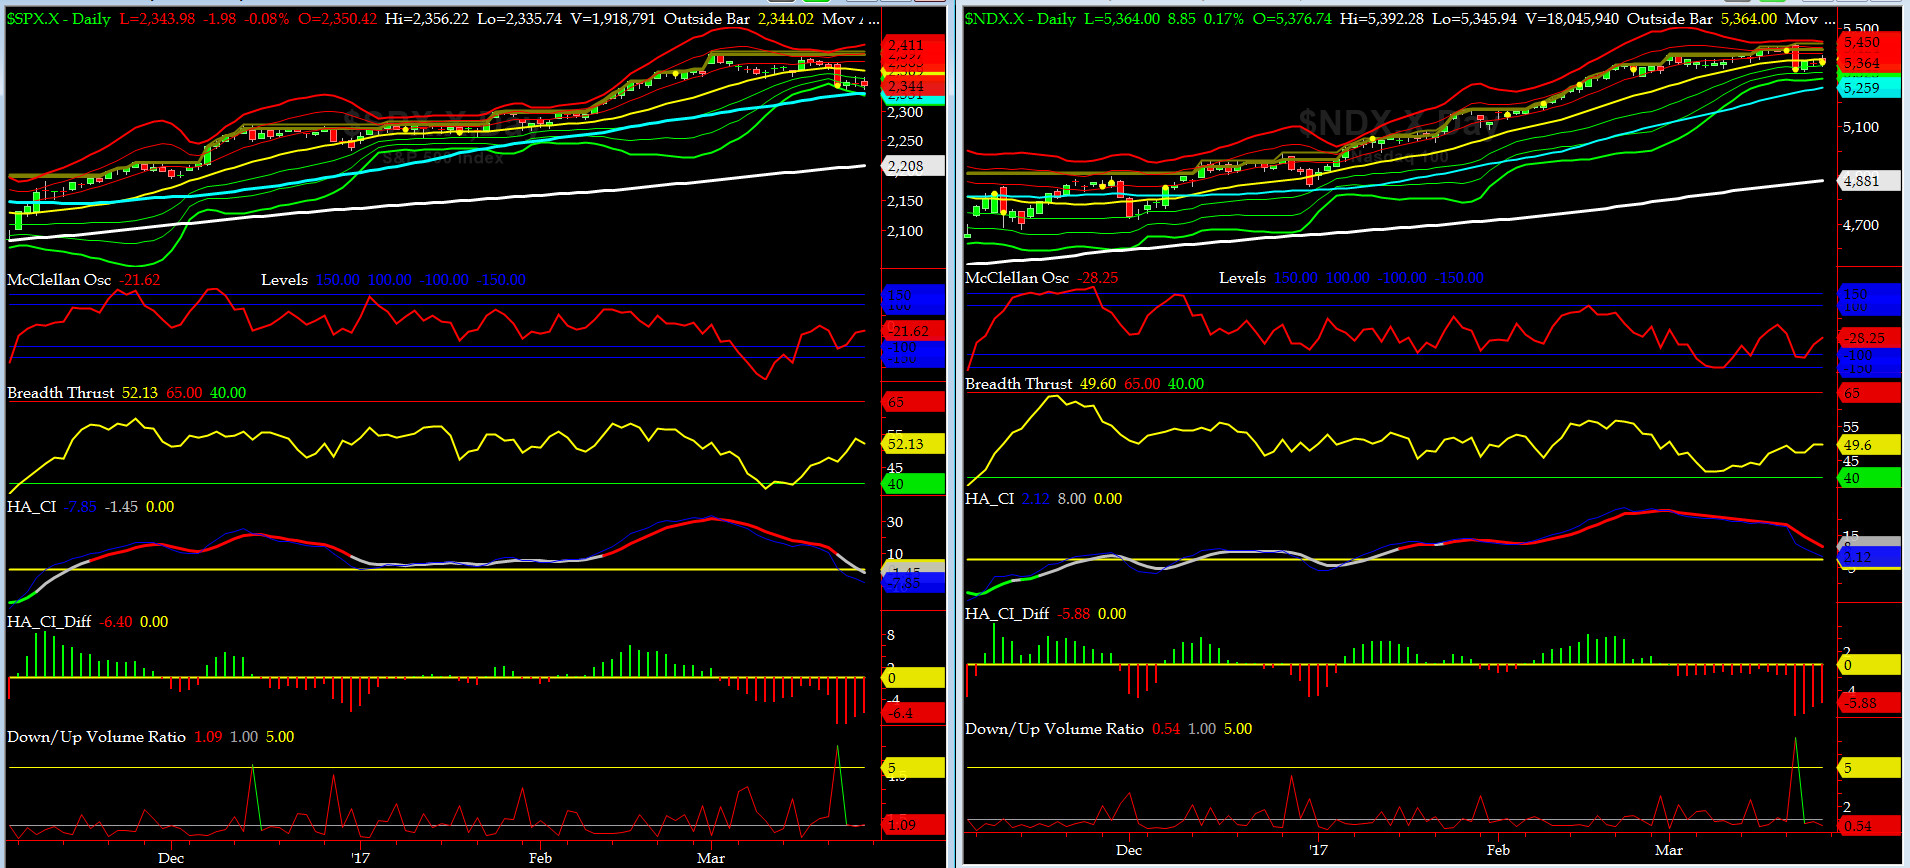
Most recent S&P-500 Cash Index (SPX): 2343.98 down -28.62 (down -1.2%) for two weeks ending Friday, March 24, 2017, which closed just above its -2 sigma.
SPX ALL TIME INTRADAY HIGH = 2400.98 (reached on Wednesday, March 1, 2017)
SPX ALL TIME CLOSING HIGH = 2395.96 (reached on Wednesday, March 1, 2017)
Current DAILY +2 Sigma SPX = 2397 with WEEKLY +2 Sigma = 2415
Current DAILY 0 Sigma (20 day MA) SPX = 2369 with WEEKLY 0 Sigma = 2285
Current DAILY -2 Sigma SPX = 2341 with WEEKLY -2 Sigma = 2155
NYSE McClellan Oscillator = -21 (-150 is start of the O/S area; around -275 to -300 area or lower, we go into the �launch-pad� mode, over +150, we are in O/B area)
NYSE Breadth Thrust = 52.1 (40 is considered as oversold and 65 as overbought)
While I am at my command post, nothing happens. So I stepped out of Dodge and they sent in the torpedoes.... last Tuesday, SPX moved down about 4 sigma or about 1.2%. Are we oversold? not yet, IMHO.
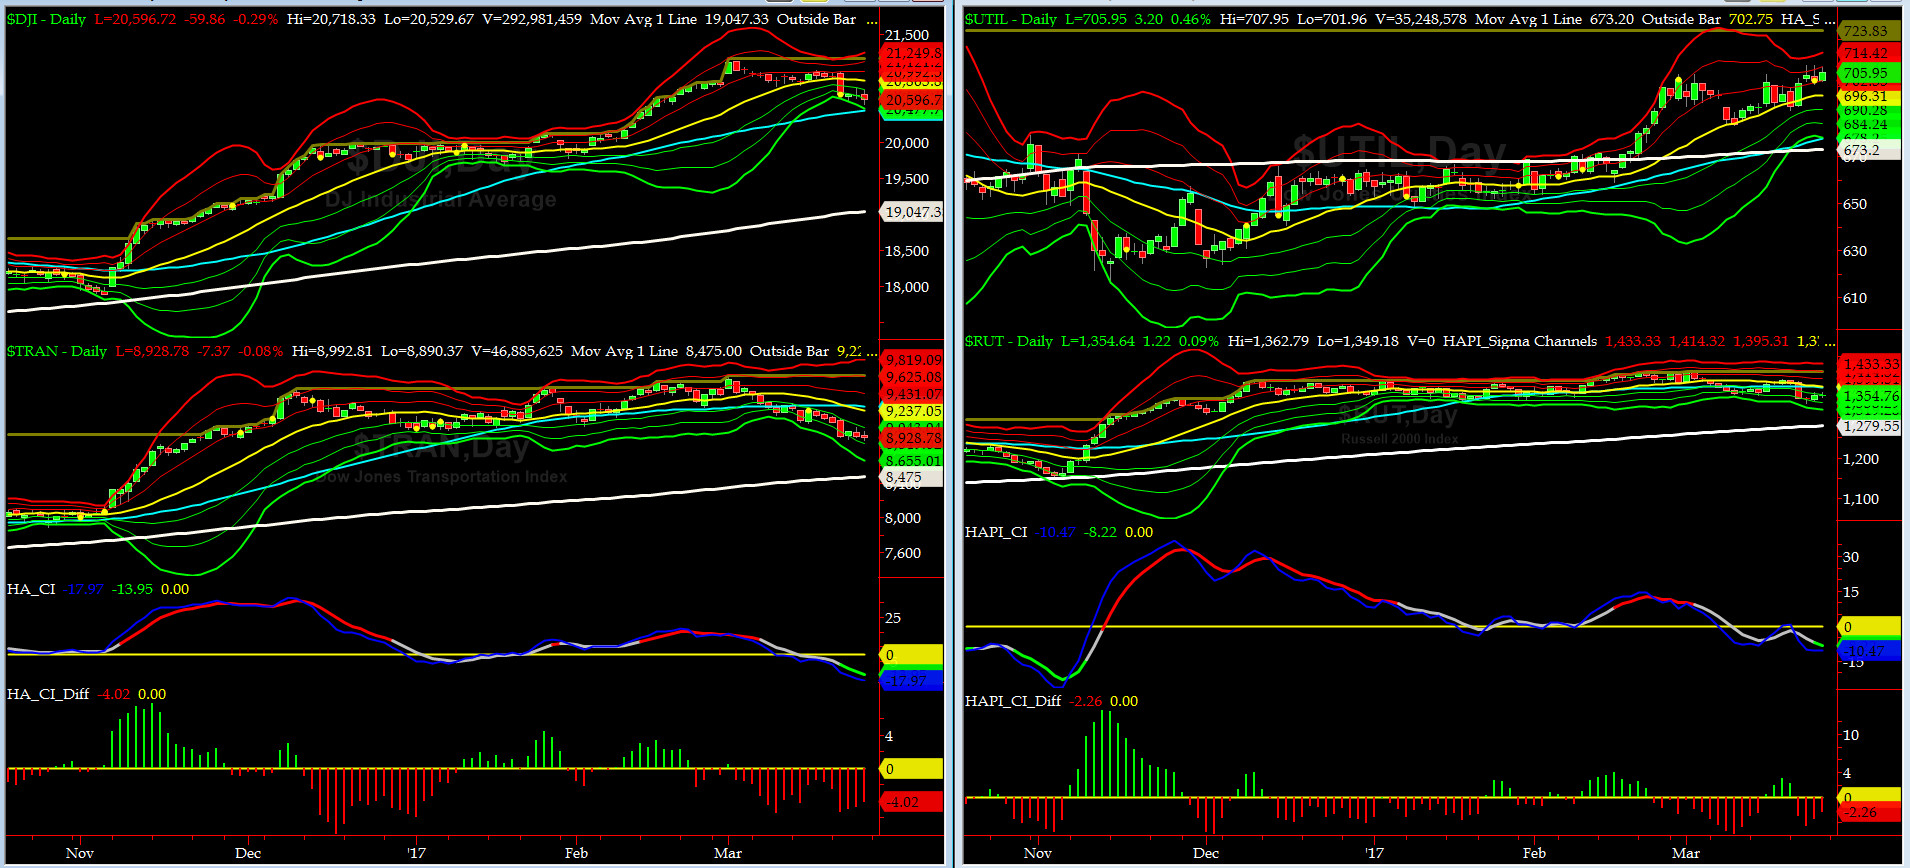
Canaries [in the Coal Mine] Chart for DJ TRAN & RUT Indices
200-Day MA DJ TRAN = 8475 or 5.4% below DJ TRAN (max observed in last 5 yrs = 20.2%, min = -20.3%)
200-Day MA RUT = 1279 or 5.9% below RUT (max observed in last 5 yrs = 21.3%, min = -22.6%)
DJ Transports (proxy for economic conditions 6 to 9 months hence) made a sizable move south on Tuesday to its -2.5 sigma after failing to hold its 50bar MA the week before.
Russell 2000 small caps (proxy for Risk ON/OFF) also sold off on Tuesday to -2 sigma and then settled by Friday at its -1 sigma. RISK still remains ON but it is definitely no longer RED HOT.
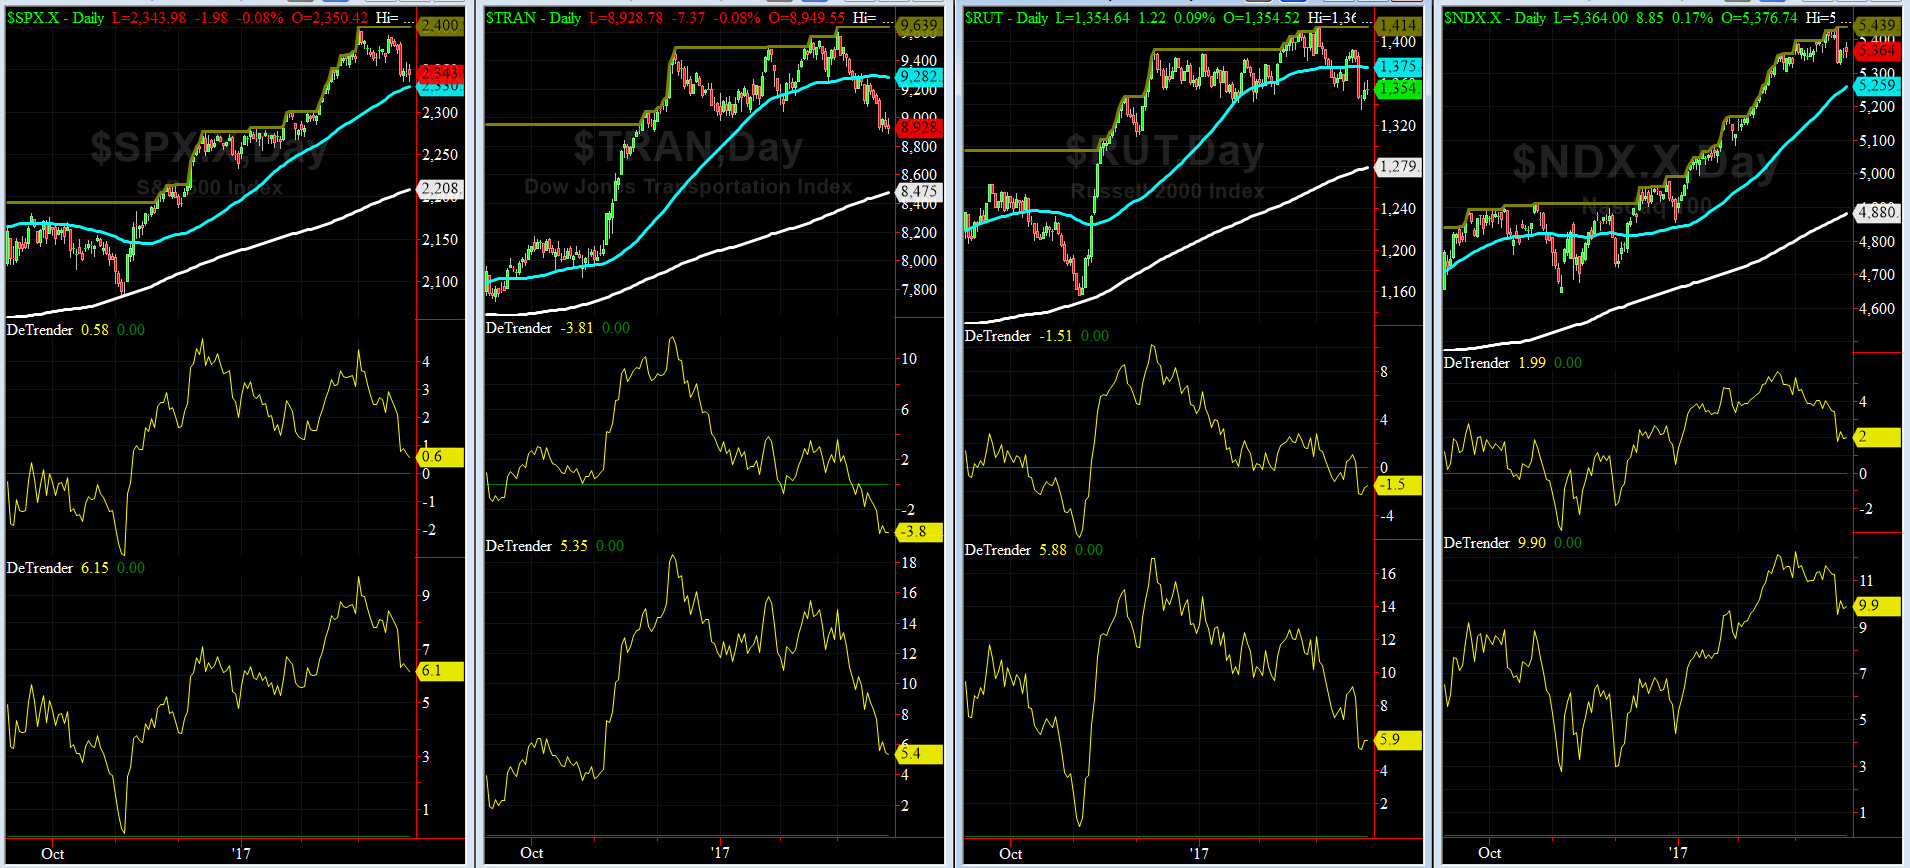
DeTrenders Charts for SPX, NDX, TRAN & RUT Indices
50-Day MA SPX = 2330 or 0.6% below SPX closed on Friday (max observed in last 5 yrs = +8.6%, min = -9.3%)
200-Day MA SPX = 2208 or 6.1% below SPX (max observed in last 5 yrs = 15.2%, min = -14%)
Two of our eight DeTrenders remain negative now. The DeTrenders for DJ Tran & RUT will continue to be harbingers of future price behavior in broad indices.
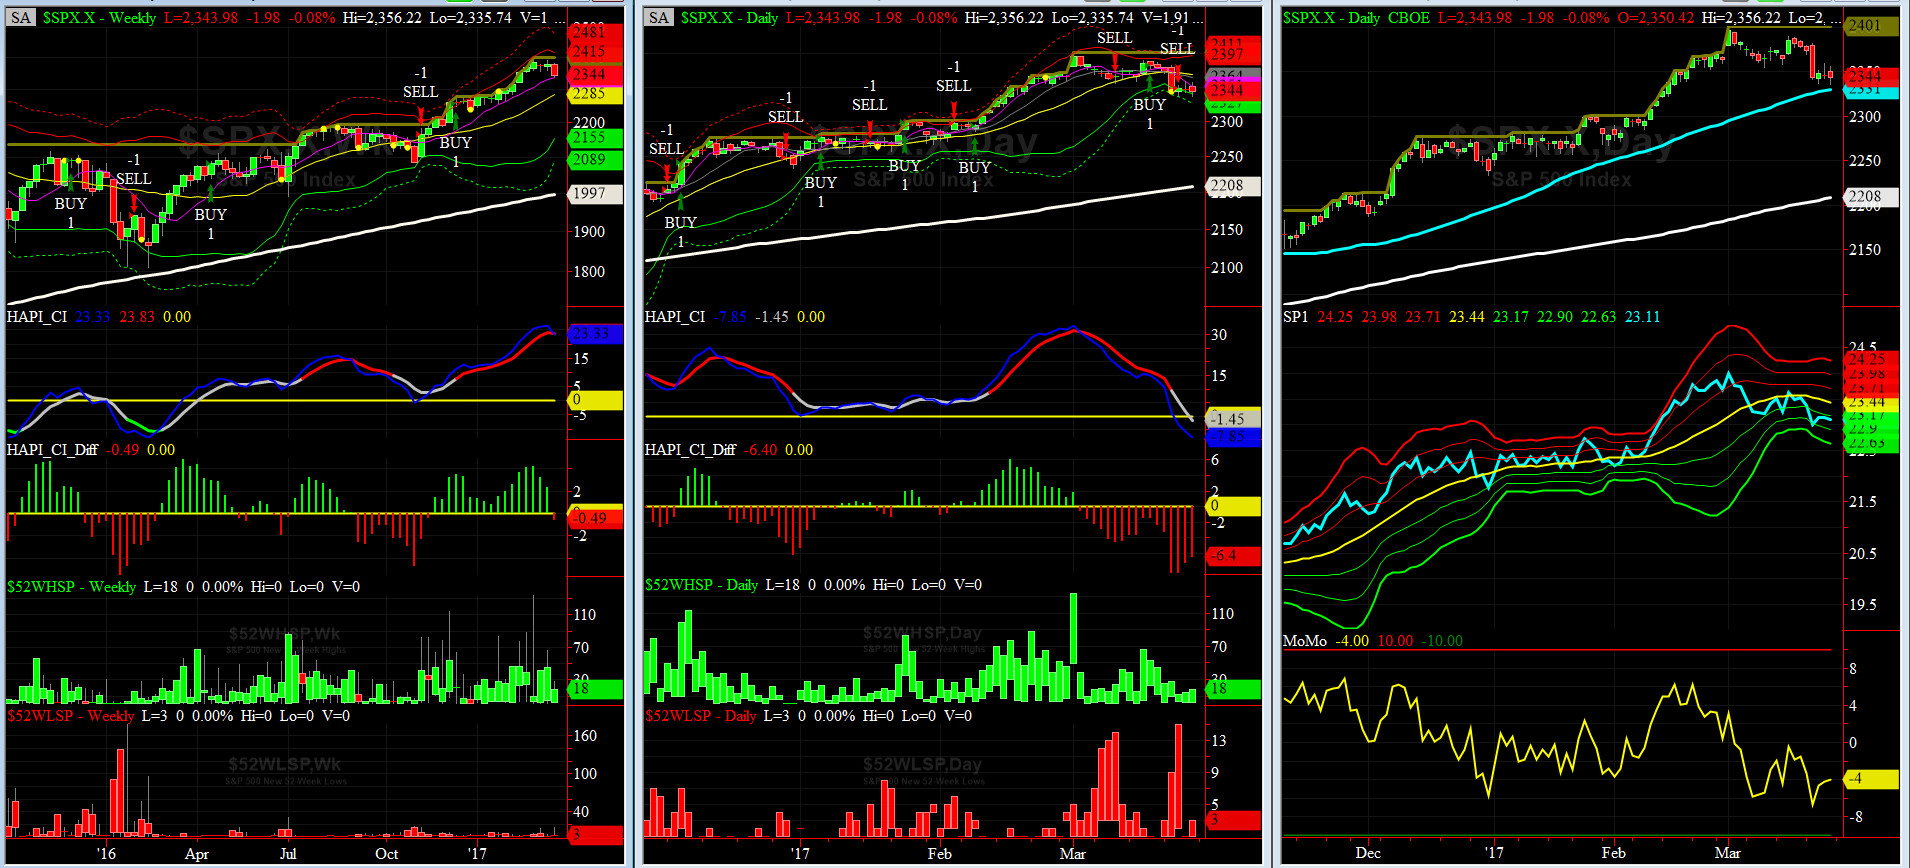
HA_SP1_Momo Chart
WEEKLY Timing Model = on a BUY Signal since Friday 12/16/16 CLOSE at 2258
DAILY Timing Model = on a SELL Signal since Wednesday 3/22/17 CLOSE at 2348
Max SPX 52wk-highs reading last week = 42 (over 120-140, the local maxima is in)
Max SPX 52wk-Lows reading last week = 14 (over 40-60, the local minima is in)
HA_SP1 at just below its -1 sigma channels
HA_Momo = -4 (reversals most likely occur above +10 or below -10)

Vol of the Vols Chart
VIX is currently at its +1.5 sigma level at 13.96, having traded over 14 which was a tad over its +3 sigma (remember it�s the VIX�s volatility pattern (its sigma channels) that matters, and not the level of VIX itself (this is per Dr. Robert Whaley, a great mentor and the inventor of original VIX, now called VXO). VIX usually peaks around a test of its +4 sigma).
In contrast with previous weeks, the VOL Complex with exception of OVX (Crude Oil) moved up.
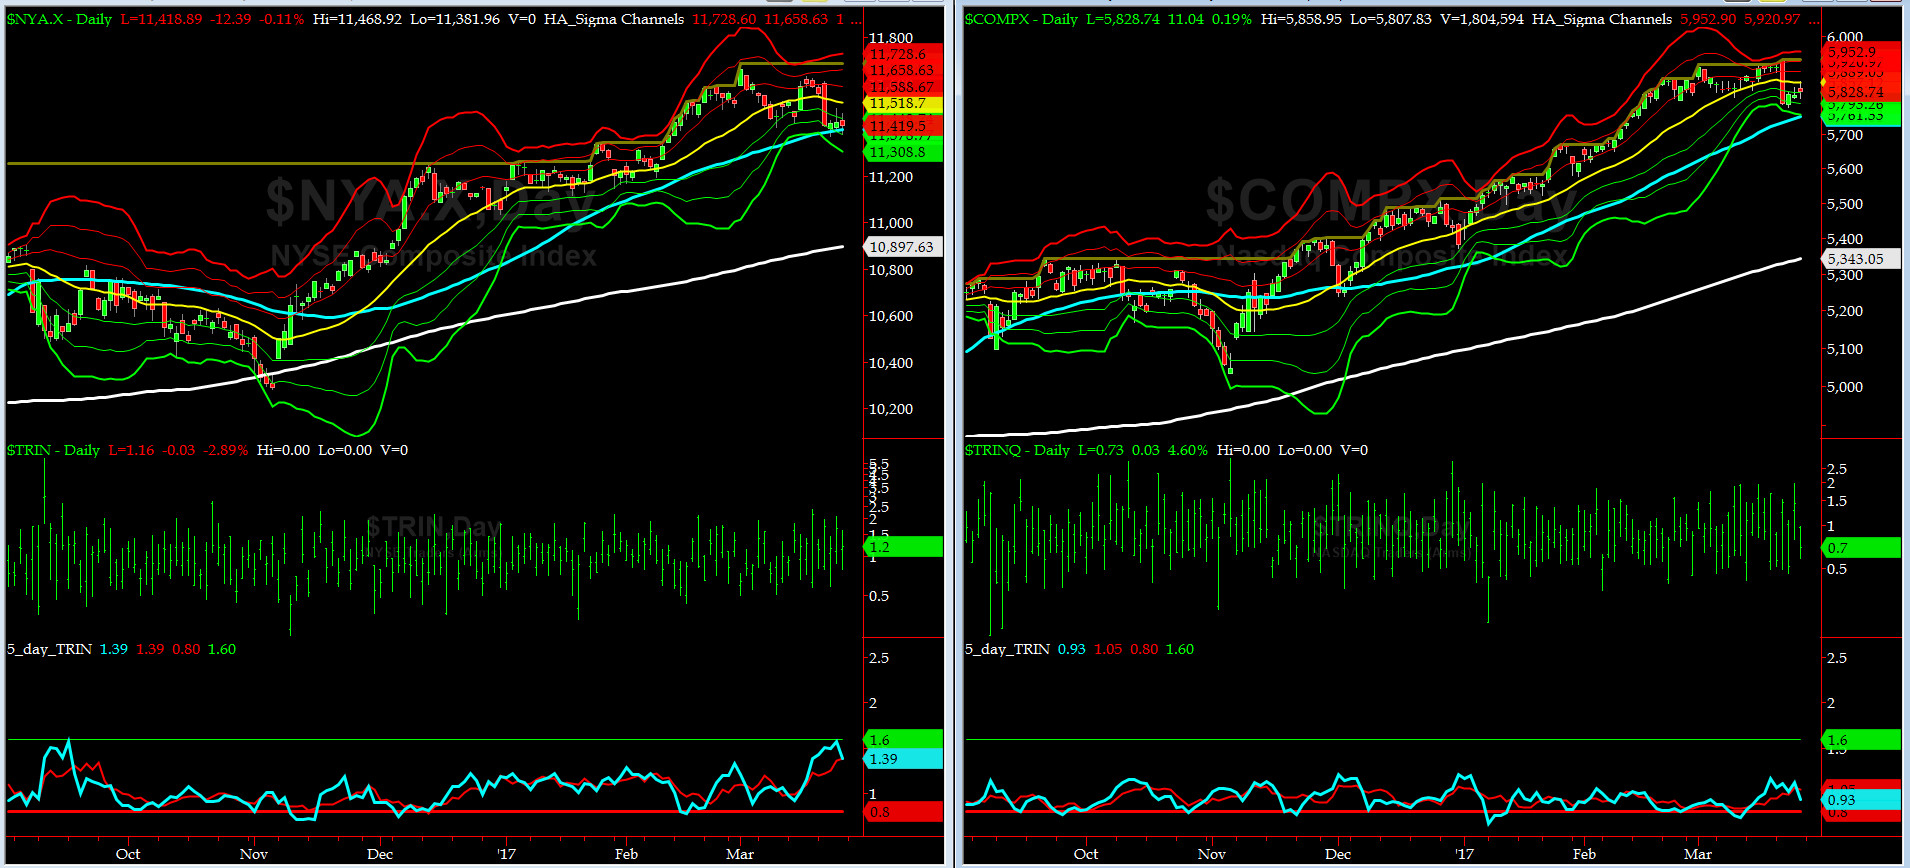
5-day TRIN & TRINQ Charts
NYSE 5-day TRIN gave a BUY Signal last Thursday while NASDAQ 5-day TRIN is NEUTRAL but leaning to a SELL signal.
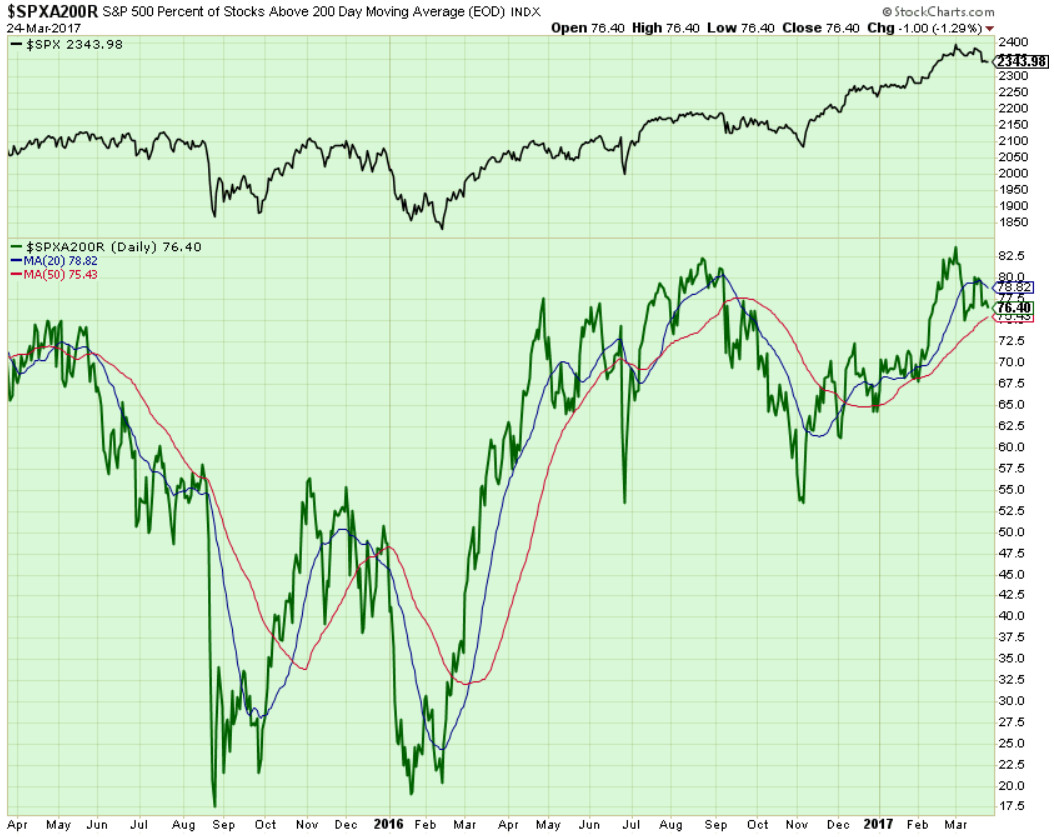
Components of SPX above their respective 200day MA Chart
This scoring indicator dropped to 76% after failing at its 20day MA (79% area). NO DIVERGENCE with SPX here means no signal here.

SPX SKEW (Tail Risk) Chart
Last two weeks we kept alarming everyone in the chatrooms and on Twitter that SPX SKEW (Tail Risk) was rising. As matter of fact, on Friday March 17 (St. Patty's Day), it printed a new ATH of 154.34 (normal = 120-125, range 100-150). Well, you saw what happened on Spring Equinox +1 (last Tuesday).
All quiet again on the Eastern & Mid-Western Fronts? We don't think so, not with Grumpie way over his head when comes to details and facts.....

3-month VIX Futures Spread(VX) Chart
Our VX Spread (LONG APR SHORT JUL) behaved pretty docile this past week, closing at -2.95 near its hourly +3 sigma on Friday.
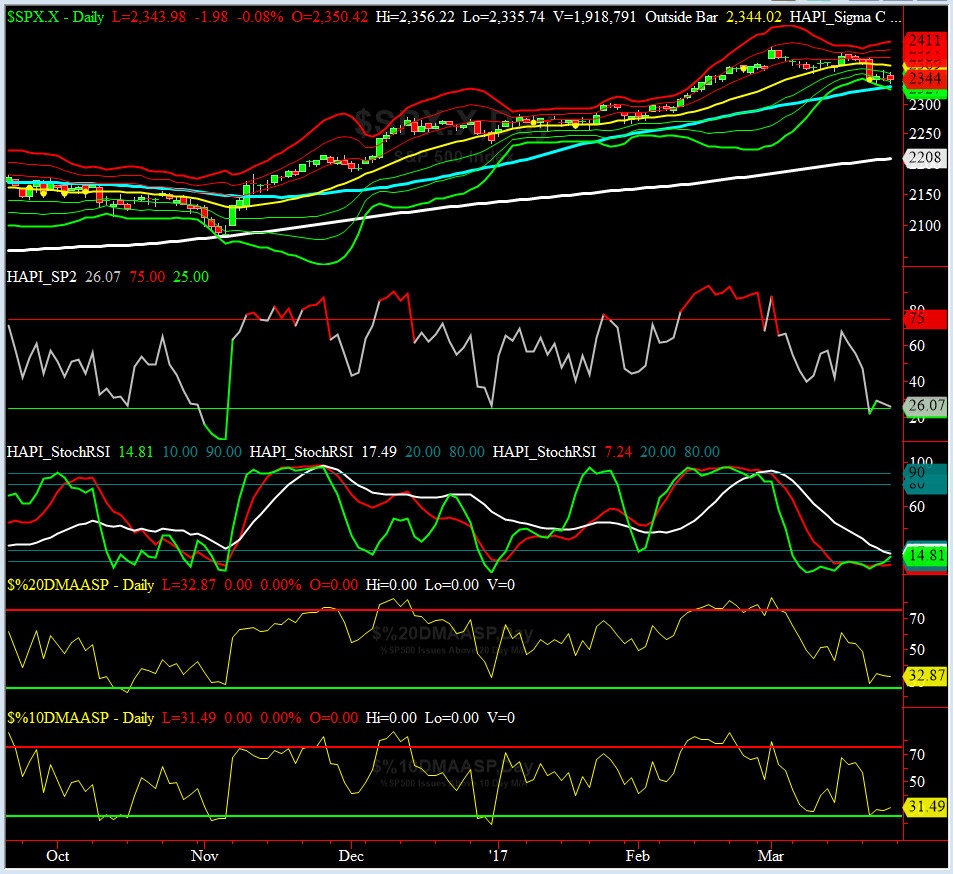
HA_SP2 Chart
HA_SP2 = 26 (Buy signal <= 25, Sell Signal >= 75)
The 2nd mouse is now stalking SP2.... we should a local minima this week after 25 is breached. I love this prop indicator.
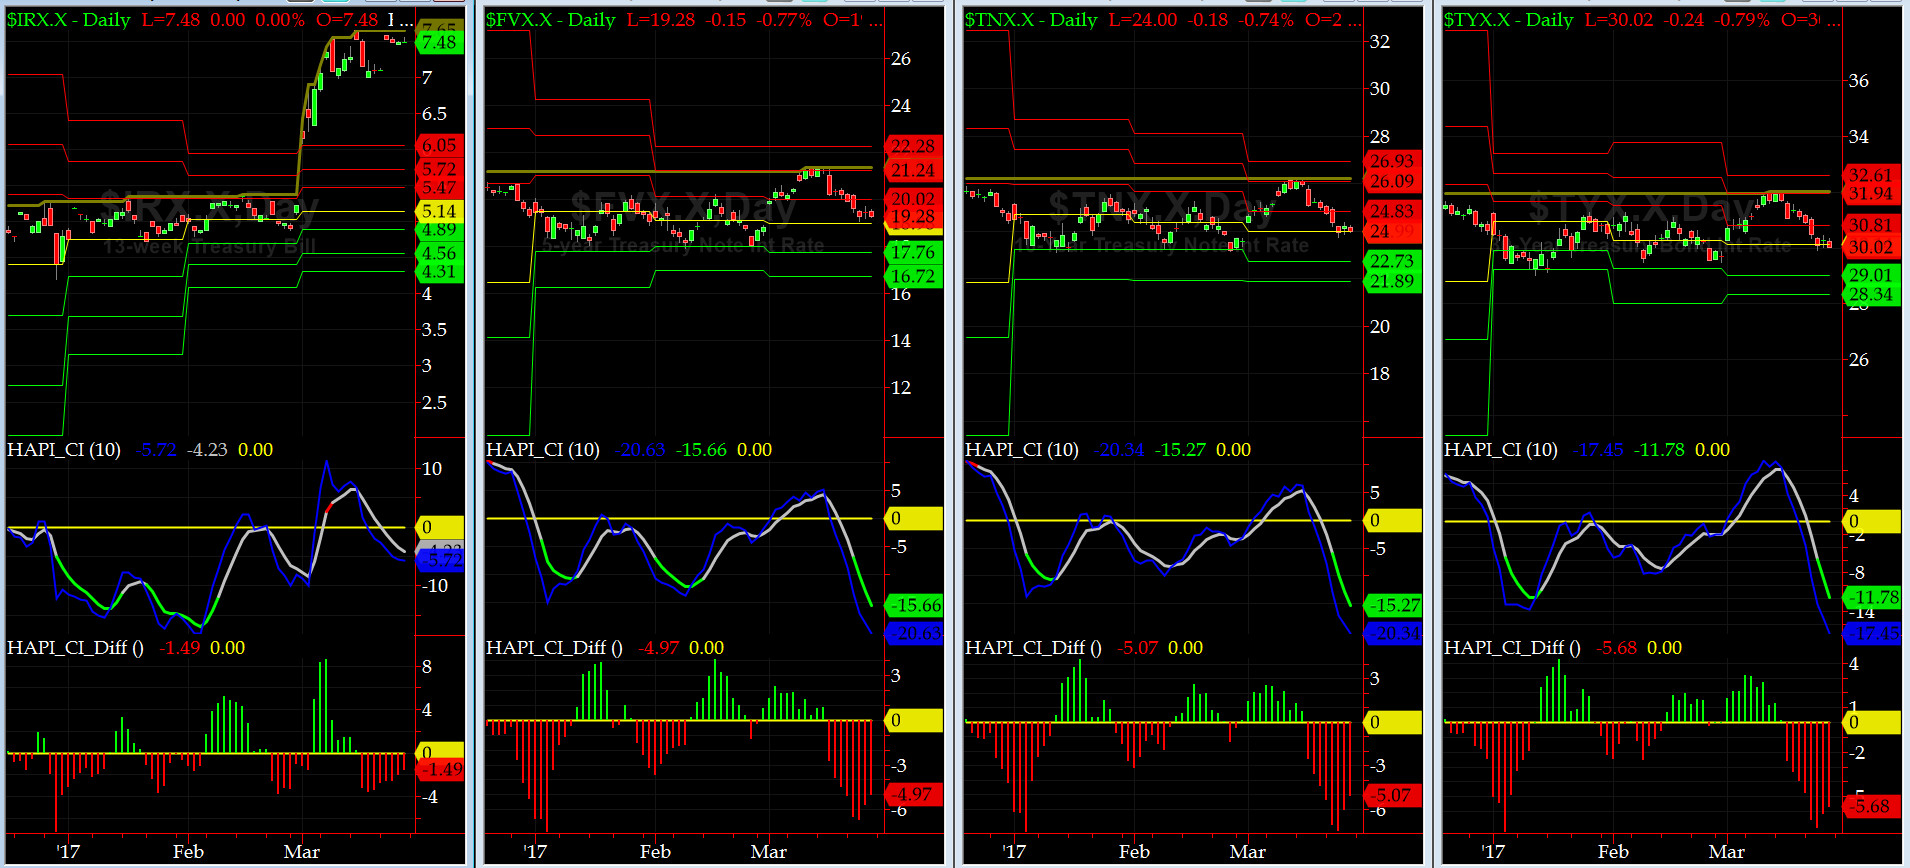
US Treasury T-Notes & T-Bonds Yields Chart
HOUSTON, the lift-off of the Yield Curve fizzled, specially the long end pulled back to its Monthly Pivots......
Fari Hamzei
|


 Proactive Market Timing


