
|
 |
 |
 |
 |
 |
 |
 |
 |
 Proactive Market Timing Proactive Market Timing
|
|
|
Most Recent PMT vs SPX Performance Chart

|
|
|
|
Wednesday, April 5, 2017, 1930ET
Link for Tonight's Market Timing Webinar #55
Click here to Play
Thanks for attending,
Fari Hamzei
|
|
|
|
|
|
Wednesday, April 5, 2017, 0911ET
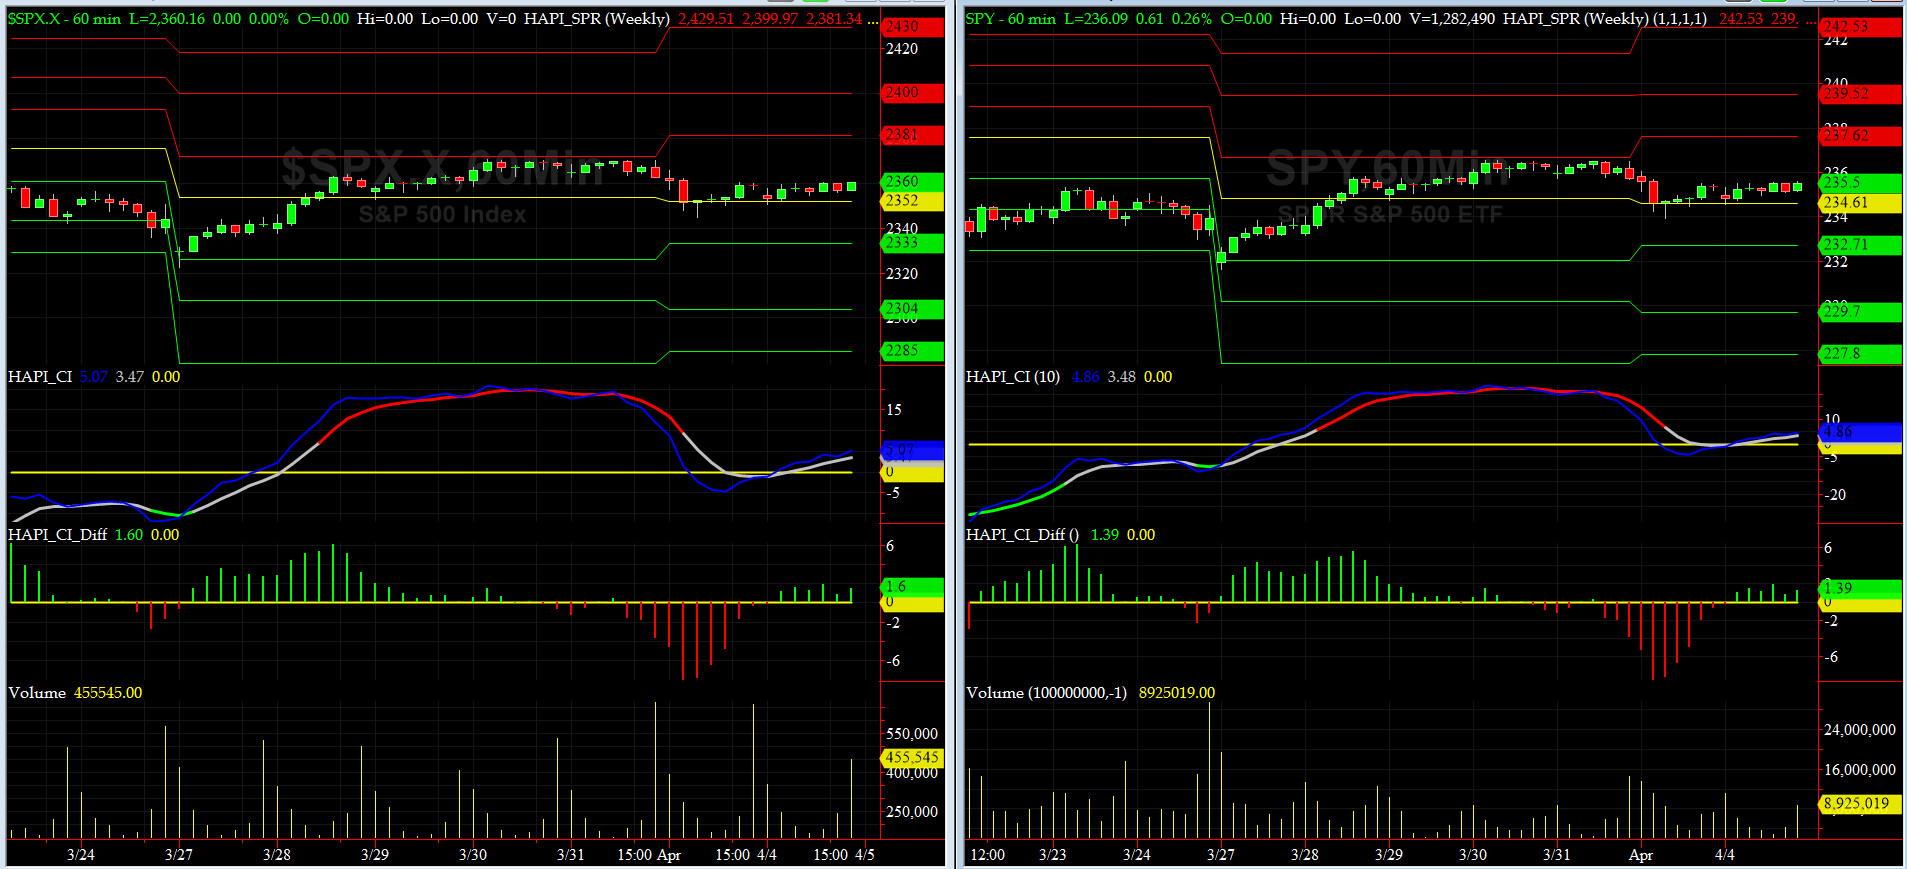
Companion Chart for Market Bias Review, Issue #186
|
|
|
|
|
|
Wednesday, April 5, 2017, 0850ET
UPDATED Market Bias for Issue #186
Our current Market Bias with Timer Digest is LONG SPX as of Tues Apr 4 at 2360.16
Our previous Market Bias was FLAT SPX as of Mar 31 at 2362.72
Here are the trade parameters for this week:
SPX Secondary Profit Target for last 20% of our position = 2390-2395
SPX Primary Profit Target for first 80% of our position = 2380
SPX BreakEven Stop (Last Close) for last 20% of our position = 2360
SPX Money Management Stop for 100% of our position = 2345
|
| Action |
Asset |
Expiration |
Strike |
Option |
| BUY |
SPY |
04/28/17 |
236 |
Calls |
| SELL |
SPY |
04/28/17 |
241 |
Calls |
| You need to execute both legs and hold it as a Call Spread.
|
Note A:
Once the Primary Profit Target has been reached, traders are advised to close 80% of their position in order to lock in profits. The remaining balance can be carried over with a BreakEven STOP, based on the SPX level at the time of entry, in order to make the trade a zero-risk trade with the final position running to reach the Secondary Profit Target.
Once either Secondary Profit or Money Management (BreakEven STOP after the 80% peel-off) is hit, our Option/ETF trade for that week is over. Go to Cash and wait for the next PMT Issue.
Note B:
When we change our Market Bias with Timer Digest, You need to go FLAT asap. With PMT Pro, that is before the Close that day and with the basic PMT, at the open of the next day.
Fari Hamzei
|
|
|
|
|
|
Tuesday, April 4, 2017, 1555ET
Notice of Change of Market Bias with Timer Digest
Dear Jim,
Given current market structure (they bought the bottom yesterday with vengeance), and current political backdrop, we are going LONG SPX at the Close today.
Fari Hamzei
|
|
|
|
|
|
Sunday, April 2, 2017, 1930ET
Market Bias for Issue #186
Our current Market Bias with Timer Digest is FLAT SPX as of Fri Mar 31 at 2362.72
Our previous Market Bias was LONG SPX as of Tues Feb 21 at 2365.38
Here are the trade parameters for this week:
SPX Secondary Profit Target for last 20% of our position = N/A
SPX Primary Profit Target for first 80% of our postiion = N/A
SPX BreakEven Stop (Last Close) for last 20% of our position = N/A
SPX Money Management Stop for 100% of our position = N/A
|
| Action |
Asset |
Expiration |
Strike |
Option |
| BUY |
SPY |
--- |
-- |
-- |
| SELL |
SPY |
--- |
-- |
-- |
| We are FLAT for the time being.
|
Note A:
Once the Primary Profit Target has been reached, traders are advised to close 80% of their position in order to lock in profits. The remaining balance can be carried over with a BreakEven STOP, based on the SPX level at the time of entry, in order to make the trade a zero-risk trade with the final position running to reach the Secondary Profit Target.
Once either Secondary Profit or Money Management (BreakEven STOP after the 80% peel-off) is hit, our Option/ETF trade for that week is over. Go to Cash and wait for the next PMT Issue.
Note B:
When we change our Market Bias with Timer Digest, You need to go FLAT asap. With PMT Pro, that is before the Close that day and with the basic PMT, at the open of the next day.
Fari Hamzei
|
|
|
|
|
|
Saturday, April 1, 2017, 2300ET
Market Timing Charts, Analysis & Commentary for Issue #186
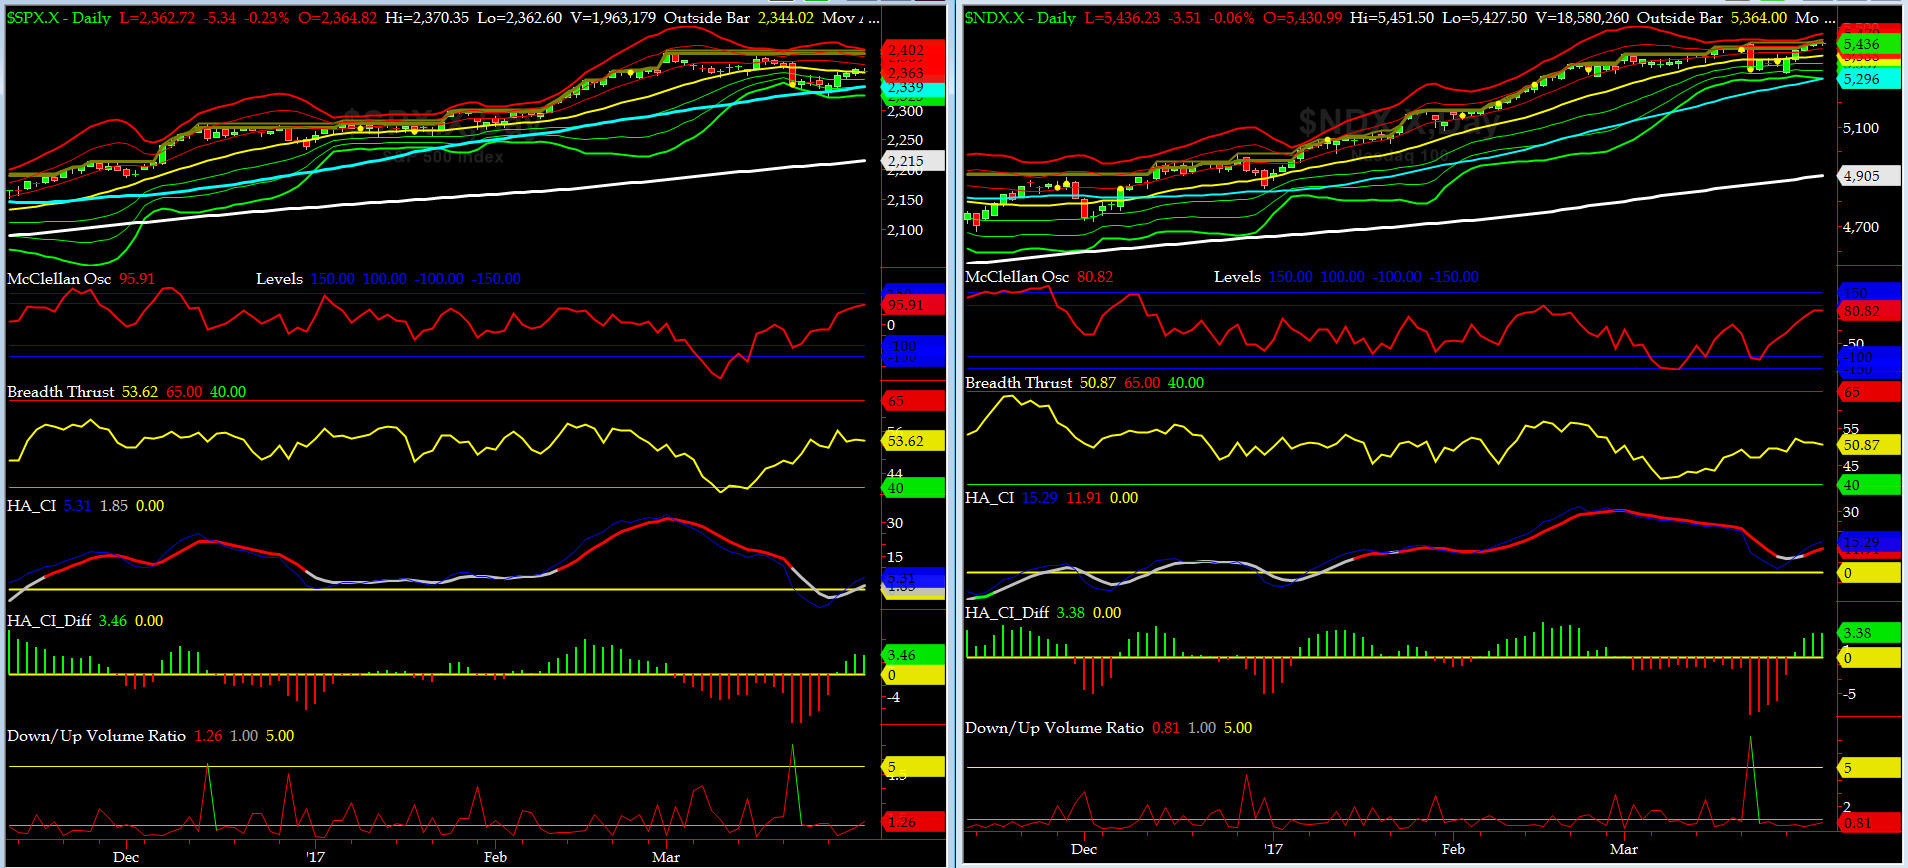
Timer Charts of S&P-500 Cash Index (SPX) + NASDAQ-100 Cash Index (NDX)
Most recent S&P-500 Cash Index (SPX): 2362.72 up +18.74 (up +0.8%) for the week ending Friday, March 31, 2017, which closed just above its zero sigma.
SPX ALL TIME INTRADAY HIGH = 2400.98 (reached on Wednesday, March 1, 2017)
SPX ALL TIME CLOSING HIGH = 2395.96 (reached on Wednesday, March 1, 2017)
Current DAILY +2 Sigma SPX = 2389 with WEEKLY +2 Sigma = 2417
Current DAILY 0 Sigma (20 day MA) SPX = 2364 with WEEKLY 0 Sigma = 2295
Current DAILY -2 Sigma SPX = 2338 with WEEKLY -2 Sigma = 2173
NYSE McClellan Oscillator = +96 (-150 is start of the O/S area; around -275 to -300 area or lower, we go into the �launch-pad� mode, over +150, we are in O/B area)
NYSE Breadth Thrust = 53.6 (40 is considered as oversold and 65 as overbought)
Well, Capt Tiko nailed it again -- Kudos -- more Tuna & more Iced Persian Tea? ubetcha. What is next? we suspect some "soft" weakness till we get to Q1 Earnings Season, which starts for us in the earnest by April 13 with JPM, WFC, DAL & C on deck.

Canaries [in the Coal Mine] Chart for DJ TRAN & RUT Indices
200-Day MA DJ TRAN = 8509 or 7.1% below DJ TRAN (max observed in last 5 yrs = 20.2%, min = -20.3%)
200-Day MA RUT = 1284 or 7.8% below RUT (max observed in last 5 yrs = 21.3%, min = -22.6%)
DJ Transports (proxy for economic conditions 6 to 9 months hence) throttled up to its zero sigma but could not get to its 50day MA.
Russell 2000 small caps (proxy for Risk ON/OFF) also took off and got past its 50day MA. RISK came back hard and still remains ON.
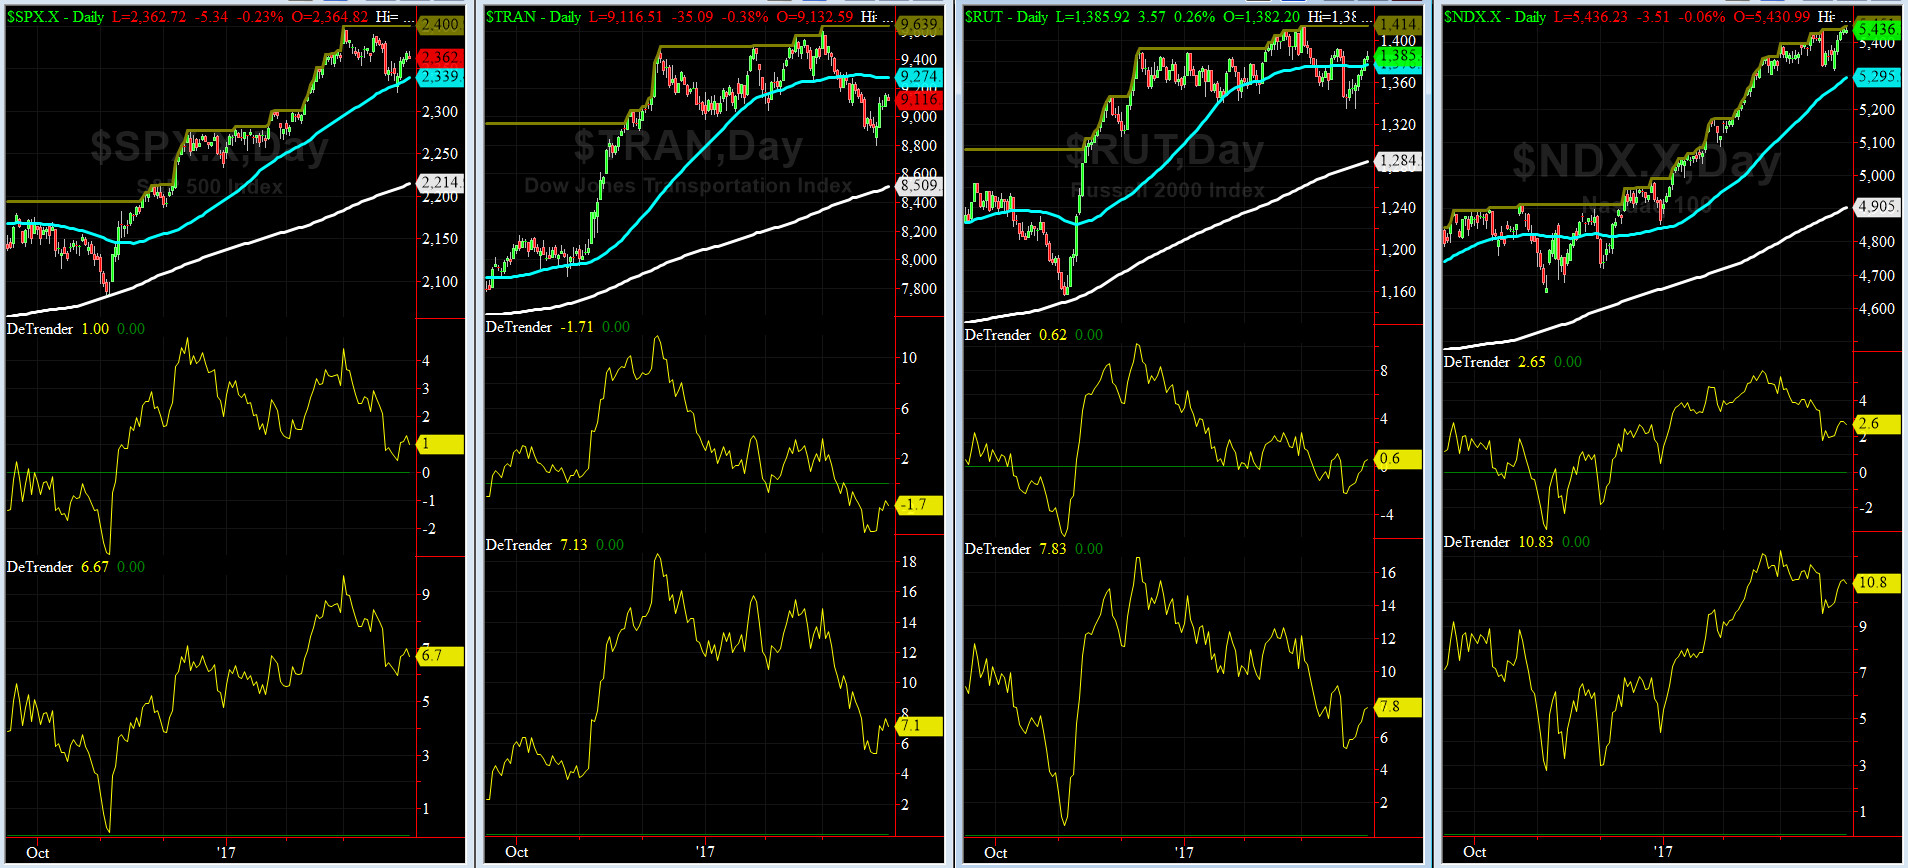
DeTrenders Charts for SPX, NDX, TRAN & RUT Indices
50-Day MA SPX = 2339 or 1% below SPX (max observed in last 5 yrs = +8.6%, min = -9.3%)
200-Day MA SPX = 2214 or 6.7% below SPX (max observed in last 5 yrs = 15.2%, min = -14%)
Only one of our eight DeTrenders remains negative now. The DeTrenders for DJ Tran & RUT will continue to be harbingers of future price behavior in broad indices.
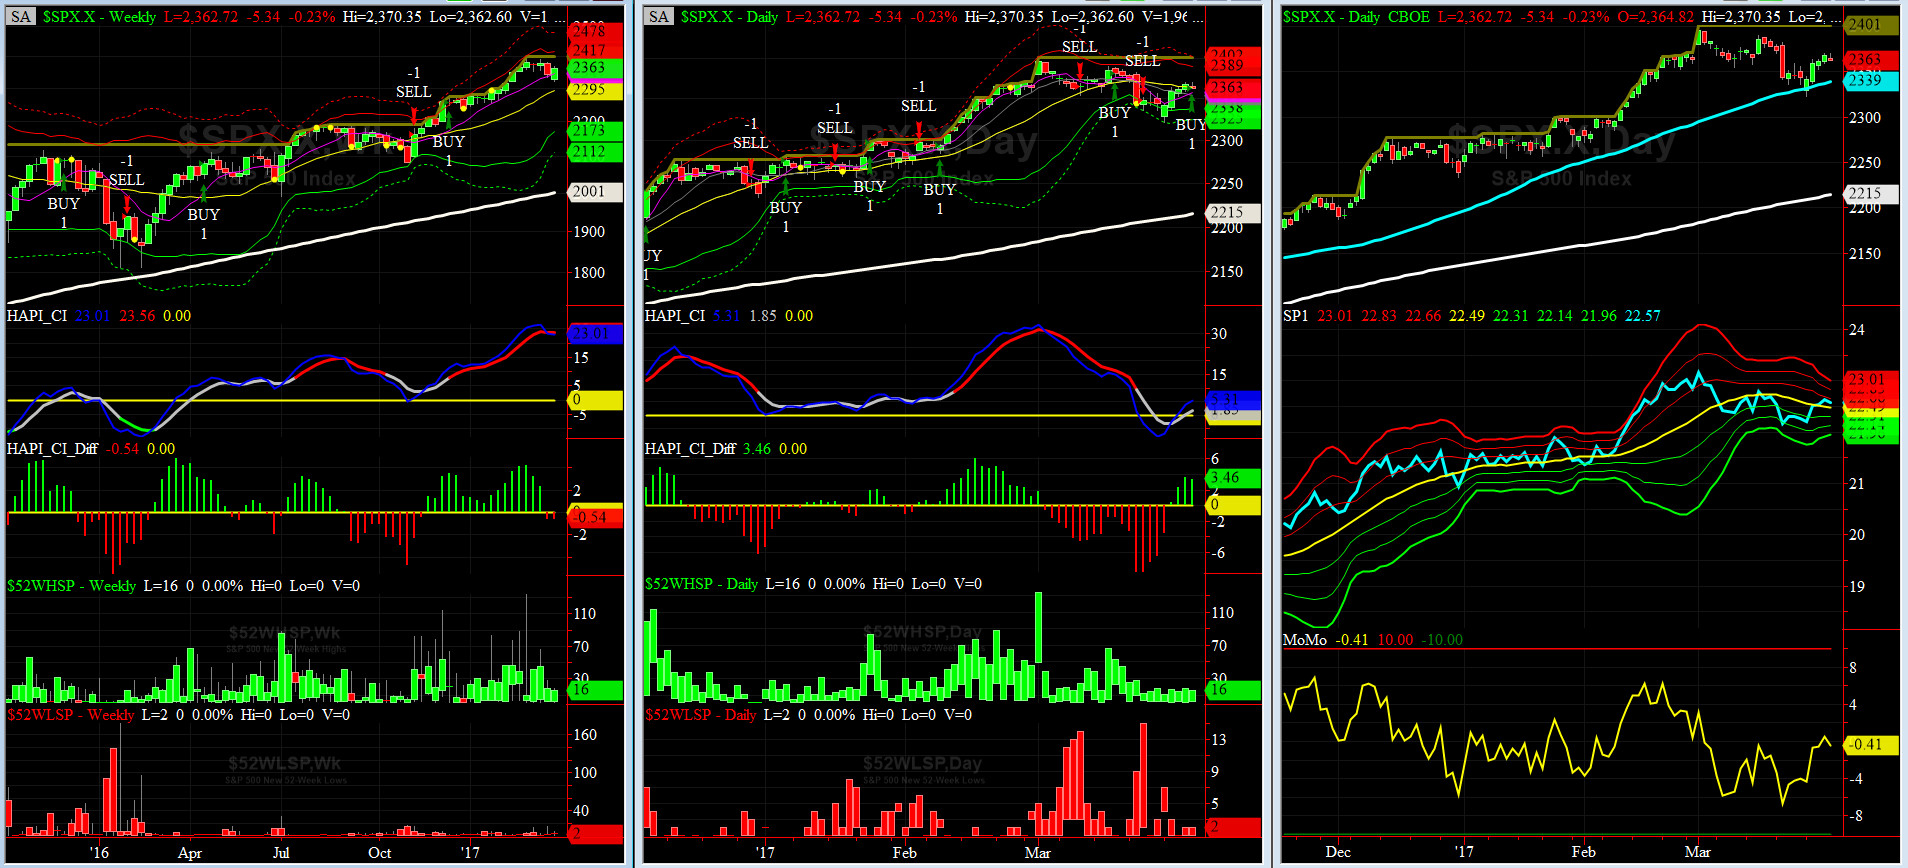
HA_SP1_Momo Chart
WEEKLY Timing Model = on a BUY Signal since Friday 12/16/16 CLOSE at 2258
DAILY Timing Model = on a BUY Signal since Friday 3/31/17 CLOSE at 2362
Max SPX 52wk-highs reading last week = 18 (over 120-140, the local maxima is in)
Max SPX 52wk-Lows reading last week = 7 (over 40-60, the local minima is in)
HA_SP1 at just above its zero sigma channels
HA_Momo = -0.4 (reversals most likely occur above +10 or below -10)
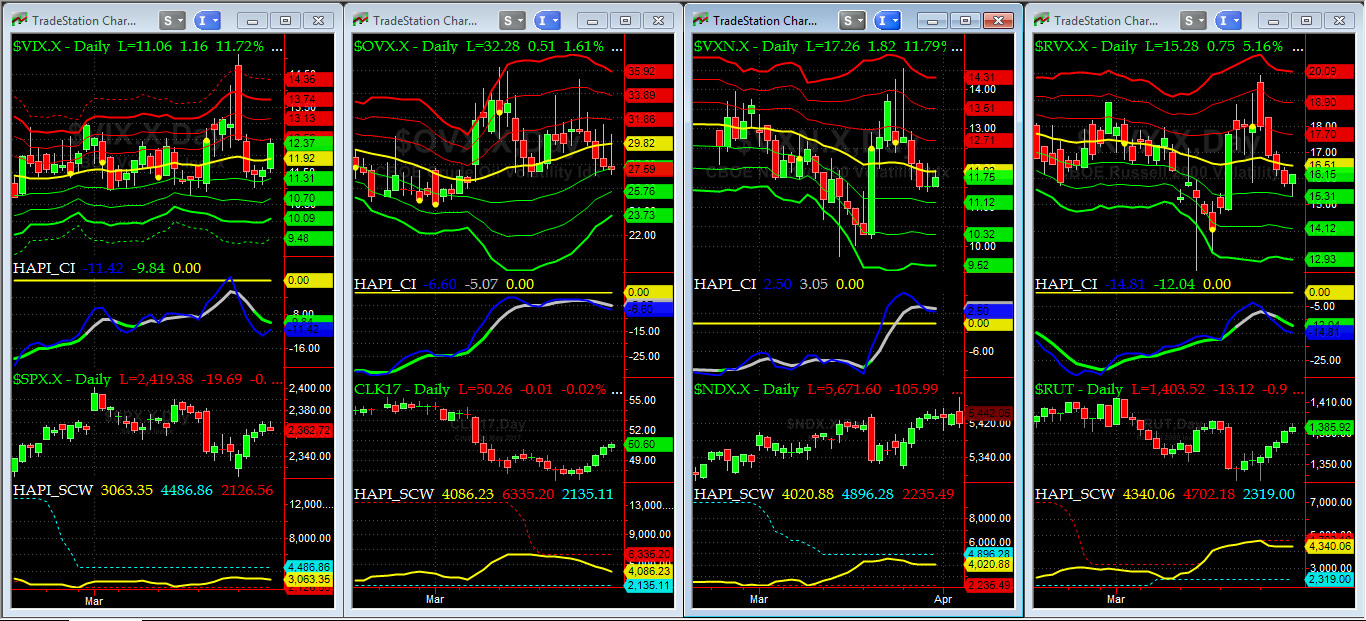
Vol of the Vols Chart
VIX is currently at its +1 sigma level at 12.37, having traded over 15 last Monday (over +4 sigma) right before Capt Tiko issued his BUY SIGNAL (remember it�s the VIX�s volatility pattern (its sigma channels) that matters, and not the level of VIX itself (this is per Dr. Robert Whaley, a great mentor and the inventor of original VIX, now called VXO). VIX usually peaks around a test of its +4 sigma).
This week, the ROMANs attacked the VIX Barracks at CBOE and made sausage out of this latest asset class we call Volatility. We only wish that Grumpie signs yet another executive order and imposes special retroactive tax on all ROMANs working within 3 mile radius of CBOE & CBOT. ROFLOL
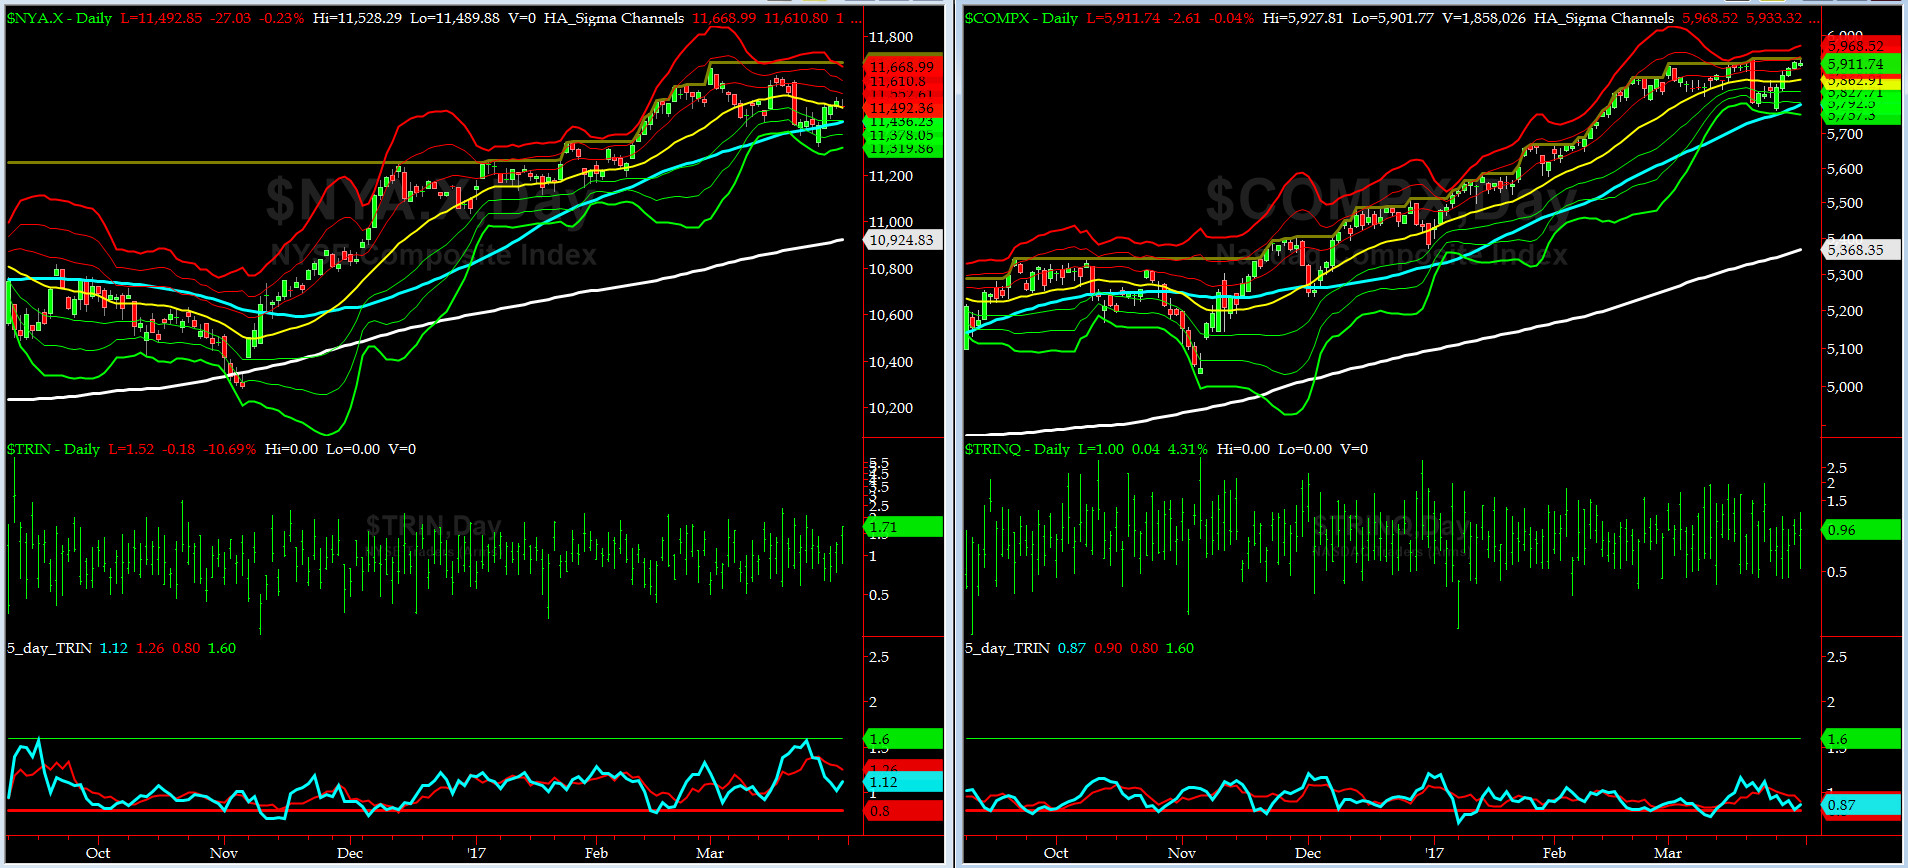
5-day TRIN & TRINQ Charts
Both 5-day TRINs are NEUTRAL here.
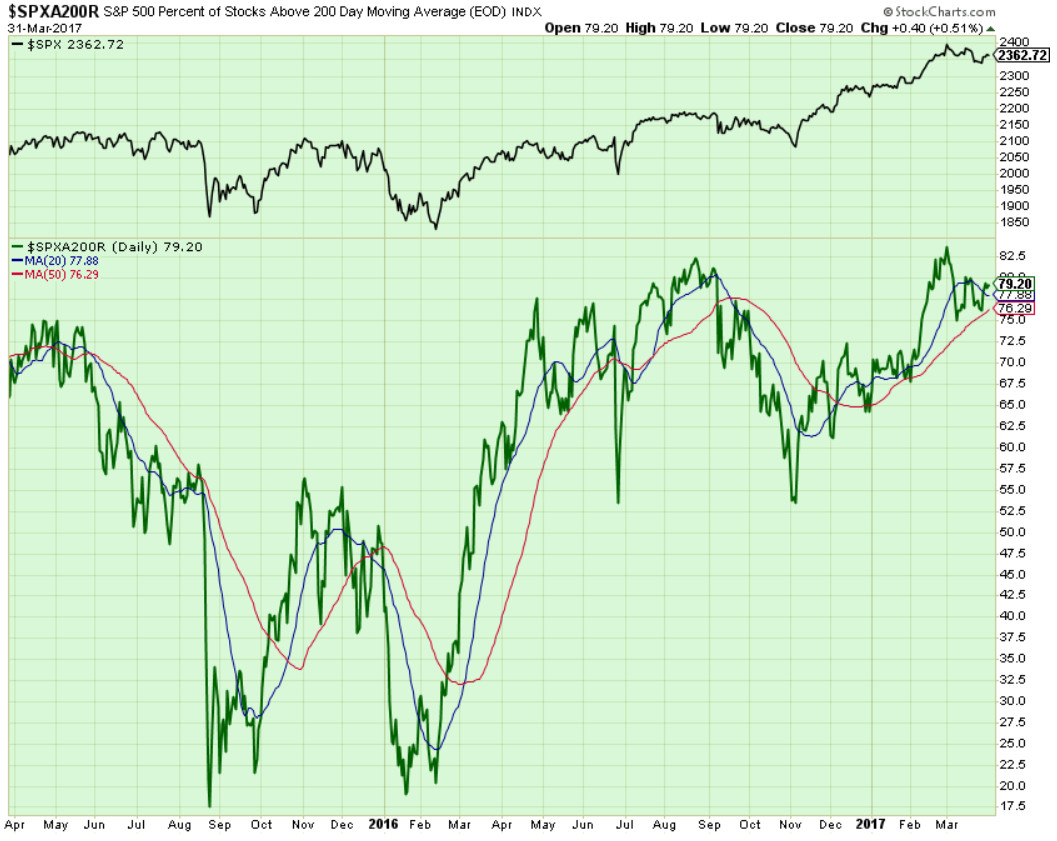
Components of SPX above their respective 200day MA Chart
This scoring indicator rose back up to 79% area but we still see NO DIVERGENCE with SPX here which means no signal here.

SPX SKEW (Tail Risk) Chart
Last week SPX SKEW (Tail Risk) came down hard and settled near its zero sigma at 138 (normal = 120-125, range 100-150).
All quiet again on the Eastern & Mid-Western Fronts? We don't think so, not with Grumpie way over his head when it comes to details and facts.....
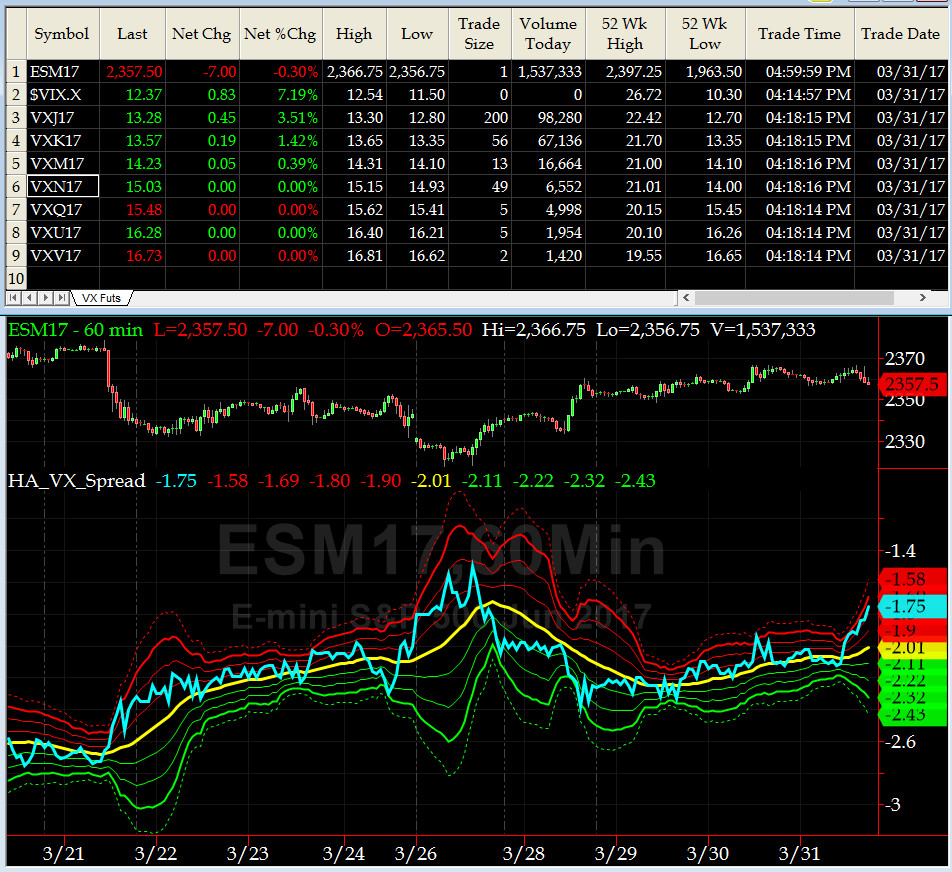
3-month VIX Futures Spread(VX) Chart
Our VX Spread (LONG APR SHORT JUL) moved rather abruptly this past week, closing at -1.75 near its hourly +2 sigma on Friday. Early on Friday, this movement of this spread puzzled us (as it moved in tandem and not against the move in ESM17 which should have been the correct correlation)
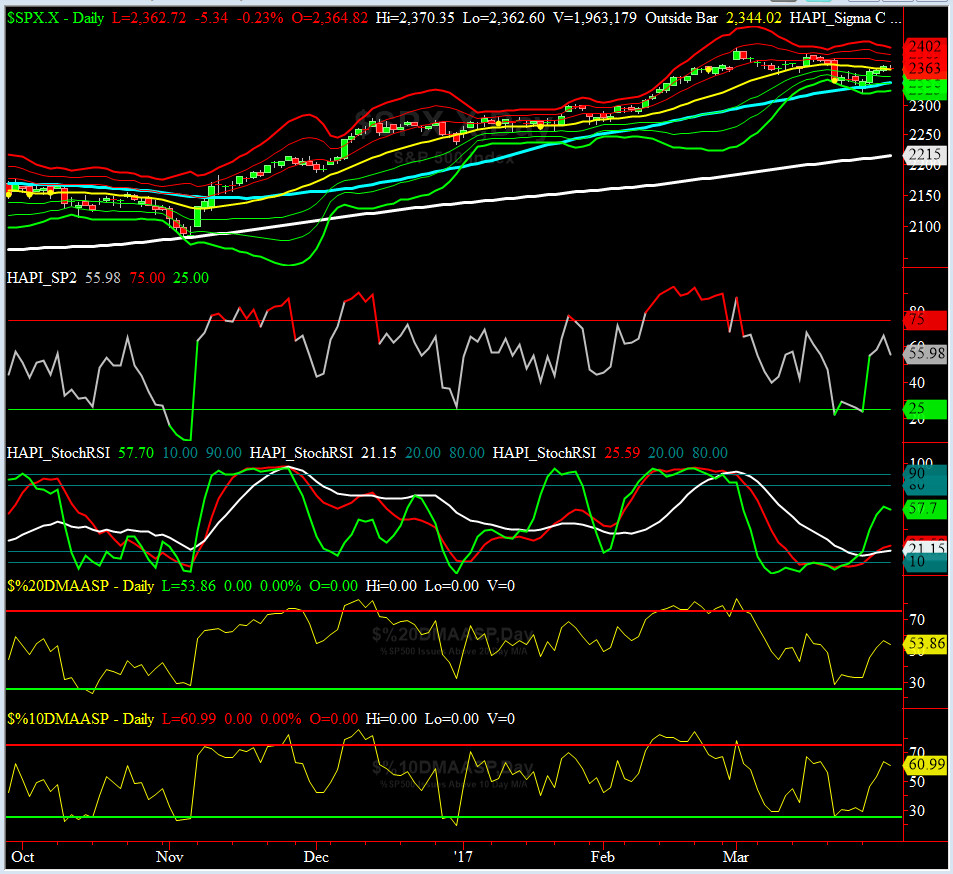
HA_SP2 Chart
HA_SP2 = 56 (Buy signal <= 25, Sell Signal >= 75)
We can only think of simply 2 words here: BRAVO SP2... you made us very proud this week.
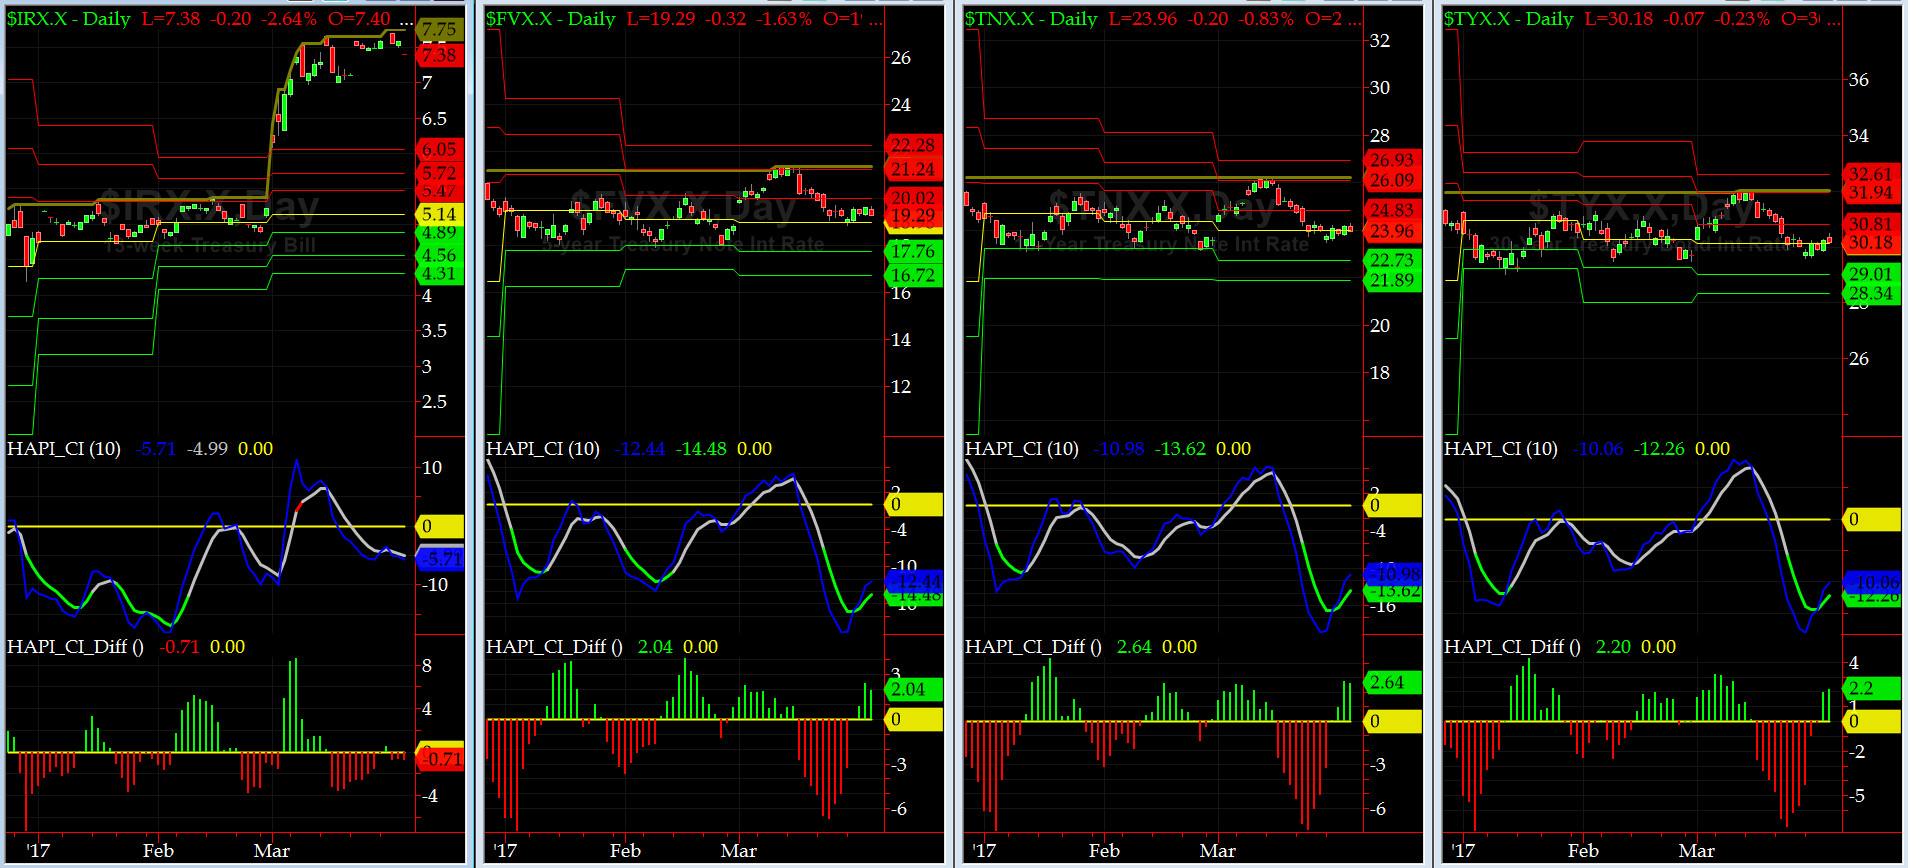
US Treasury T-Notes & T-Bonds Yields Chart
YTMs hardly moved this week....indeed, it was another uber boring week in the Debt Markets.
Fari Hamzei
|
|
|
|
|
|
Saturday, April 1, 2017, 1120ET
Notice of Change of Market Bias with Timer Digest
We are going FLAT per our PMT comments yesterday before the Close.
For our Options package we have bought some May Puts on SPY. We feel there is somewhat of an �event risk,� but not big in magnitude, with Grumpie & Co.
Fari Hamzei
|
|
|
|
|
|
Customer Care:
|
|
|
|
|
|
|
 |
 |
|
 |
|
 |
 |
 |
HA YouTube Channel ::: HA Blog ::: Testimonials ::: Tutorials & FAQs ::: Privacy Policy
|
Trading Derivatives (Options & Futures) contains substantial risk and is not for every investor. An investor could potentially lose all or more than his/her initial investment.
Only risk capital should be used for trading and only those with sufficient risk capital should consider trading derivatives. Past performance is not
necessarily indicative of future results. Testimonials appearing on this website may not be representative of other clients or customers
and are not a guarantee of future performance or success.
|
| (c) 1998-2025, Hamzei Analytics, LLC.® All Rights Reserved. |
|
|