|
Saturday, April 8, 2017, 0830ET
Market Timing Charts, Analysis & Commentary for Issue #187
Timer Charts of S&P-500 Cash Index (SPX) + NASDAQ-100 Cash Index (NDX)
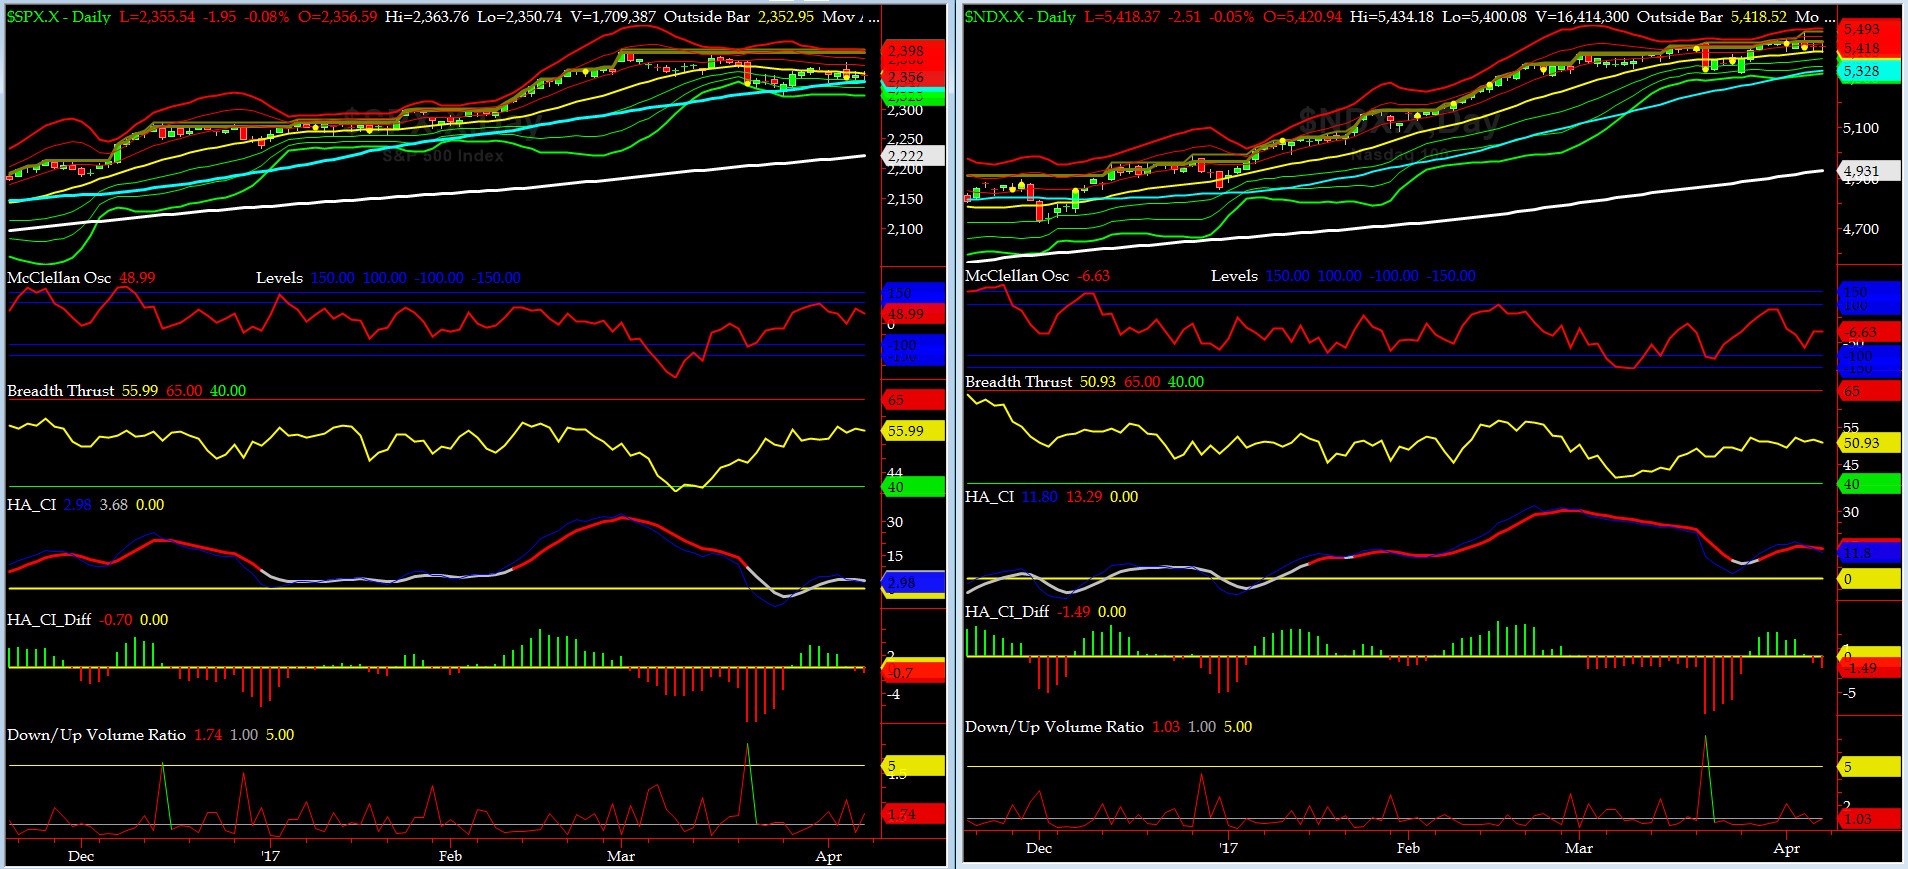
Most recent S&P-500 Cash Index (SPX): 2355.54 down -7.18 (down -0.3%) for the week ending Friday, April 7, 2017, which closed just about its zero sigma.
SPX ALL TIME INTRADAY HIGH = 2400.98 (reached on Wednesday, March 1, 2017)
SPX ALL TIME CLOSING HIGH = 2395.96 (reached on Wednesday, March 1, 2017)
Current DAILY +2 Sigma SPX = 2386 with WEEKLY +2 Sigma = 2417
Current DAILY 0 Sigma (20 day MA) SPX = 2361 with WEEKLY 0 Sigma = 2304
Current DAILY -2 Sigma SPX = 2336 with WEEKLY -2 Sigma = 2190
NYSE McClellan Oscillator = +49 (-150 is start of the O/S area; around -275 to -300 area or lower, we go into the �launch-pad� mode, over +150, we are in O/B area)
NYSE Breadth Thrust = 56 (40 is considered as oversold and 65 as overbought)
Well, Capt Tiko is still wondering which was worse for our markets? Dr Yellen & Co internal debate as reported in the Minutes of the most recent FOMC Meeting or $85 Mil Grumpie spent Thursday night by giving EXECUTE Order to launch 60 TLAMs into Shyrat Airbase in western Syria, or, the very soft March NFP with sizable downward revisions to JAN & FEB payroll data.
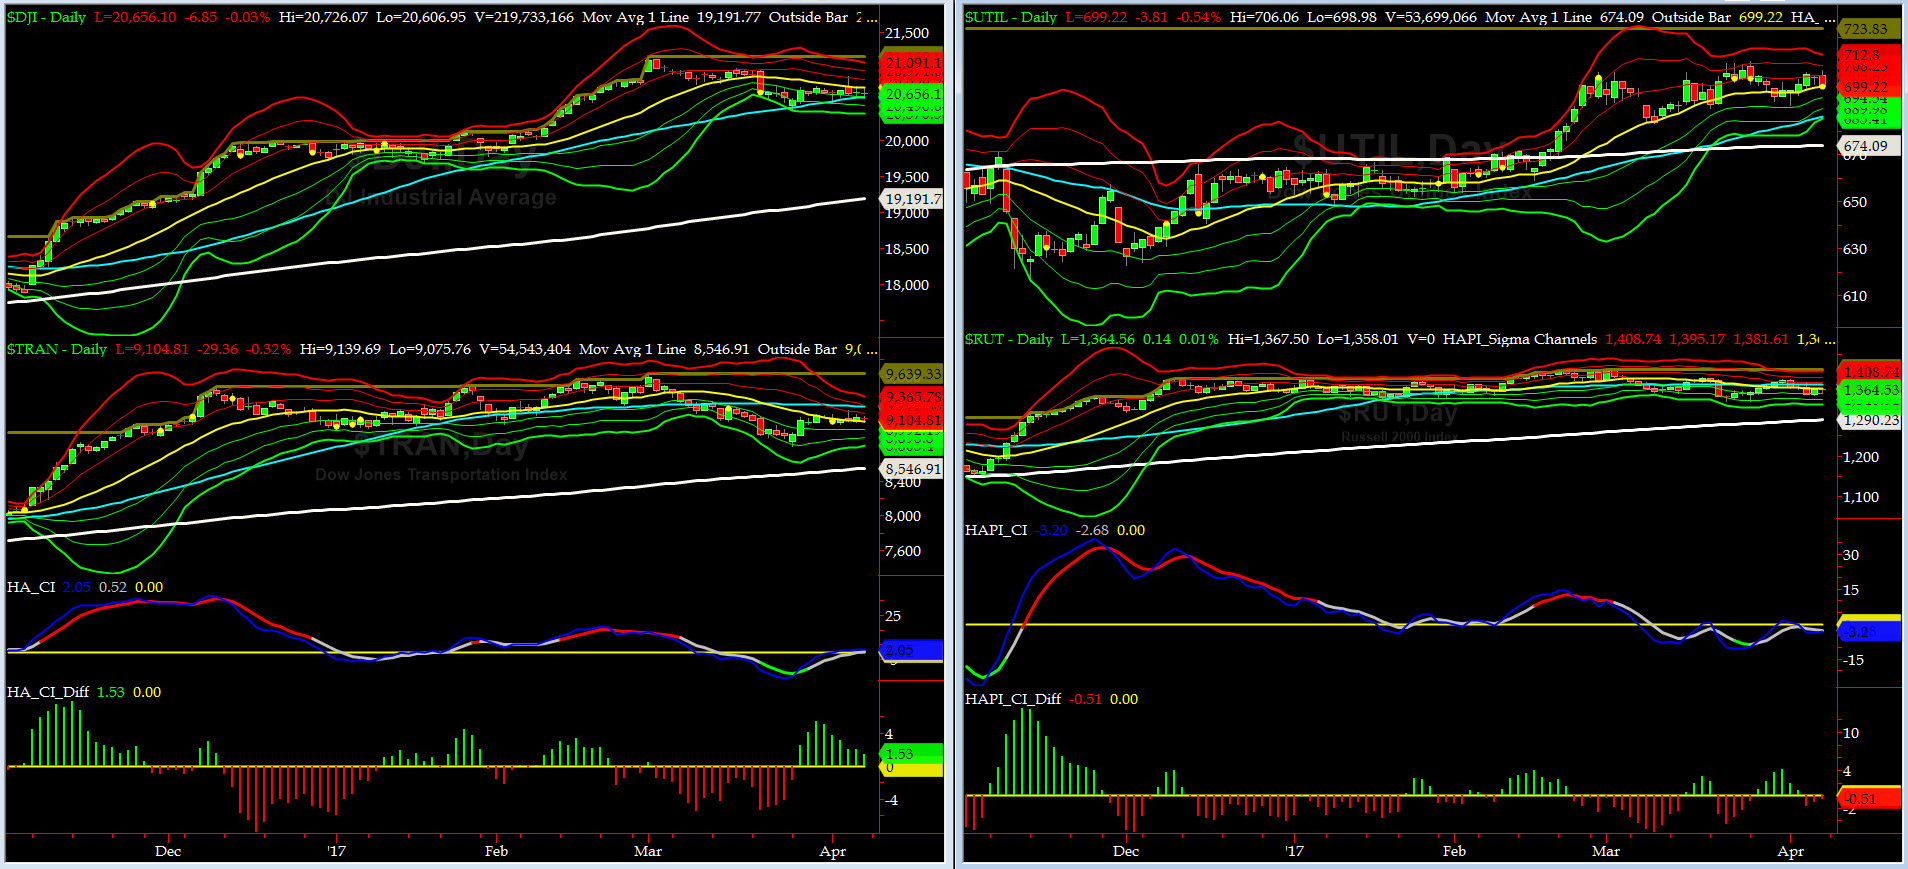
Canaries [in the Coal Mine] Chart for DJ TRAN & RUT Indices
200-Day MA DJ TRAN = 8546 or 6.5% below DJ TRAN (max observed in last 5 yrs = 20.2%, min = -20.3%)
200-Day MA RUT = 1290 or 5.8% below RUT (max observed in last 5 yrs = 21.3%, min = -22.6%)
DJ Transports (proxy for economic conditions 6 to 9 months hence) made our ROMAN Legion very happy. We could smell the sausage making all the way down here in Naples ROFLOL.
In contrast, Russell 2000 small caps (proxy for Risk ON/OFF) had a mild setback, as it sold off moderately to below its 50day MA. RISK still remains ON.
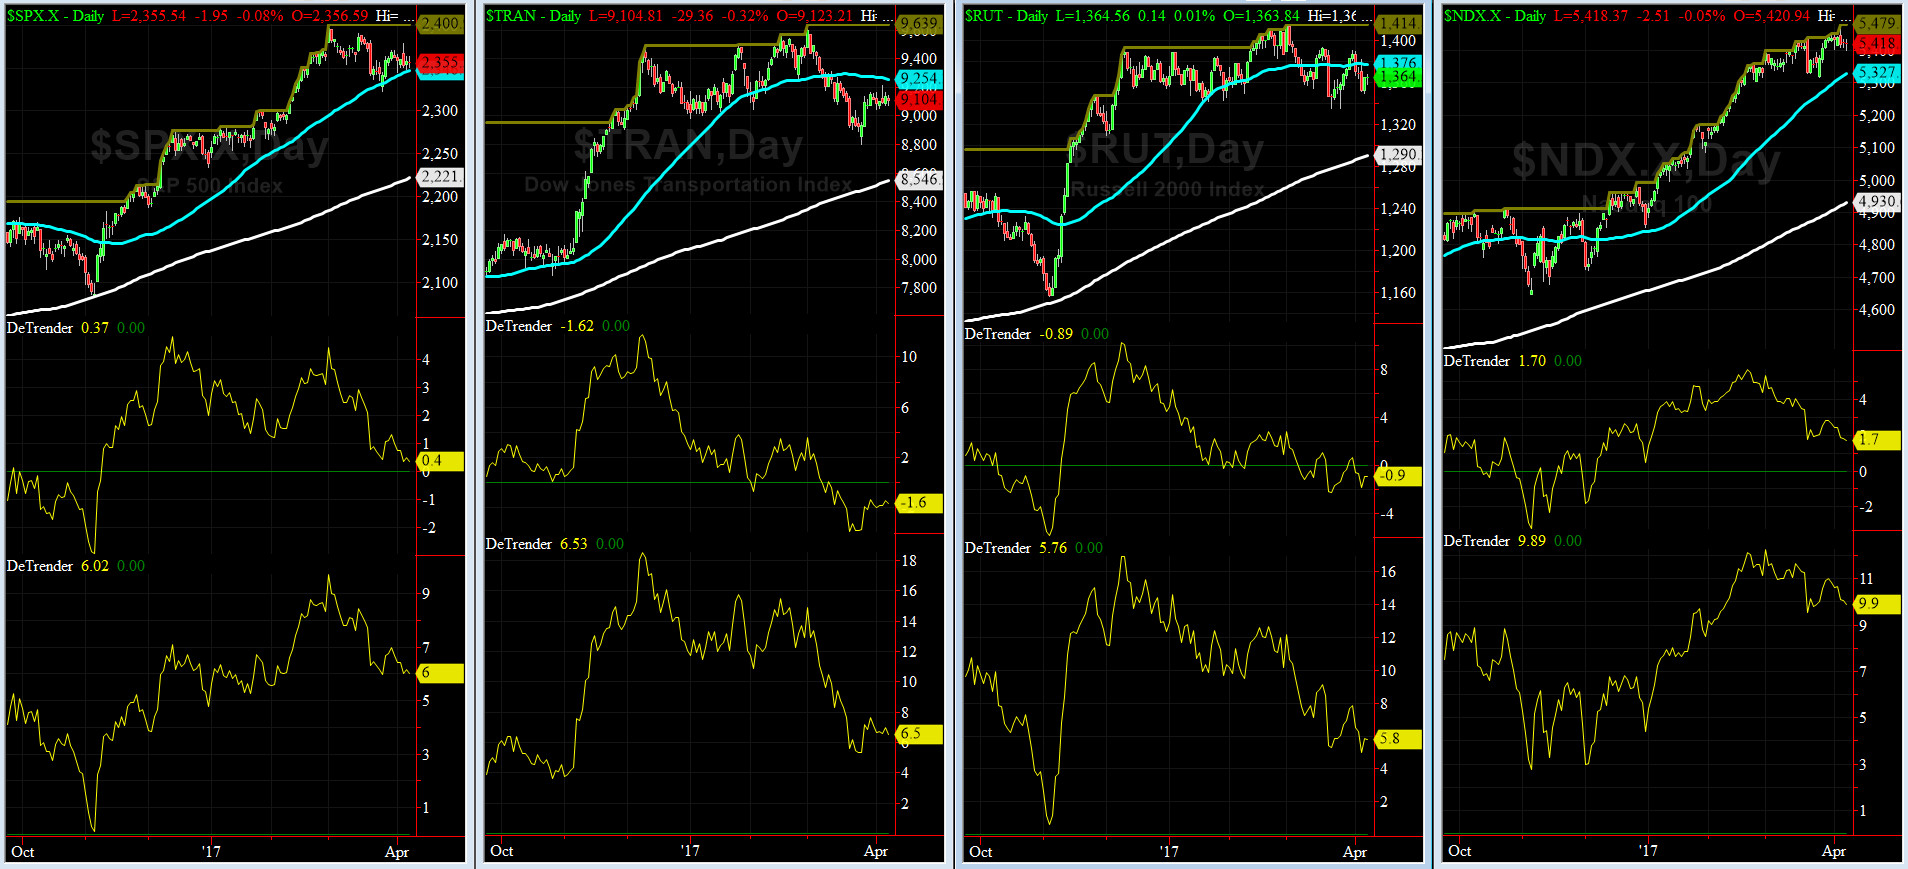
DeTrenders Charts for SPX, NDX, TRAN & RUT Indices
50-Day MA SPX = 2346 or 0.4% below SPX (max observed in last 5 yrs = +8.6%, min = -9.3%)
200-Day MA SPX = 2221 or 6% below SPX (max observed in last 5 yrs = 15.2%, min = -14%)
Only two of our eight DeTrenders still remain negative. The DeTrenders for DJ Tran & RUT will continue to be harbingers of future price behavior in broad indices.
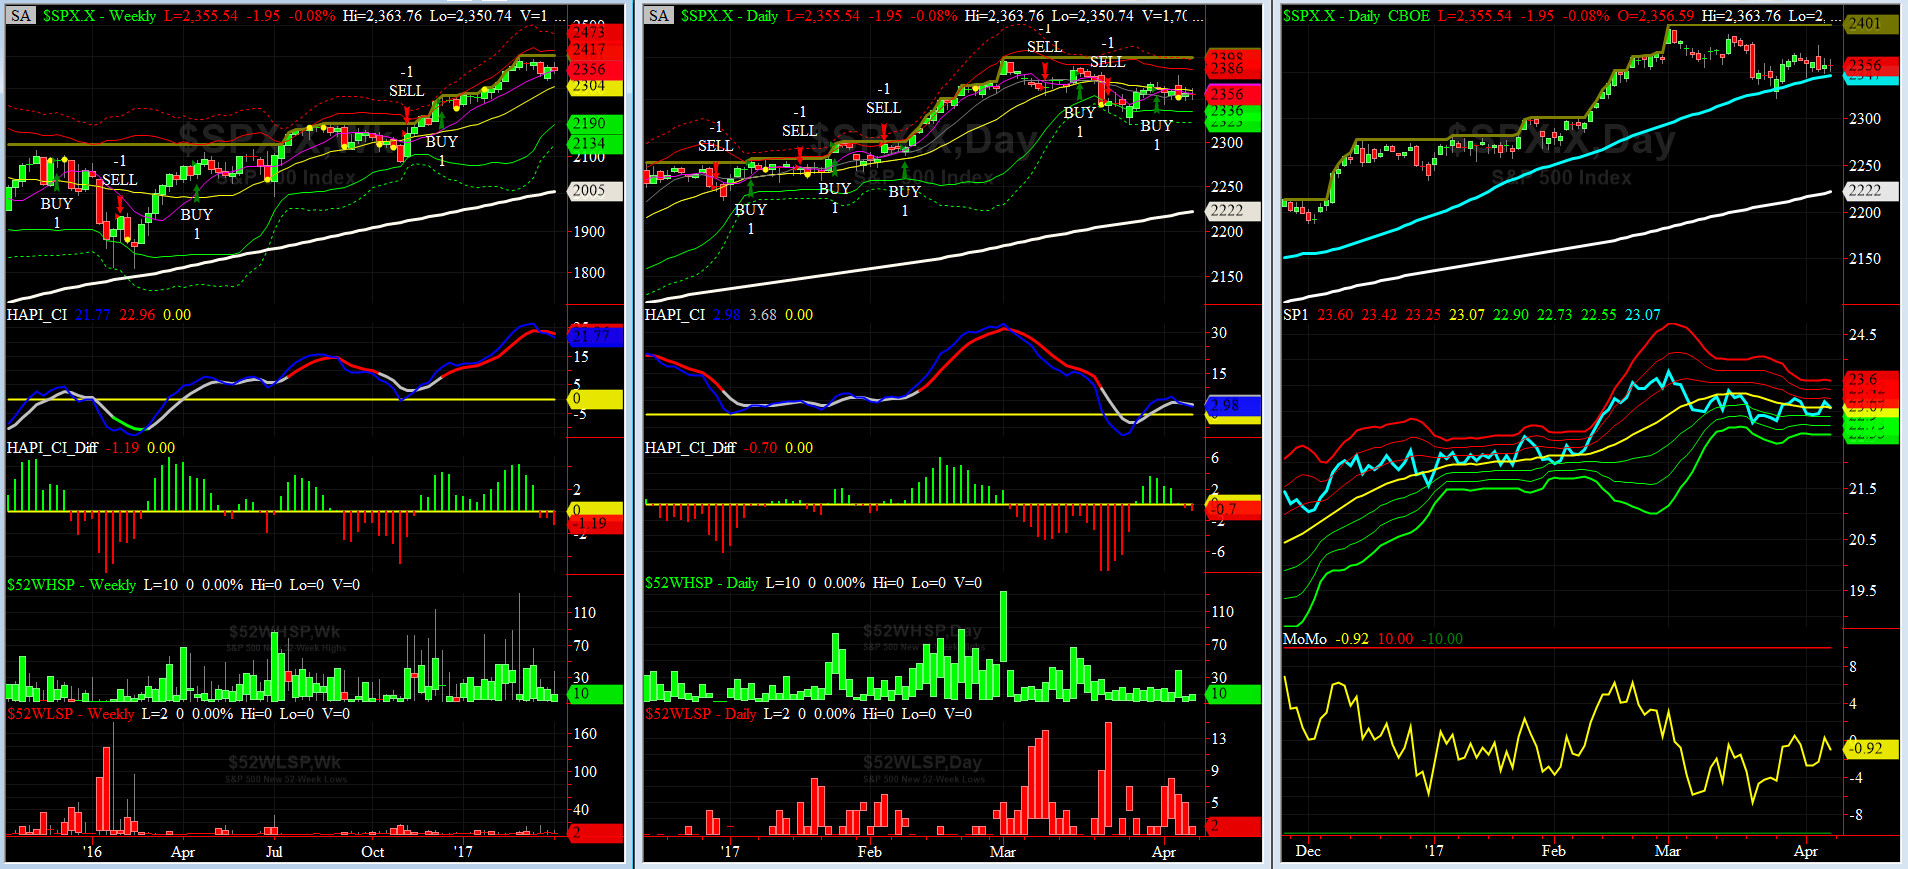
HA_SP1_Momo Chart
WEEKLY Timing Model = on a BUY Signal since Friday 12/16/16 CLOSE at 2258
DAILY Timing Model = on a BUY Signal since Friday 3/31/17 CLOSE at 2362
Max SPX 52wk-highs reading last week = 38 (over 120-140, the local maxima is in)
Max SPX 52wk-Lows reading last week = 8 (over 40-60, the local minima is in)
HA_SP1 at just above its zero sigma channels
HA_Momo = -0.9 (reversals most likely occur above +10 or below -10)
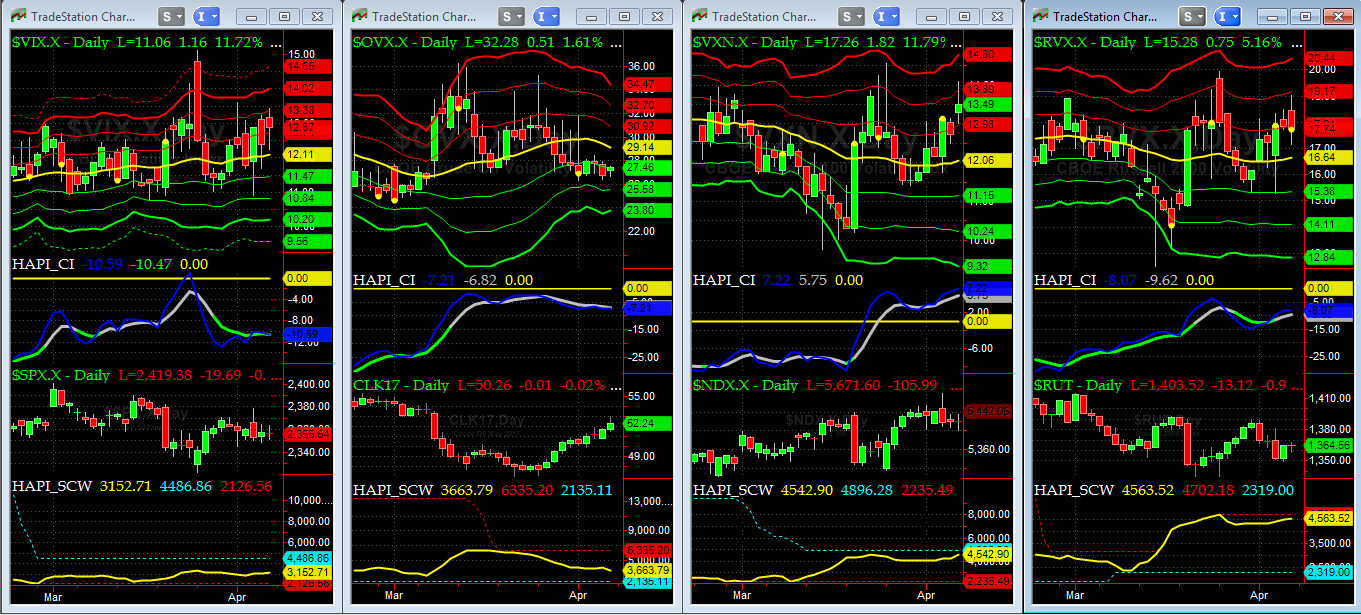
Vol of the Vols Chart
VIX is currently at its +1 sigma level at 12.37, having traded over 15 last Monday (over +4 sigma) right before Capt Tiko issued his BUY SIGNAL (remember it�s the VIX�s volatility pattern (its sigma channels) that matters, and not the level of VIX itself (this is per Dr. Robert Whaley, a great mentor and the inventor of original VIX, now called VXO). VIX usually peaks around a test of its +4 sigma).
This week we saw more VIX Sausage by the ROMANs. Wake me up at 15+.

5-day TRIN & TRINQ Charts
Both 5-day TRINs are NEUTRAL here.
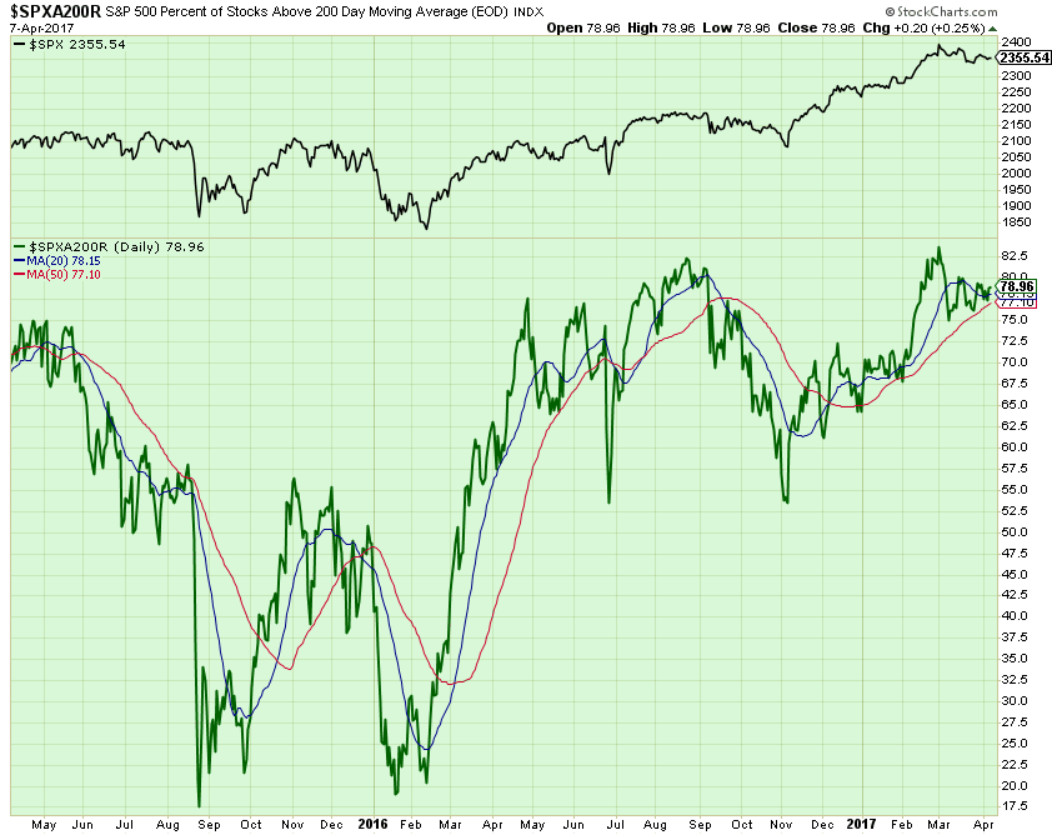
Components of SPX above their respective 200day MA Chart
This scoring indicator barely moved and it is still at 79%. NO SIGNAL HERE.

SPX SKEW (Tail Risk) Chart
Last week SPX SKEW (Tail Risk) came down further and settled near its zero sigma at 132 (normal = 120-125, range 100-150).
All is quiet again on the Eastern & Mid-Western Fronts.
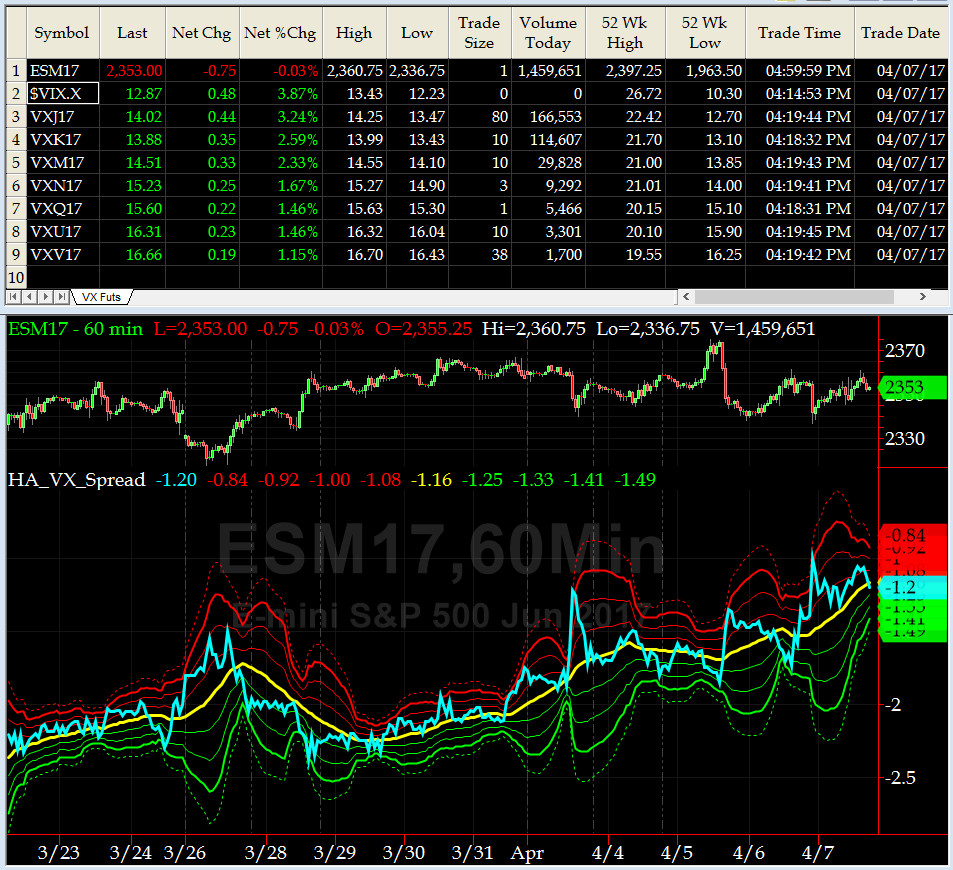
3-month VIX Futures Spread(VX) Chart
Our VX Spread (LONG APR SHORT JUL) moved rather abruptly this past week, closing at -1.2 near its hourly zero sigma on Friday. It should be noted that correlation of this important vol benchmark vs ESM17 at times is normal and at times reversed. This is of a concern to us (may be signaling further erosion ahead). Only time will tell.
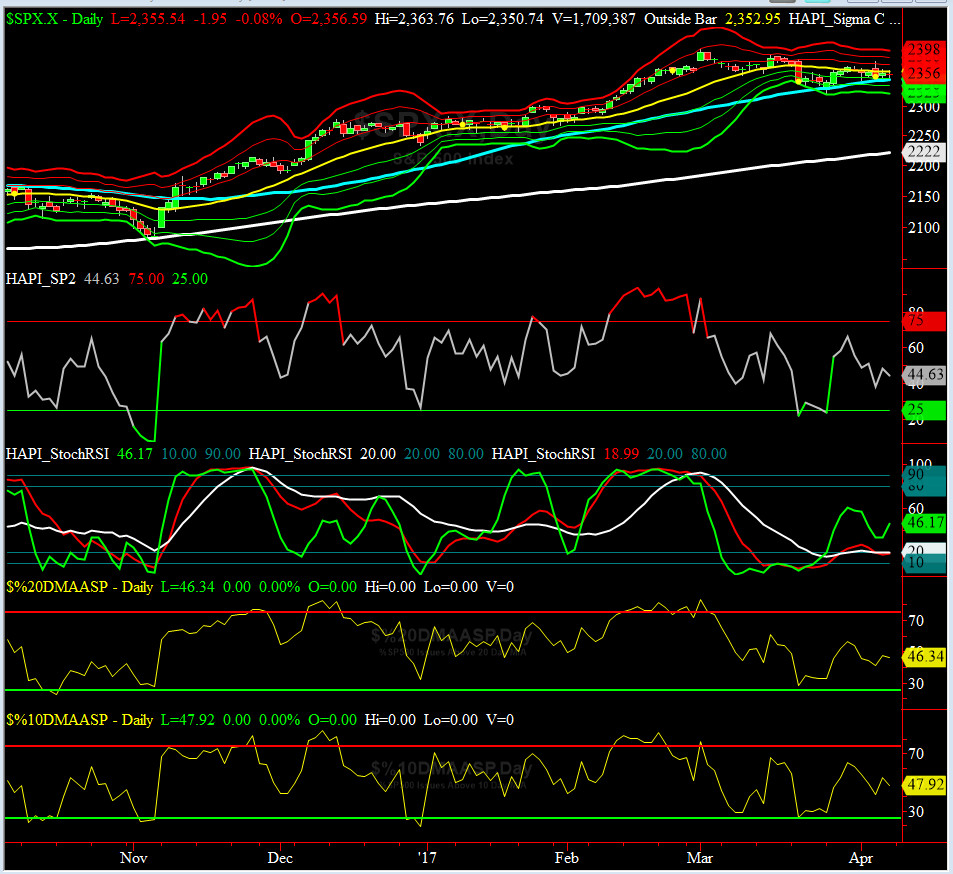
HA_SP2 Chart
HA_SP2 = 44.6 (Buy signal <= 25, Sell Signal >= 75)
No signal here....
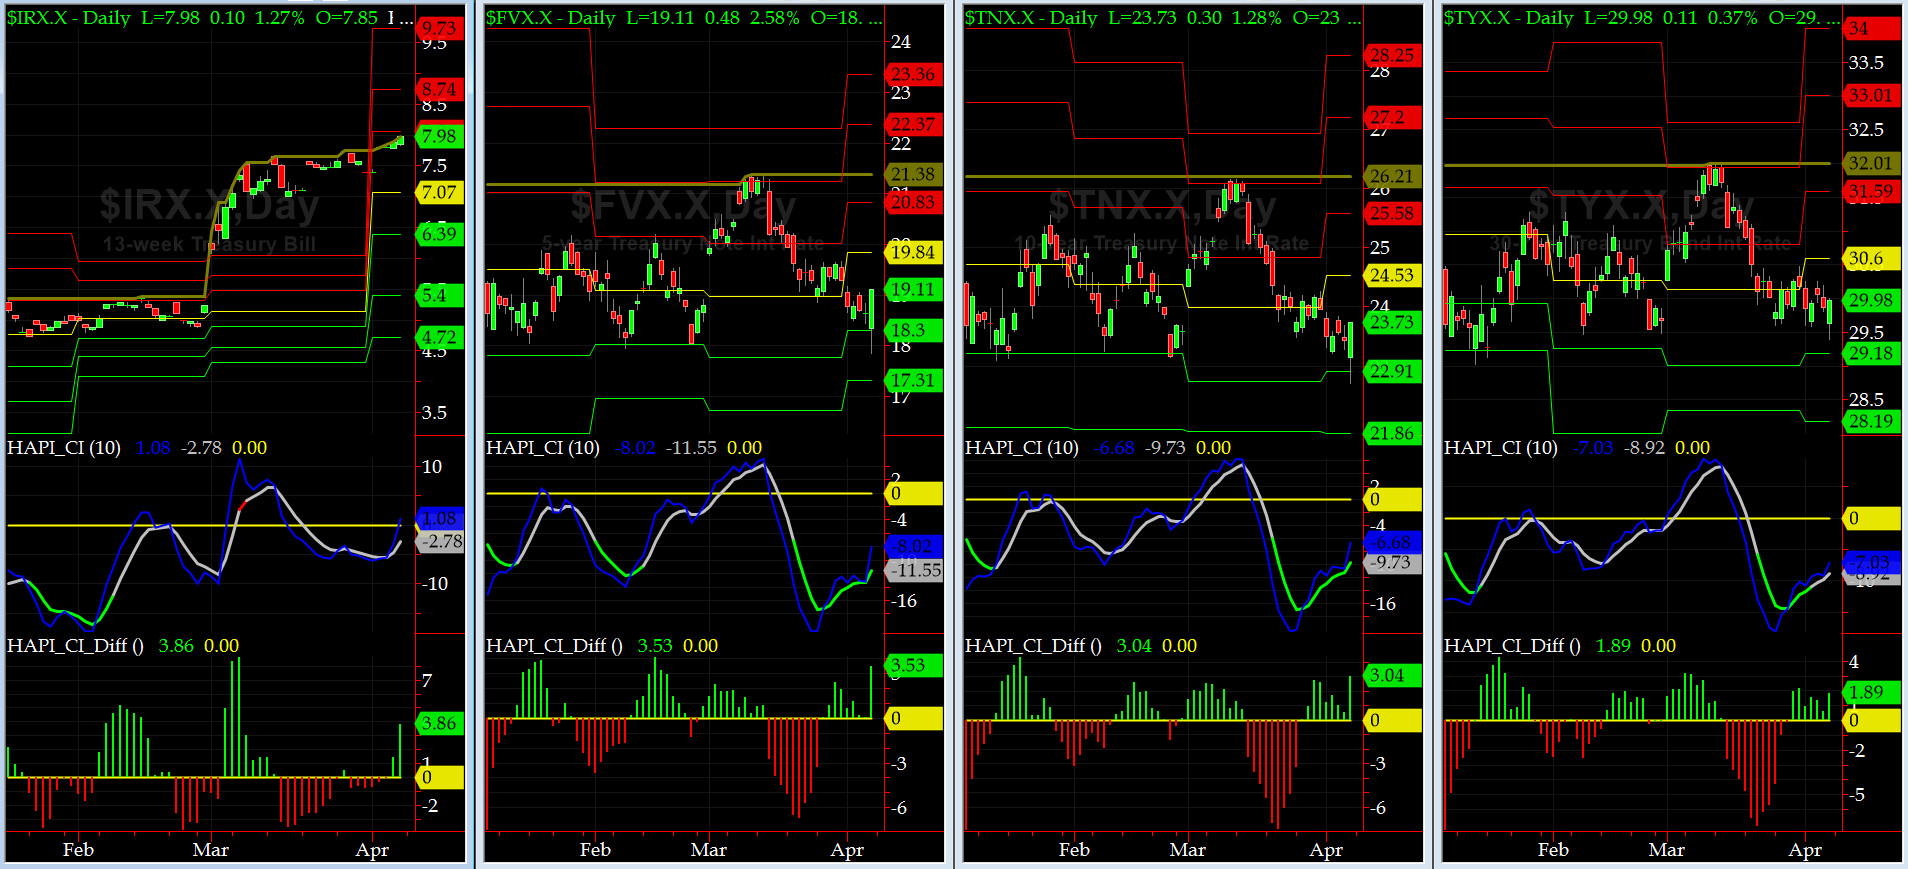
US Treasury T-Notes & T-Bonds Yields Chart
The front-end of Yield Curve keeps rising (in relative term) and the back-end ticking lower or sideways. A great show is ahead in the Debt Markets. As we say in the NAVY, fasten your harness, sailor.
Fari Hamzei
|


 Proactive Market Timing


