|
Sunday, April 16, 2017, 1300ET
Market Timing Charts, Analysis & Commentary for Issue #188
Timer Charts of S&P-500 Cash Index (SPX) + NASDAQ-100 Cash Index (NDX)
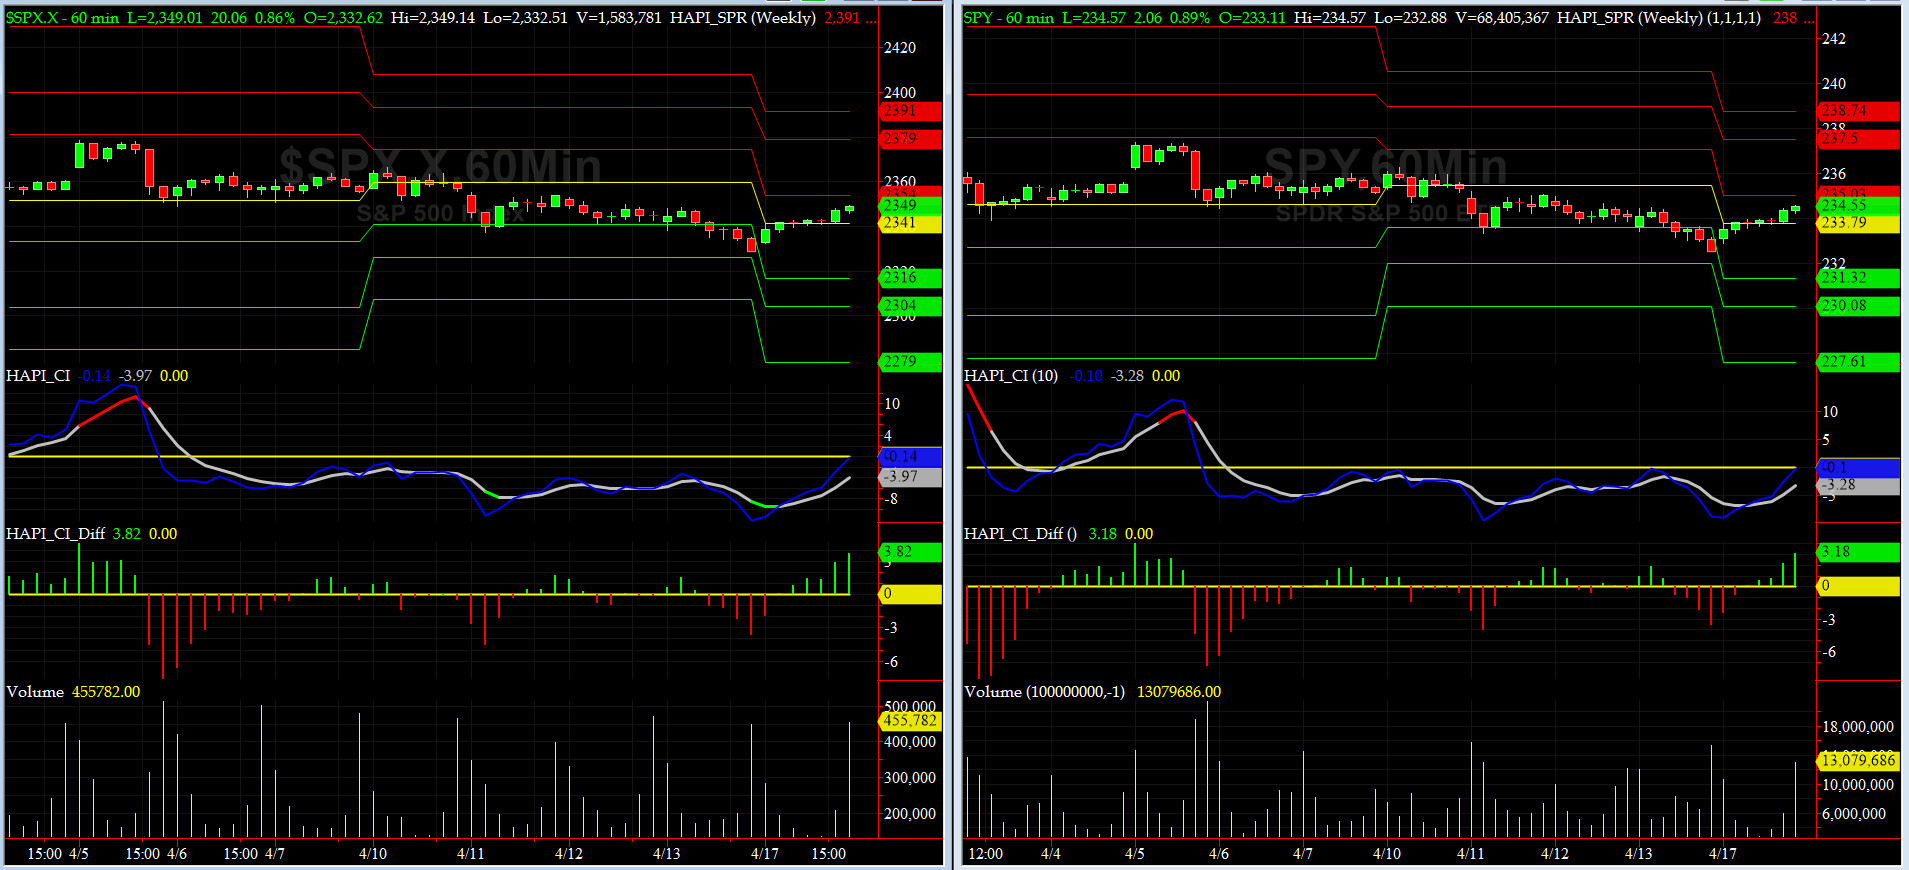
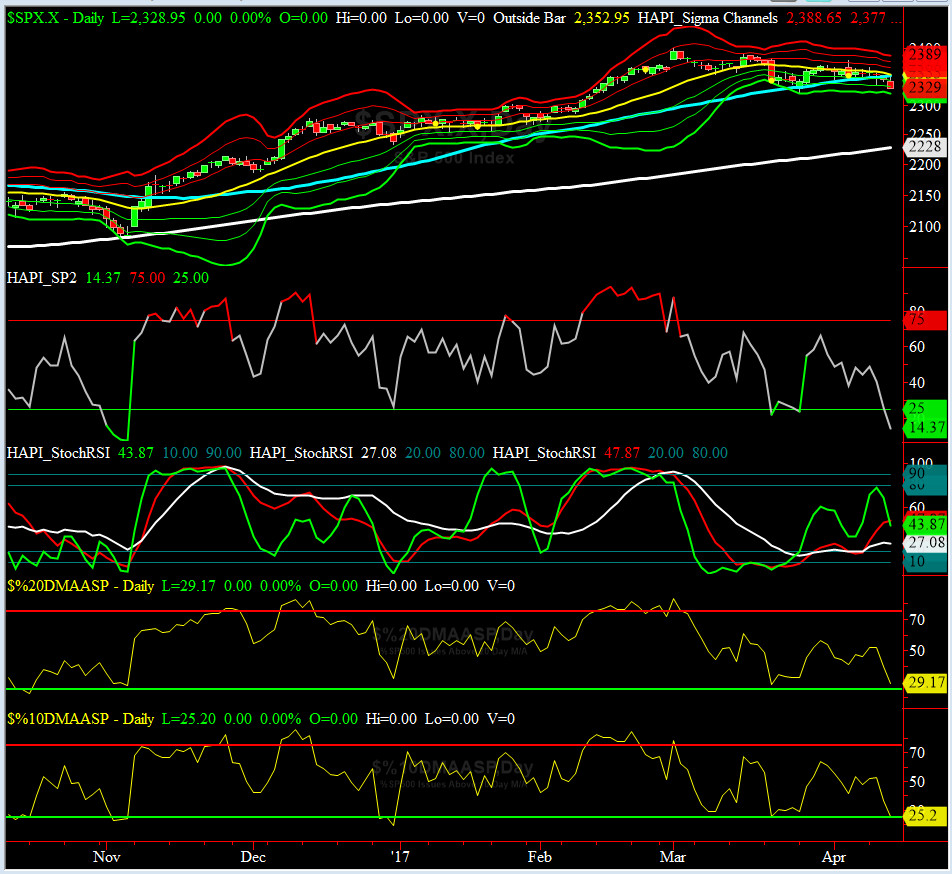
Most recent S&P-500 Cash Index (SPX): 2328.95 down -26.59 (down -1.1%) for the week ending Thursday, April 13, 2017, which closed just about its negative 2 sigma.
SPX ALL TIME INTRADAY HIGH = 2400.98 (reached on Wednesday, March 1, 2017)
SPX ALL TIME CLOSING HIGH = 2395.96 (reached on Wednesday, March 1, 2017)
Current DAILY +2 Sigma SPX = 2377 with WEEKLY +2 Sigma = 2415
Current DAILY 0 Sigma (20 day MA) SPX = 2355 with WEEKLY 0 Sigma = 2309
Current DAILY -2 Sigma SPX = 2332 with WEEKLY -2 Sigma = 2204
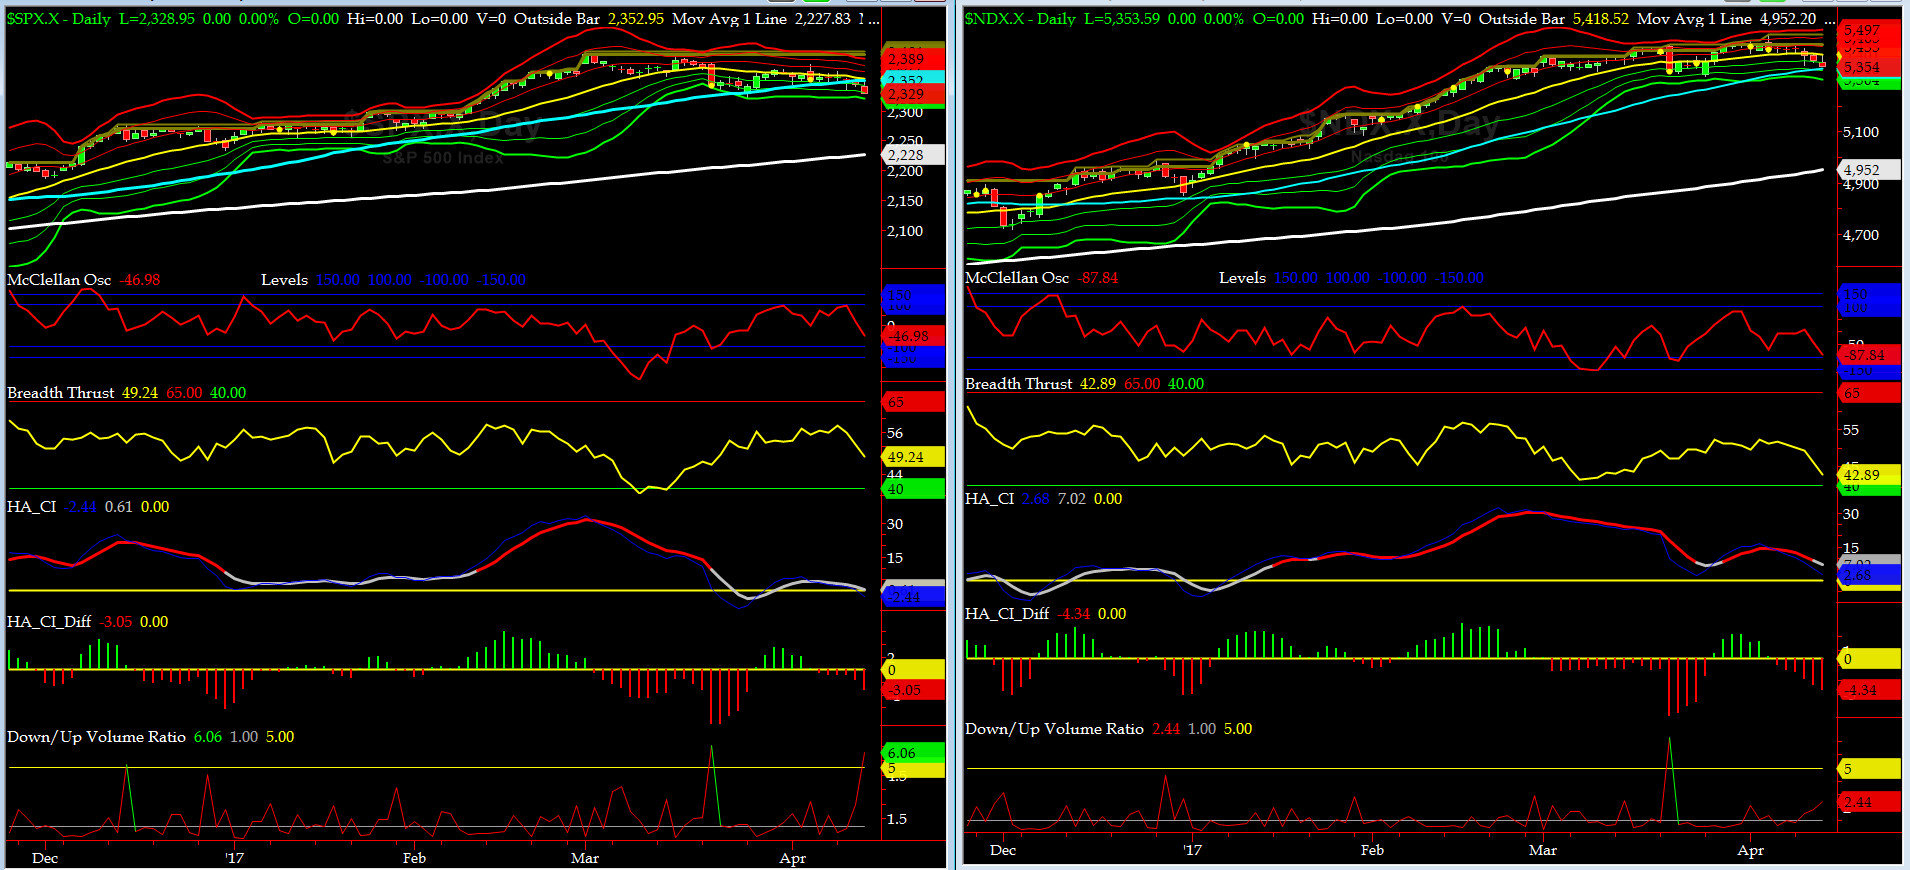
NYSE McClellan Oscillator = -47 (-150 is start of the O/S area; around -275 to -300 area or lower, we go into the �launch-pad� mode, over +150, we are in O/B area)
NYSE Breadth Thrust = 49 (40 is considered as oversold and 65 as overbought)
Please read our Weekly Market Comments sent to Timer Digest which was posted Friday evening on the top of our PMT Issue #187 (now in the Archives).

Canaries [in the Coal Mine] Chart for DJ TRAN & RUT Indices
200-Day MA DJ TRAN = 8581 or 3.4% below DJ TRAN (max observed in last 5 yrs = 20.2%, min = -20.3%)
200-Day MA RUT = 1294 or 3.9% below RUT (max observed in last 5 yrs = 21.3%, min = -22.6%)
DJ Transportation Index (proxy for economic conditions 6 to 9 months hence) made our ROMAN Legion run for the hills, as it suffered two consecutive down days after failing to recapture 50-Day MA.
In contrast, Russell 2000 Small Caps Index (proxy for Risk ON/OFF) displayed a mild setback, as it sold off moderately. For now, RISK is muted.
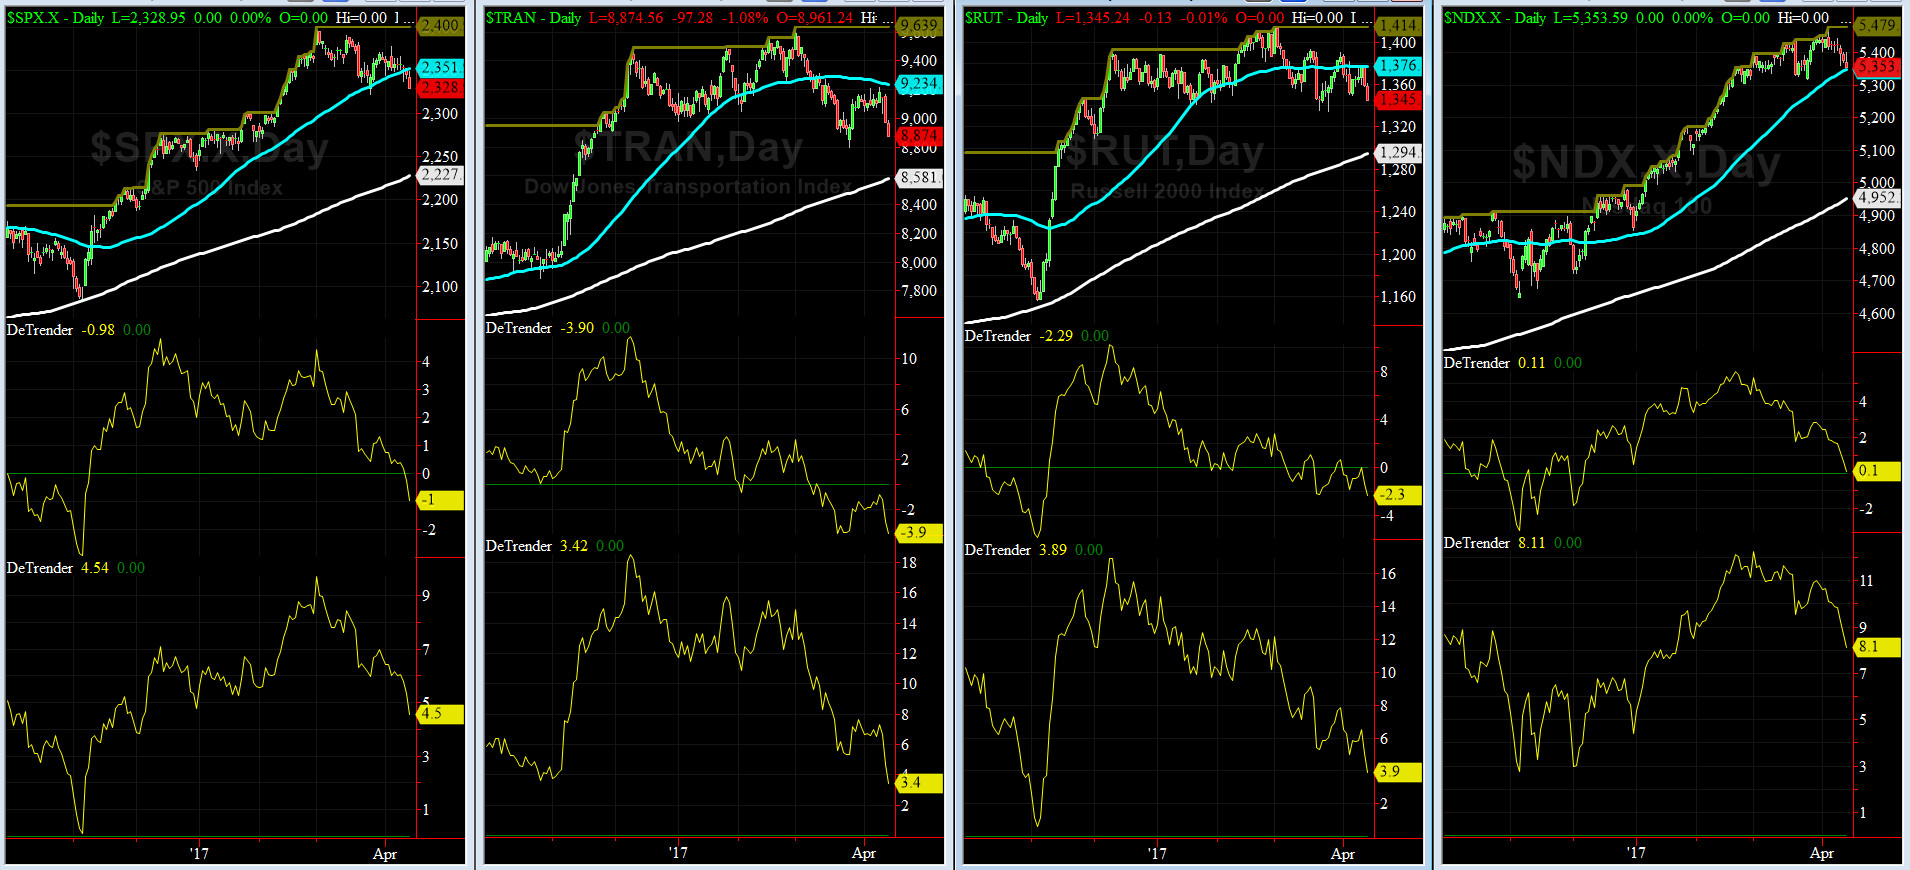
DeTrenders Charts for SPX, NDX, TRAN & RUT Indices
50-Day MA SPX = 2352 or 1% above SPX (max observed in last 5 yrs = +8.6%, min = -9.3%)
200-Day MA SPX = 2228 or 4.5% below SPX (max observed in last 5 yrs = 15.2%, min = -14%)
Almost FOUR of our EIGHT DeTrenders are now negative. The DeTrenders for DJ Tran & RUT will continue to be harbingers of future price behavior in broad indices.
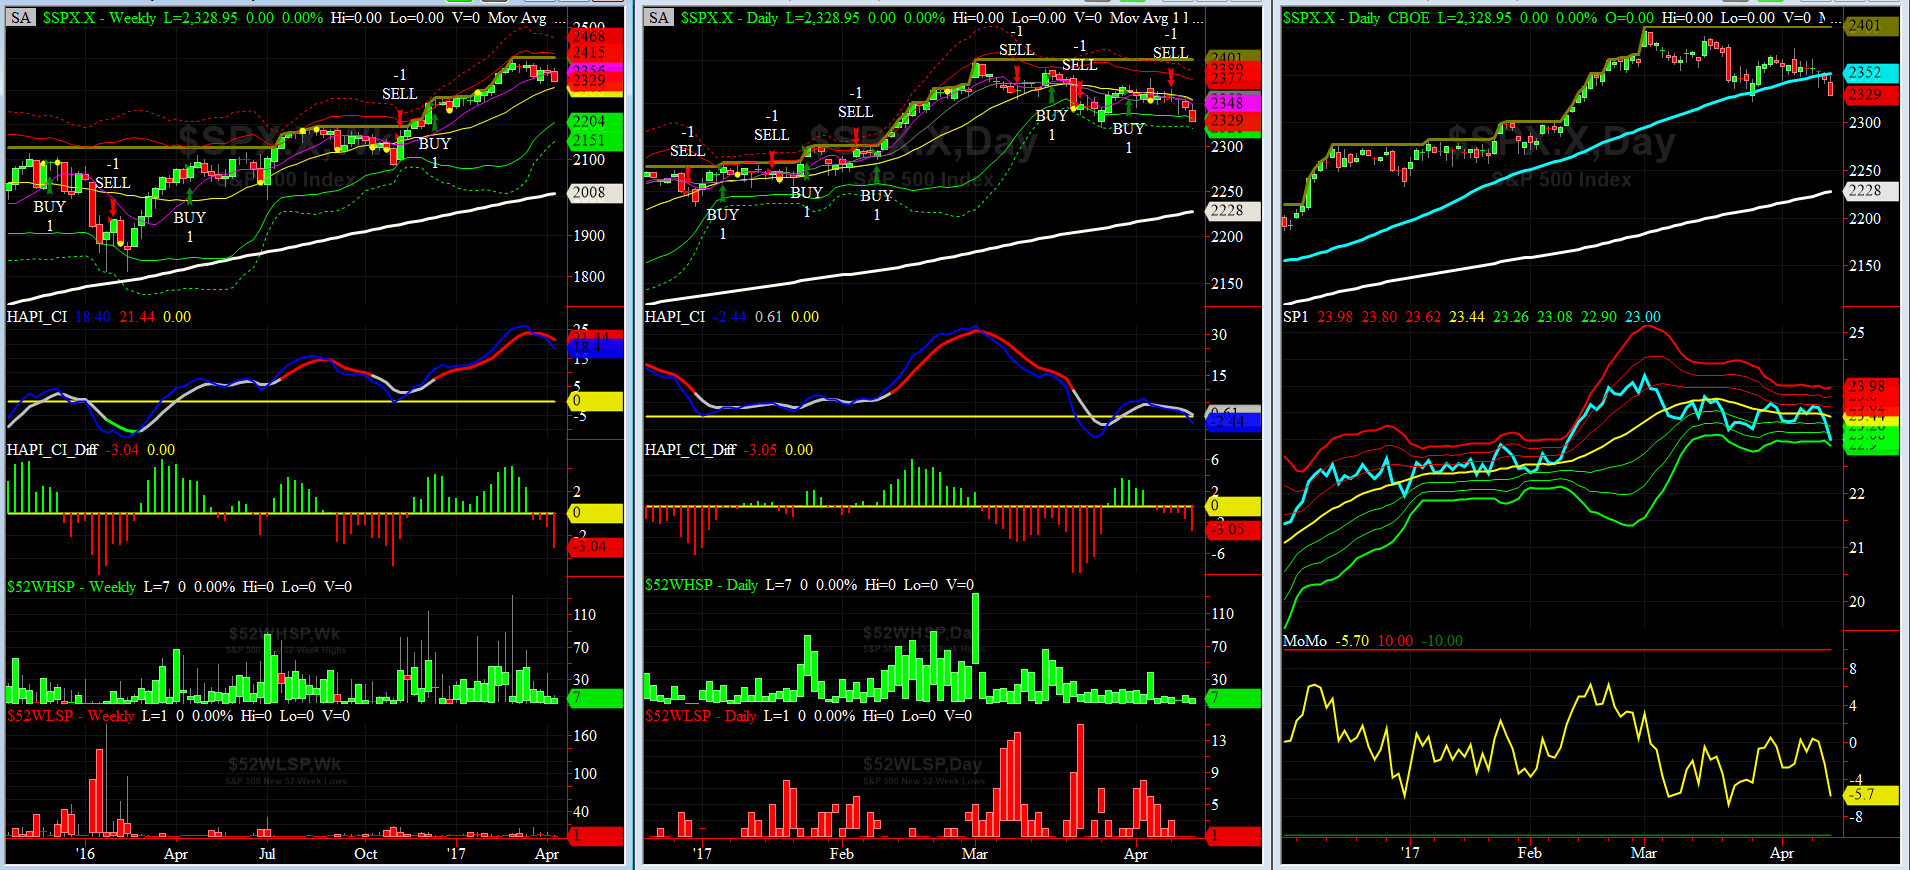
HA_SP1_Momo Chart
WEEKLY Timing Model = on a BUY Signal since Friday 12/16/16 CLOSE at 2258
DAILY Timing Model = on a SELL Signal since Monday 4/10/17 CLOSE at 2357
Max SPX 52wk-highs reading last week = 11 (over 120-140, the local maxima is in)
Max SPX 52wk-Lows reading last week = 3 (over 40-60, the local minima is in)
HA_SP1 at just above its -2 sigma channels
HA_Momo = -5.7 (reversals most likely occur above +10 or below -10)
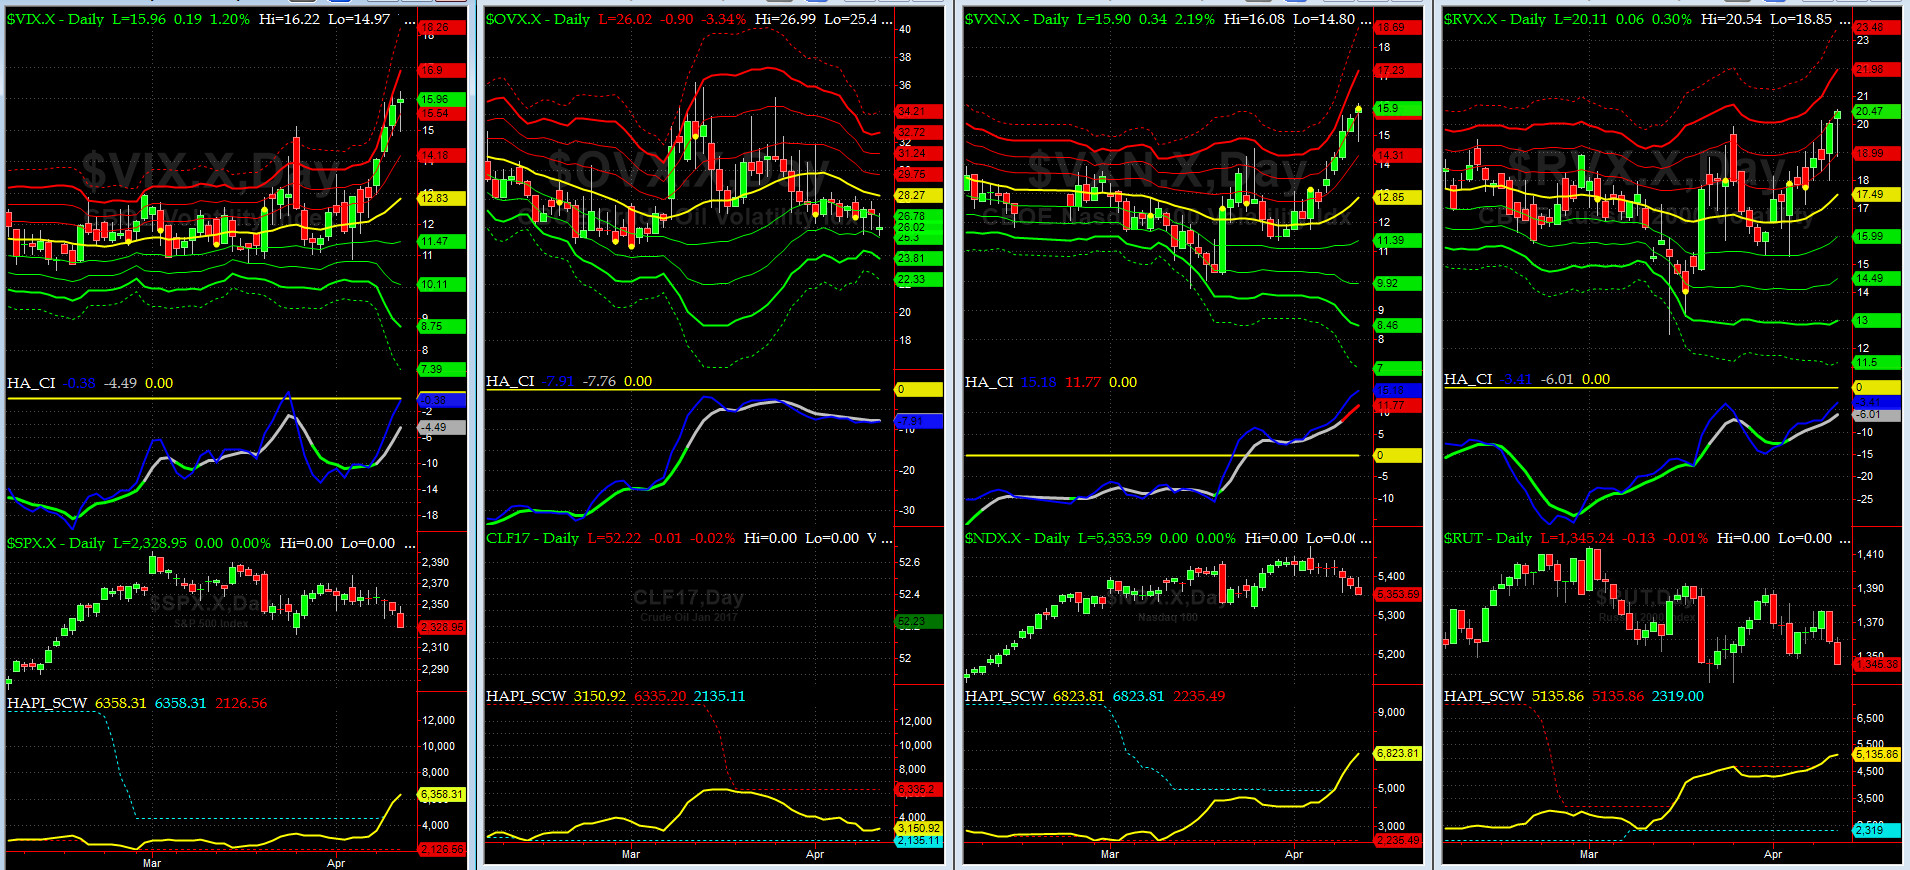
Vol of the Vols Chart
VIX is currently stands at 15.96, or about its +2.5 sigma (remember it�s the VIX�s volatility pattern (its sigma channels) that matters, and not the level of VIX itself (this is per Dr. Robert Whaley, a great mentor and the inventor of original VIX, now called VXO). VIX usually peaks around a test of its +4 sigma).
Additionally, RUT VIX rose past +20 to its +2 sigma.
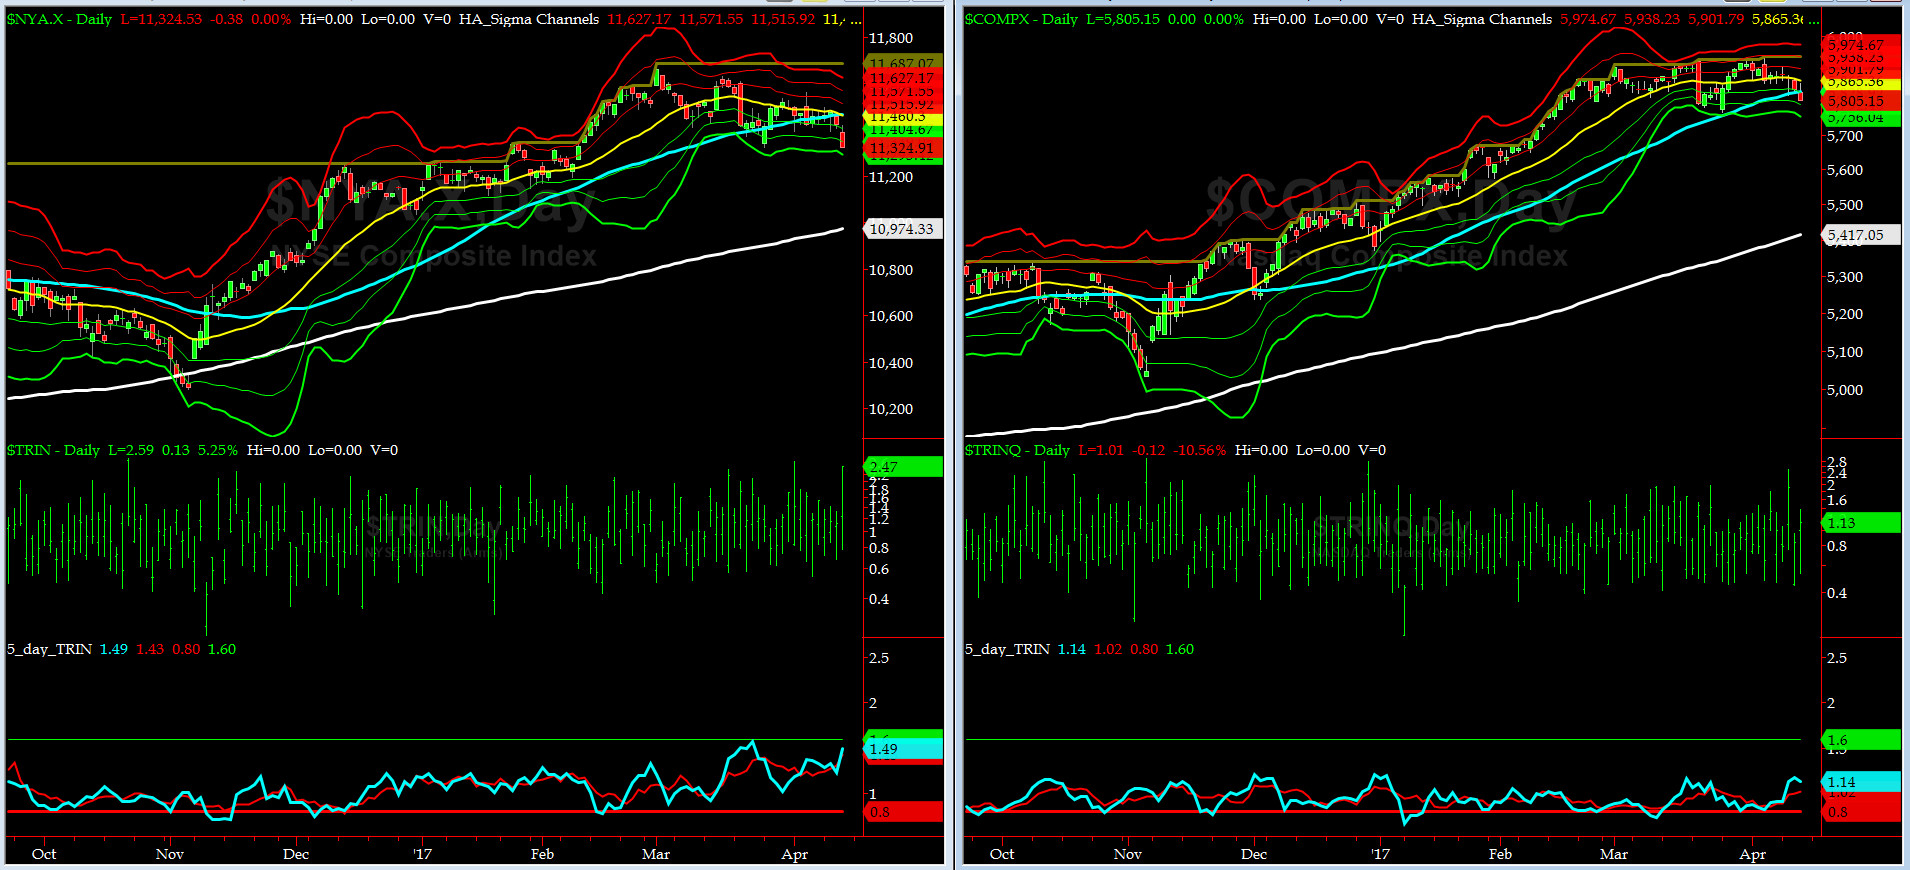
5-day TRIN & TRINQ Charts
5-day TRIN is approaching a BUY zone while 5-day TRINQ is at NEUTRAL here.
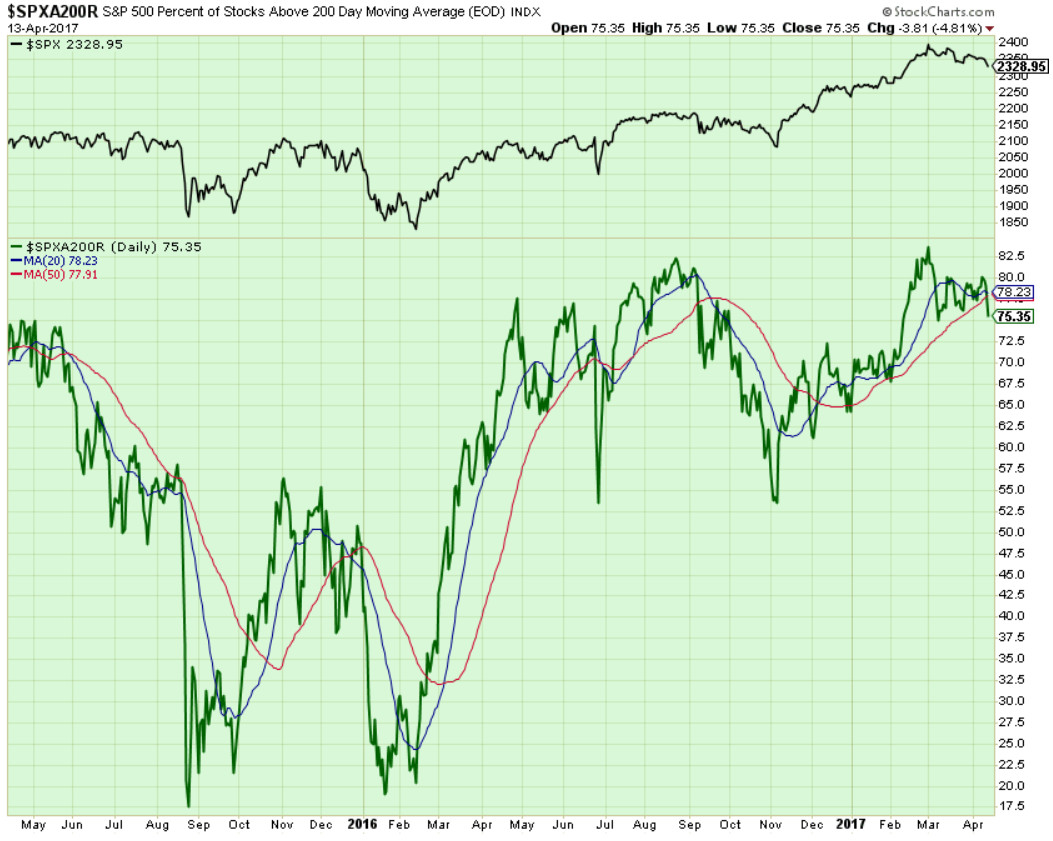
Components of SPX above their respective 200day MA Chart
This scoring indicator sold off to 75%. And still NO DIVERGENEE SIGNAL HERE yet.
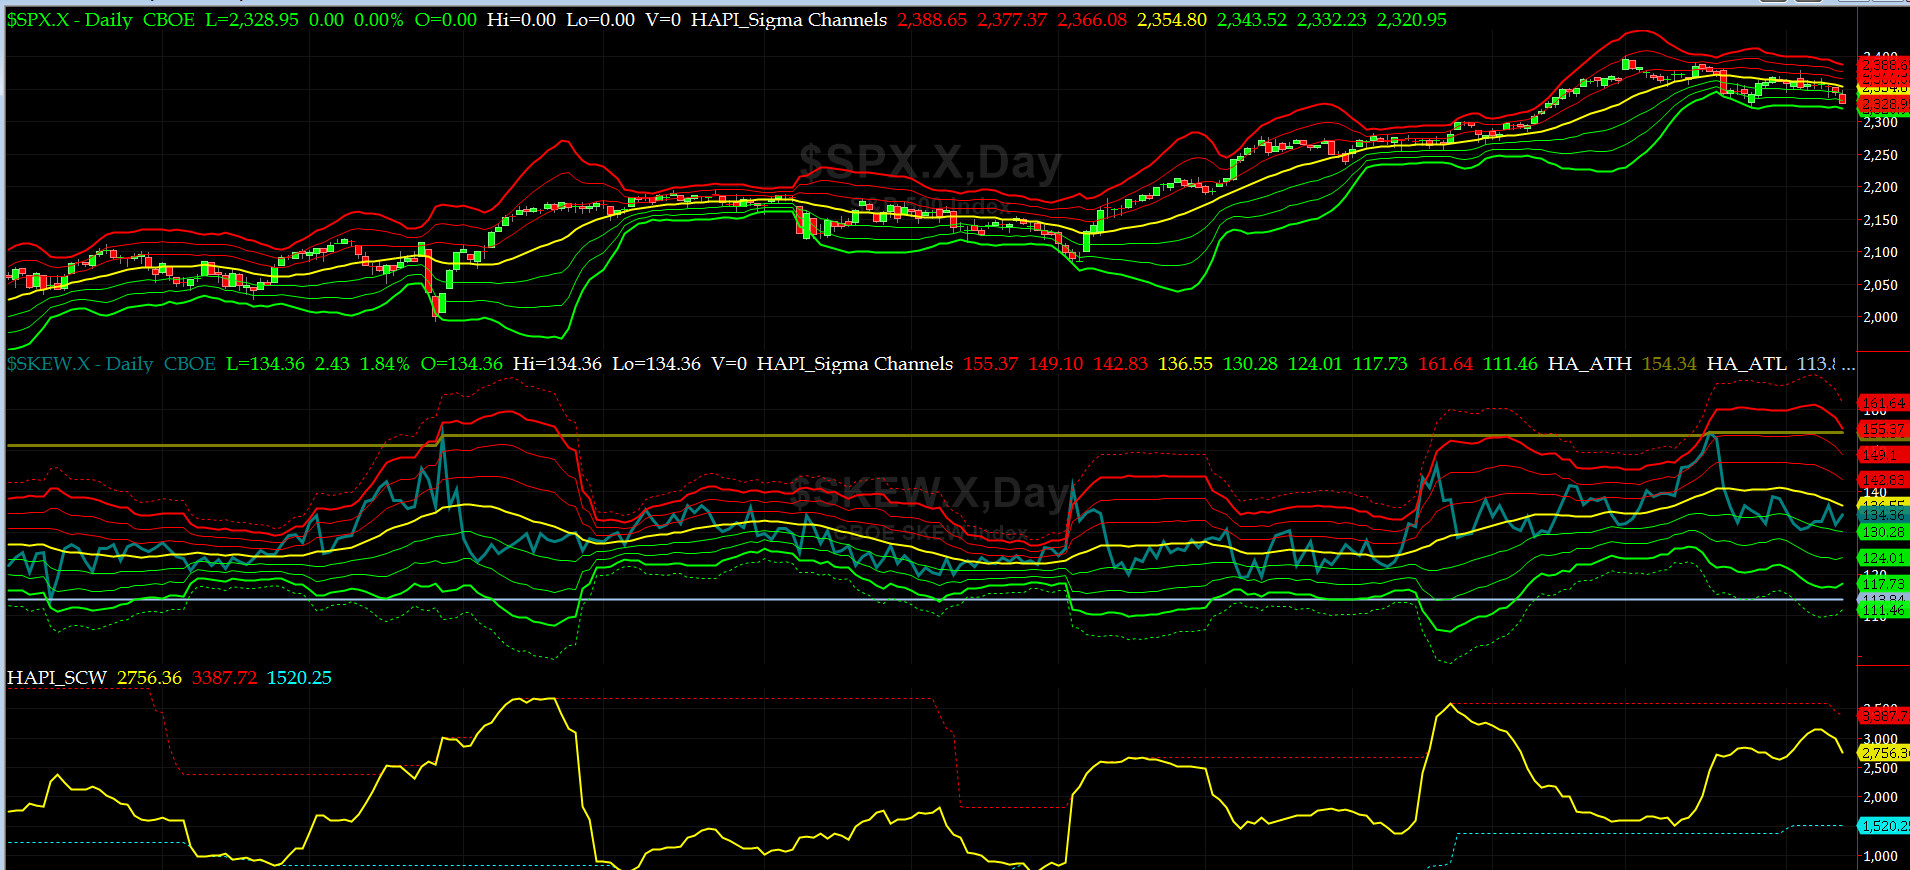
SPX SKEW (Tail Risk) Chart
Last week SPX SKEW (Tail Risk) came down further and settled near its zero sigma at 134 (normal = 120-125, range 100-150).
Is all quiet on the Eastern & Mid-Western Fronts? We don't think so.

3-month VIX Futures Spread(VX) Chart
Our VX Spread (LONG MAY SHORT AUG) rallied hard this past week, closing at -0.9 near its hourly +2 sigma on Thursday.
HA_SP2 Chart
HA_SP2 = 14.4 (Buy signal <= 25, Sell Signal >= 75)
We are in the OVERSOLD zone but we could remain down here if more bad news hits our markets.
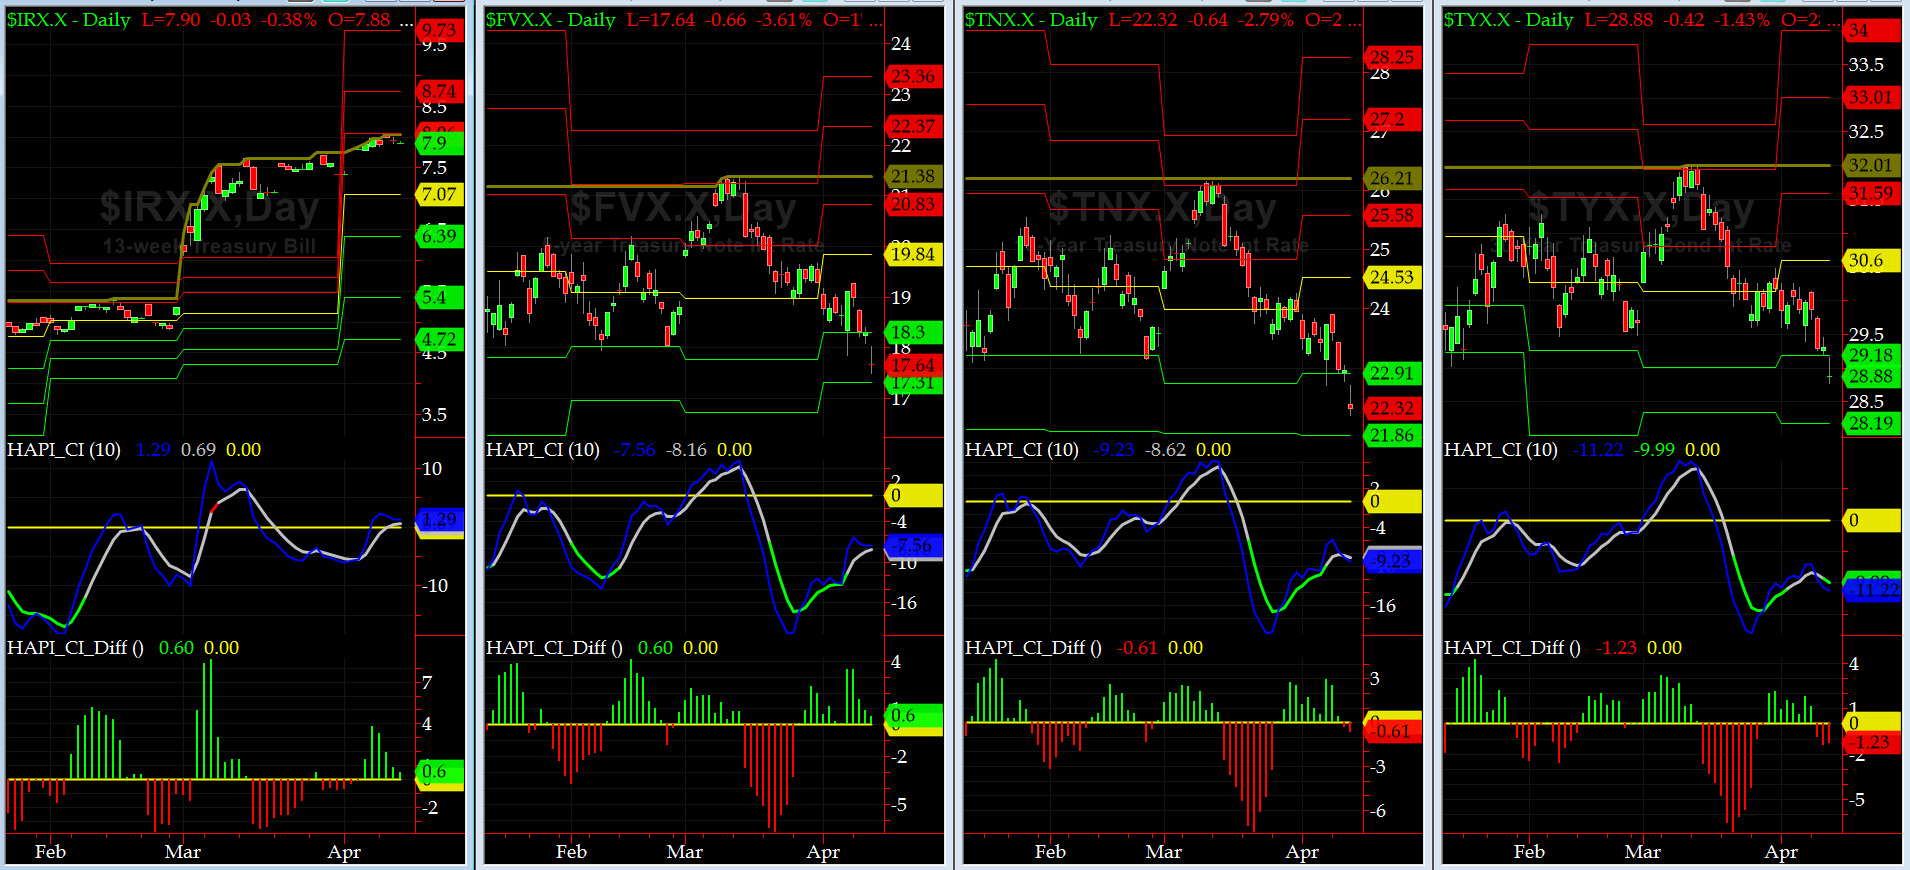
US Treasury T-Notes & T-Bonds Yields Chart
The front-end of Yield Curve kept its value as flight to saftey forced the long end to rally along with gold and oil. As we say in the NAVY, fasten your harness, sailor.
Fari Hamzei
|


 Proactive Market Timing