|
Saturday, April 22, 2017, 1945ET
Market Timing Charts, Analysis & Commentary for Issue #189
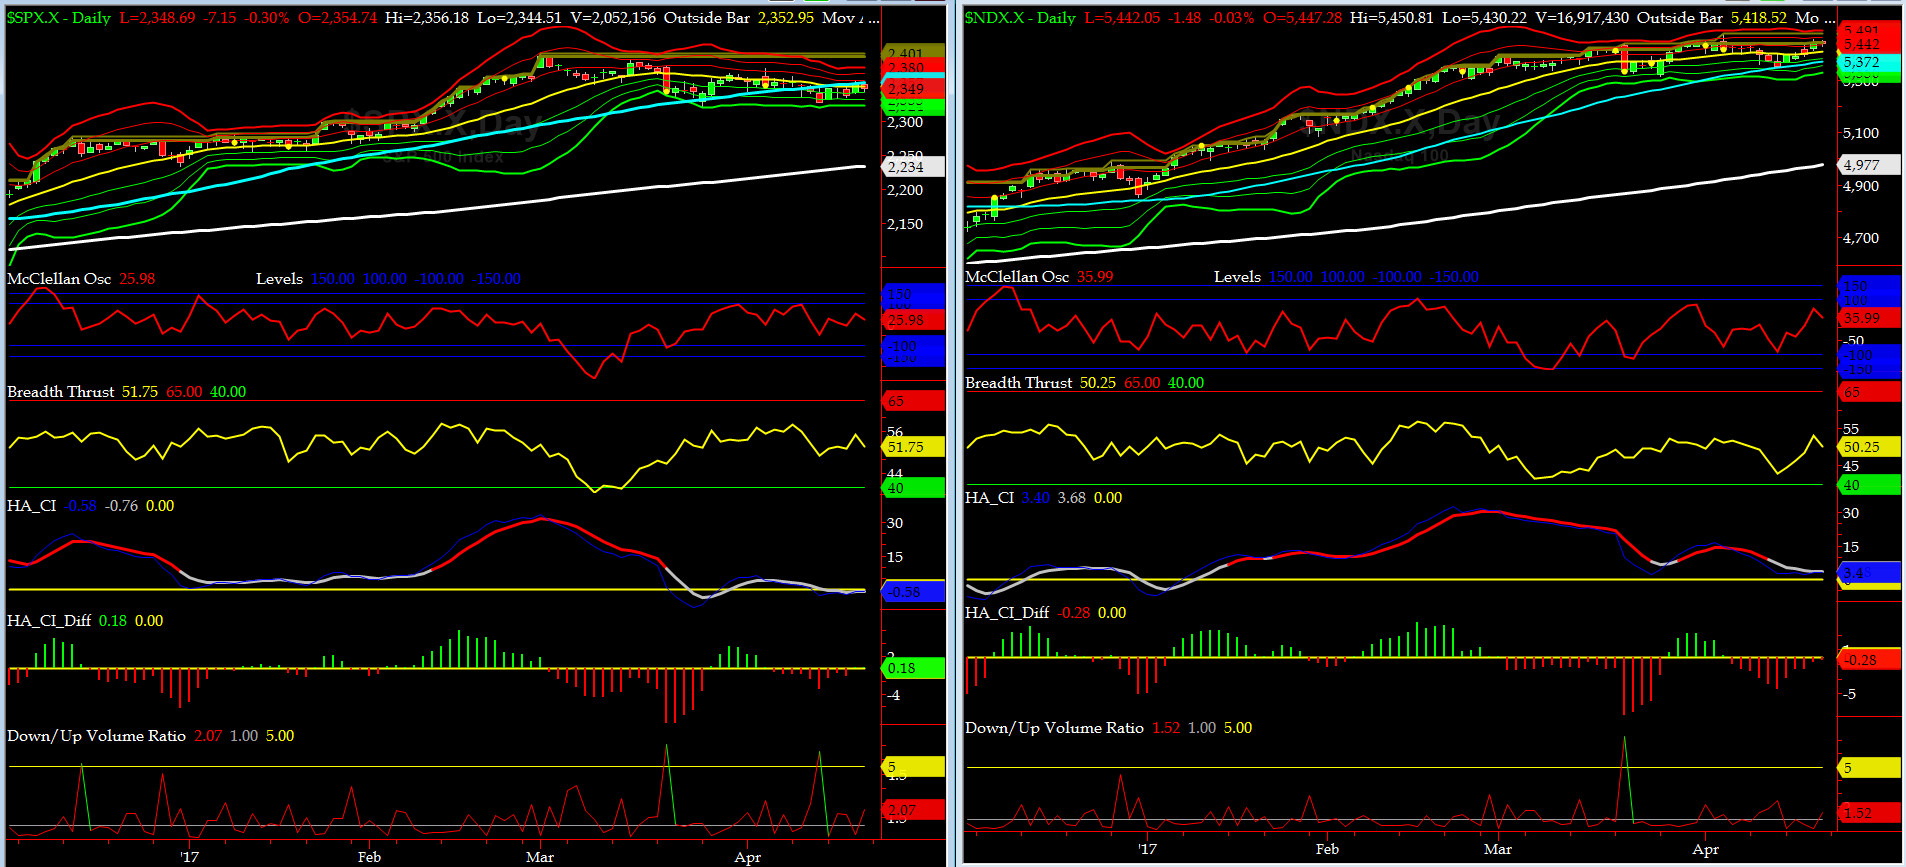
Timer Charts of S&P-500 Cash Index (SPX) + NASDAQ-100 Cash Index (NDX)
Most recent S&P-500 Cash Index (SPX): 2348.69 up +19.74 (up +0.85%) for the week ending Friday, April 21, 2017, which closed just about its at zero sigma.
SPX ALL TIME INTRADAY HIGH = 2400.98 (reached on Wednesday, March 1, 2017)
SPX ALL TIME CLOSING HIGH = 2395.96 (reached on Wednesday, March 1, 2017)
Current DAILY +2 Sigma SPX = 2371 with WEEKLY +2 Sigma = 2409
Current DAILY 0 Sigma (20 day MA) SPX = 2352 with WEEKLY 0 Sigma = 2317
Current DAILY -2 Sigma SPX = 2333 with WEEKLY -2 Sigma = 2225
NYSE McClellan Oscillator = +26 (-150 is start of the O/S area; around -275 to -300 area or lower, we go into the �launch-pad� mode, over +150, we are in O/B area)
NYSE Breadth Thrust = 51.7 (40 is considered as oversold and 65 as overbought)
SPX still remains below its 50-day MA. This week we should see some upside pressure on the VOLS.
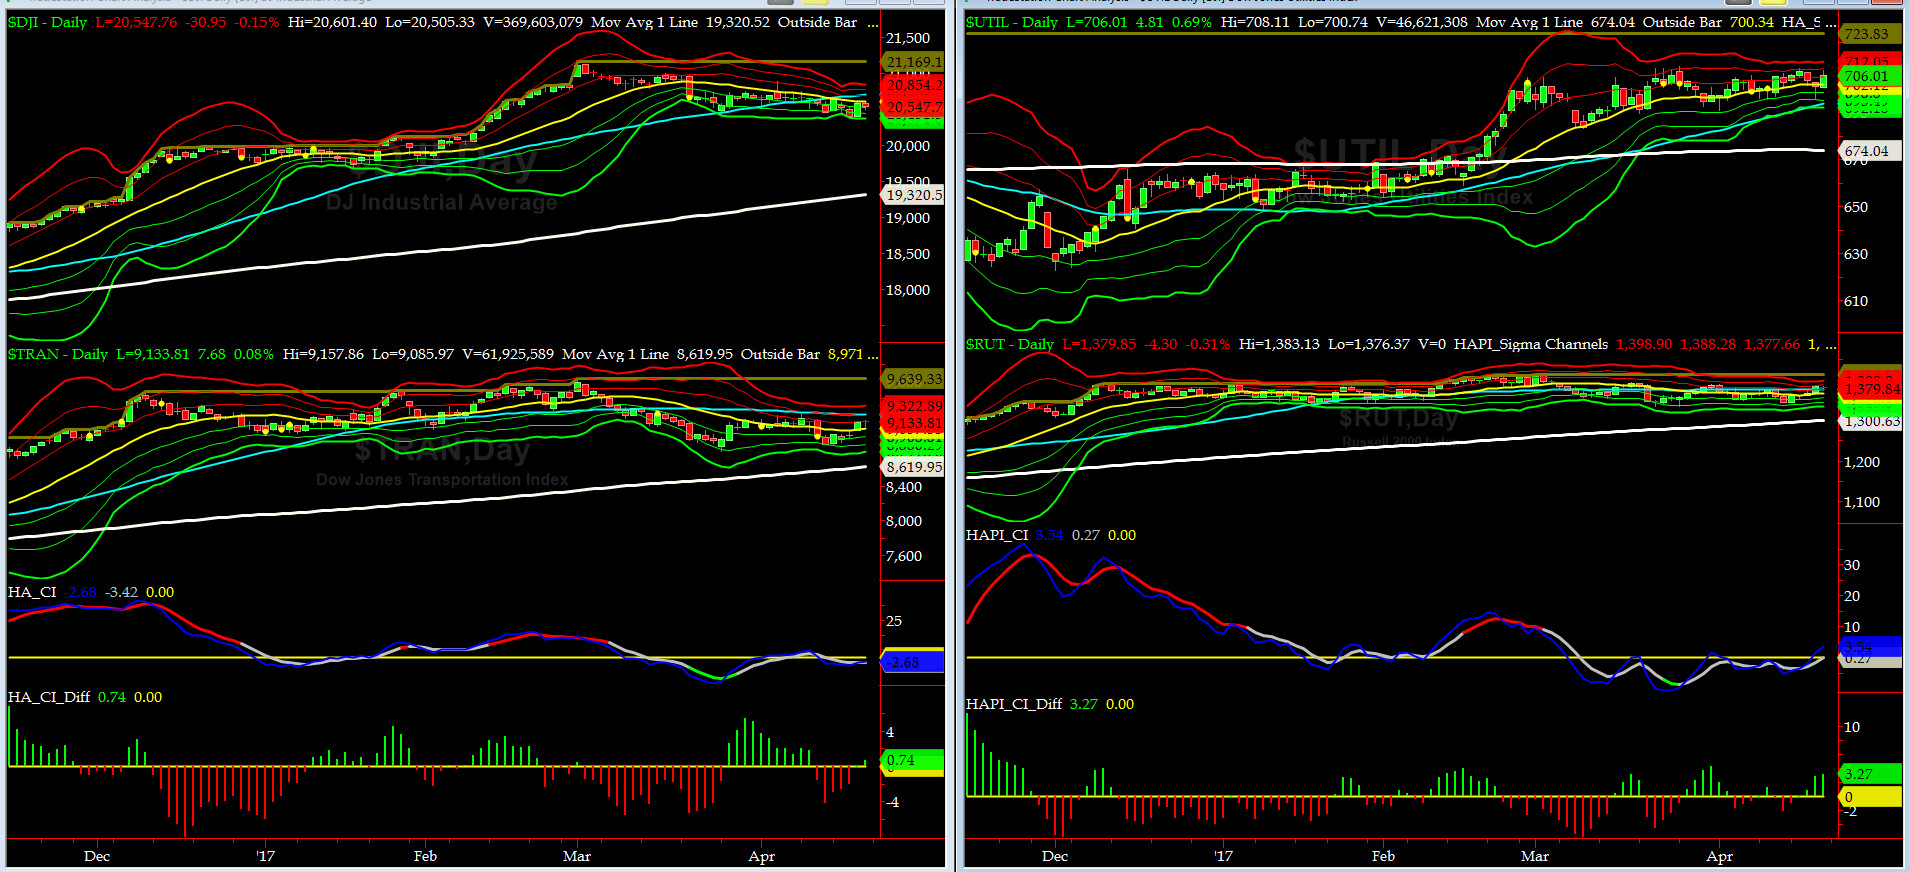
Canaries [in the Coal Mine] Chart for DJ TRAN & RUT Indices
200-Day MA DJ TRAN = 8619 or 6% below DJ TRAN (max observed in last 5 yrs = 20.2%, min = -20.3%)
200-Day MA RUT = 1300 or 6.1% below RUT (max observed in last 5 yrs = 21.3%, min = -22.6%)
DJ Transportation Index (proxy for economic conditions 6 to 9 months hence) rallied this past week but still failed to rise above the key level of 50-day MA.
In like fashion, Russell 2000 Small Caps Index (proxy for Risk ON/OFF) moved up but also managed to close just above its 50-day MA. For now, RISK is still rather muted.

DeTrenders Charts for SPX, NDX, TRAN & RUT Indices
50-Day MA SPX = 2357 or 0.4% above SPX (max observed in last 5 yrs = +8.6%, min = -9.3%)
200-Day MA SPX = 2234 or 5.1% below SPX (max observed in last 5 yrs = 15.2%, min = -14%)
Only TWO of our EIGHT DeTrenders are now negative. The DeTrenders for DJ Tran & RUT will continue to be harbingers of future price behavior in broad indices.

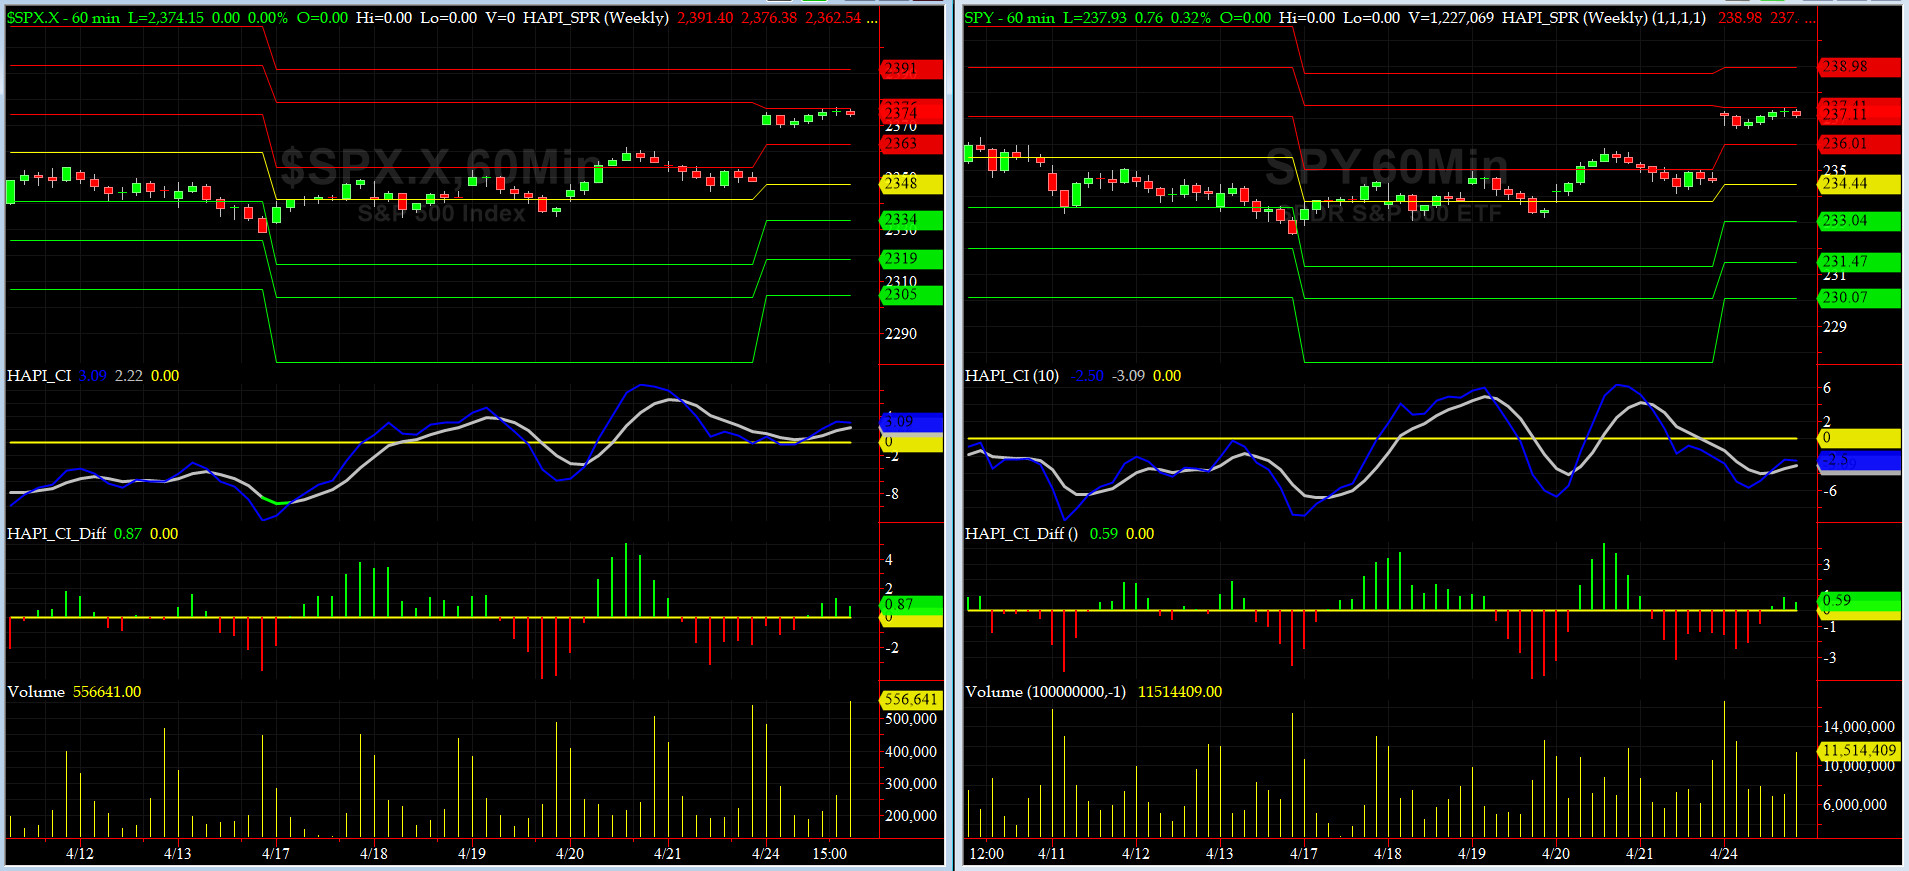
HA_SP1_Momo Chart
WEEKLY Timing Model = on a BUY Signal since Friday 12/16/16 CLOSE at 2258
DAILY Timing Model = on a SELL Signal since Monday 4/10/17 CLOSE at 2357
Max SPX 52wk-highs reading last week = 39 (over 120-140, the local maxima is in)
Max SPX 52wk-Lows reading last week = 3 (over 40-60, the local minima is in)
HA_SP1 at just above its zero sigma channels
HA_Momo = +0.2 (reversals most likely occur above +10 or below -10)
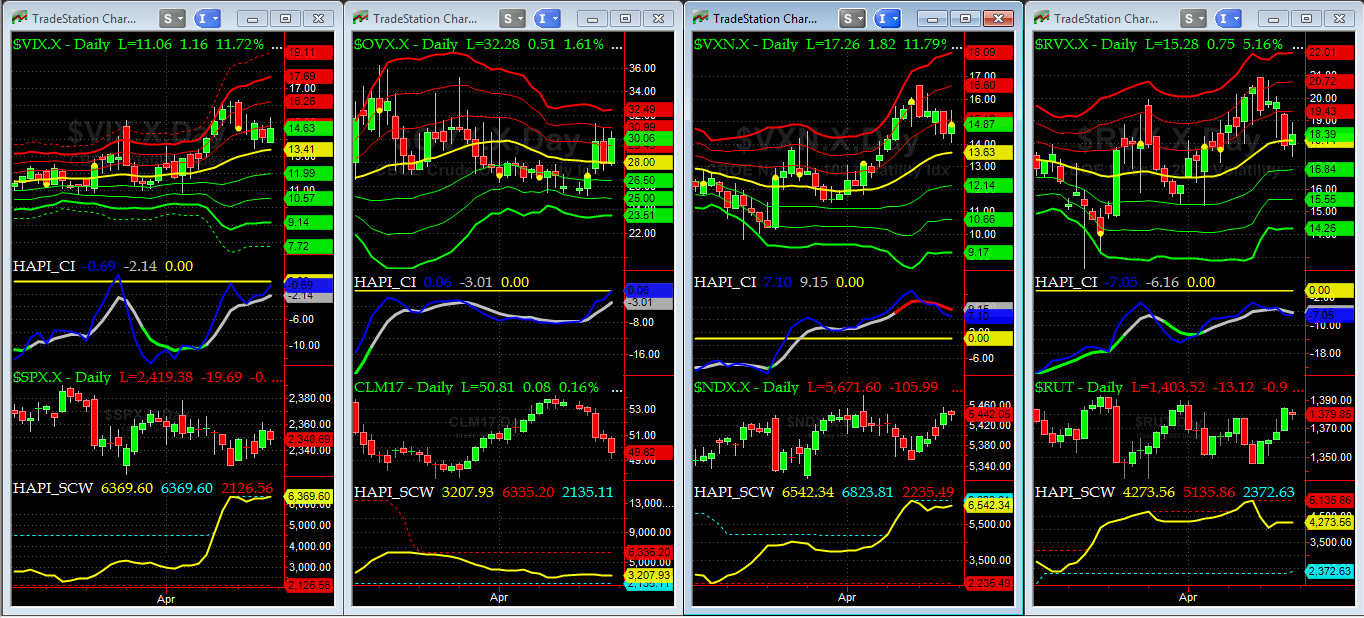
Vol of the Vols Chart
VIX is currently stands at 14.63, or just a tad below its +1 sigma (remember it�s the VIX�s volatility pattern (its sigma channels) that matters, and not the level of VIX itself (this is per Dr. Robert Whaley, a great mentor and the inventor of original VIX, now called VXO). VIX usually peaks around a test of its +4 sigma).
We expect to see another spike in VIX in a week or two but not higher than its **then** +2.5 sigma. That should give us a tradeable bottom.
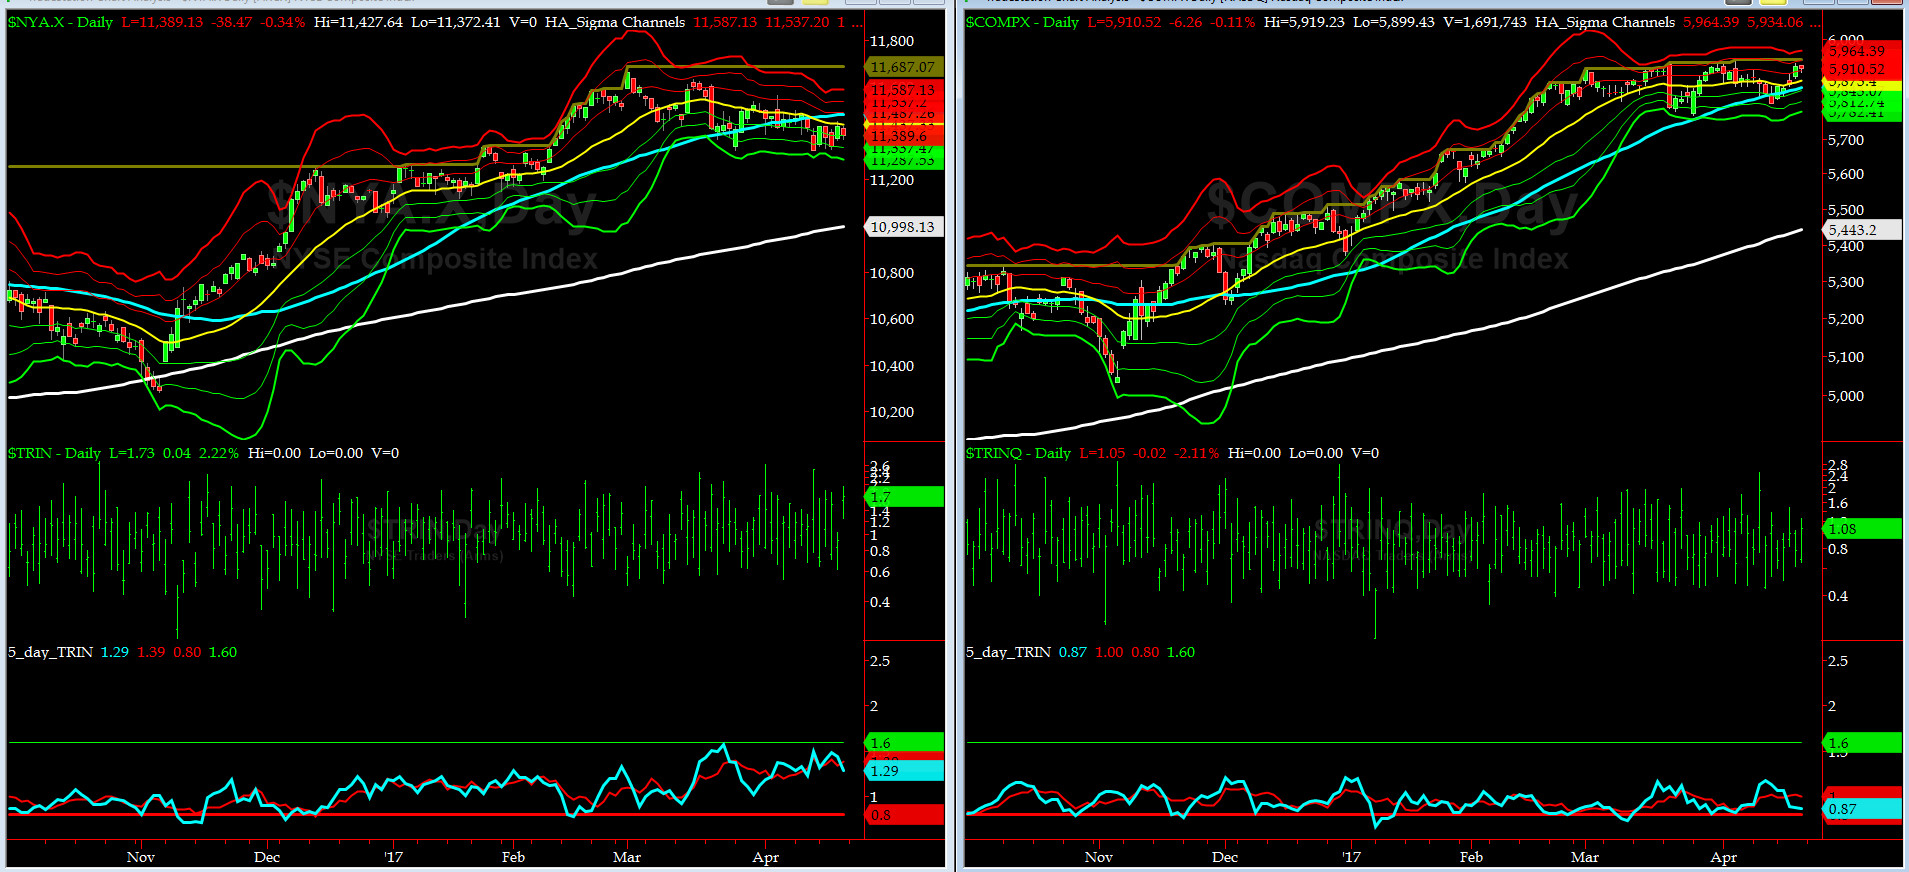
5-day TRIN & TRINQ Charts
5-day TRIN is still hovering around its BUY zone while 5-day TRINQ near its SELL zone.

Components of SPX above their respective 200day MA Chart
This scoring indicator stayed pretty much around 75%. And still NO DIVERGENEE SIGNAL HERE yet.

SPX SKEW (Tail Risk) Chart
Last week SPX SKEW (Tail Risk) rallied hard to almost its +3 sigma at 148.5 (normal = 120-125, range 100-150) ahead of first round of French Elections.
Is all quiet on the Eastern & Mid-Western Fronts? NOPE. We read this as the markets are expecting Marine LePen, the colorful leader of Front National, to eventually win on May 7th and put Frexit into motion.
We favor Marine too.
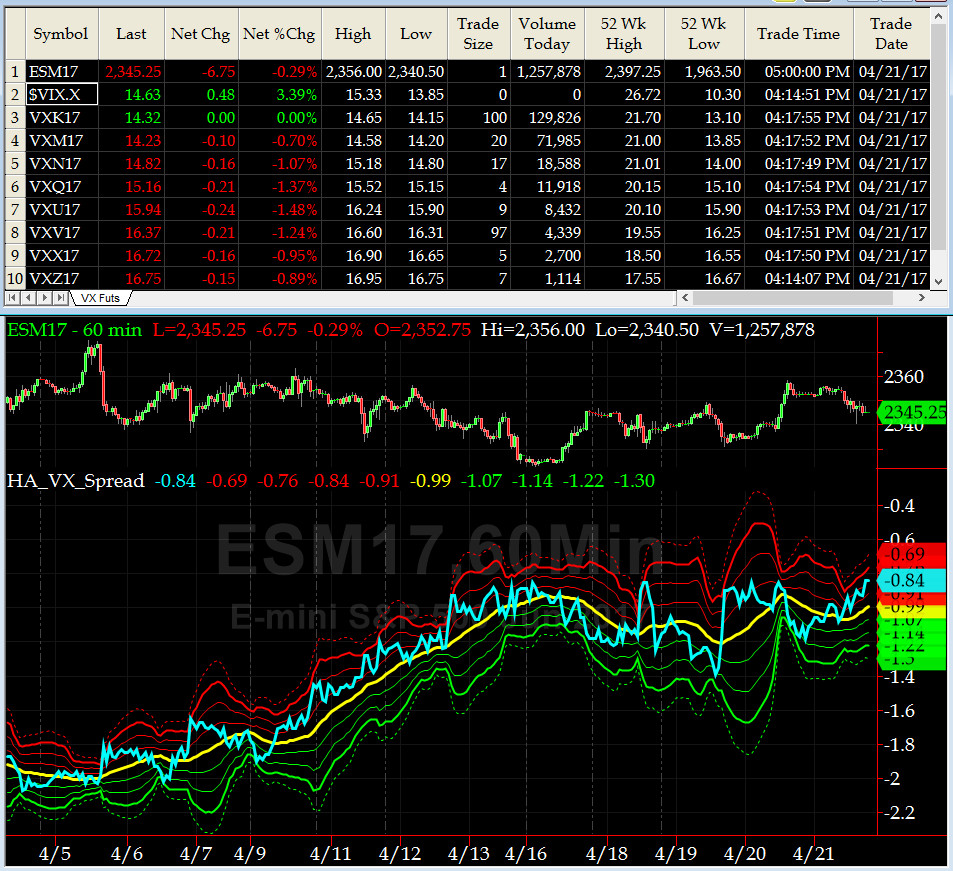
3-month VIX Futures Spread(VX) Chart
Our VX Spread (LONG MAY SHORT AUG) moved around quite a bit but still closed near where it was last Thursday, at -0.84, and just a tad over its hourly +2 sigma.
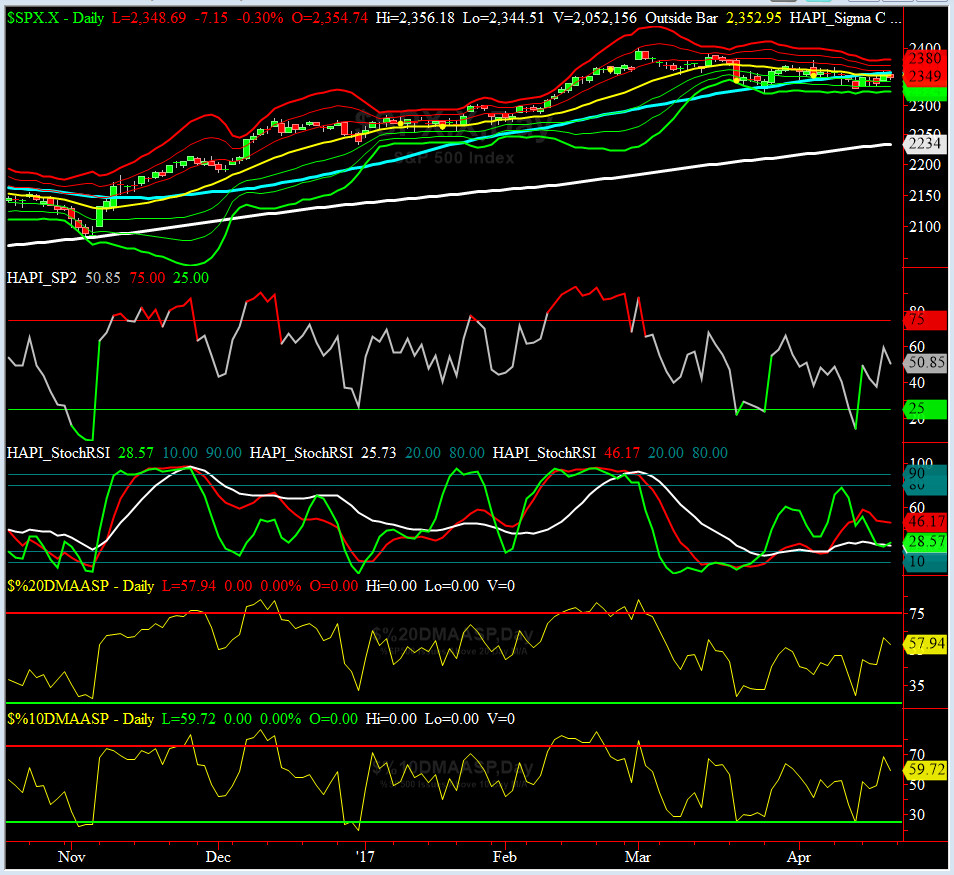
HA_SP2 Chart
HA_SP2 = 50.8 (Buy signal <= 25, Sell Signal >= 75)
We are in the NEUTRAL zone for now.
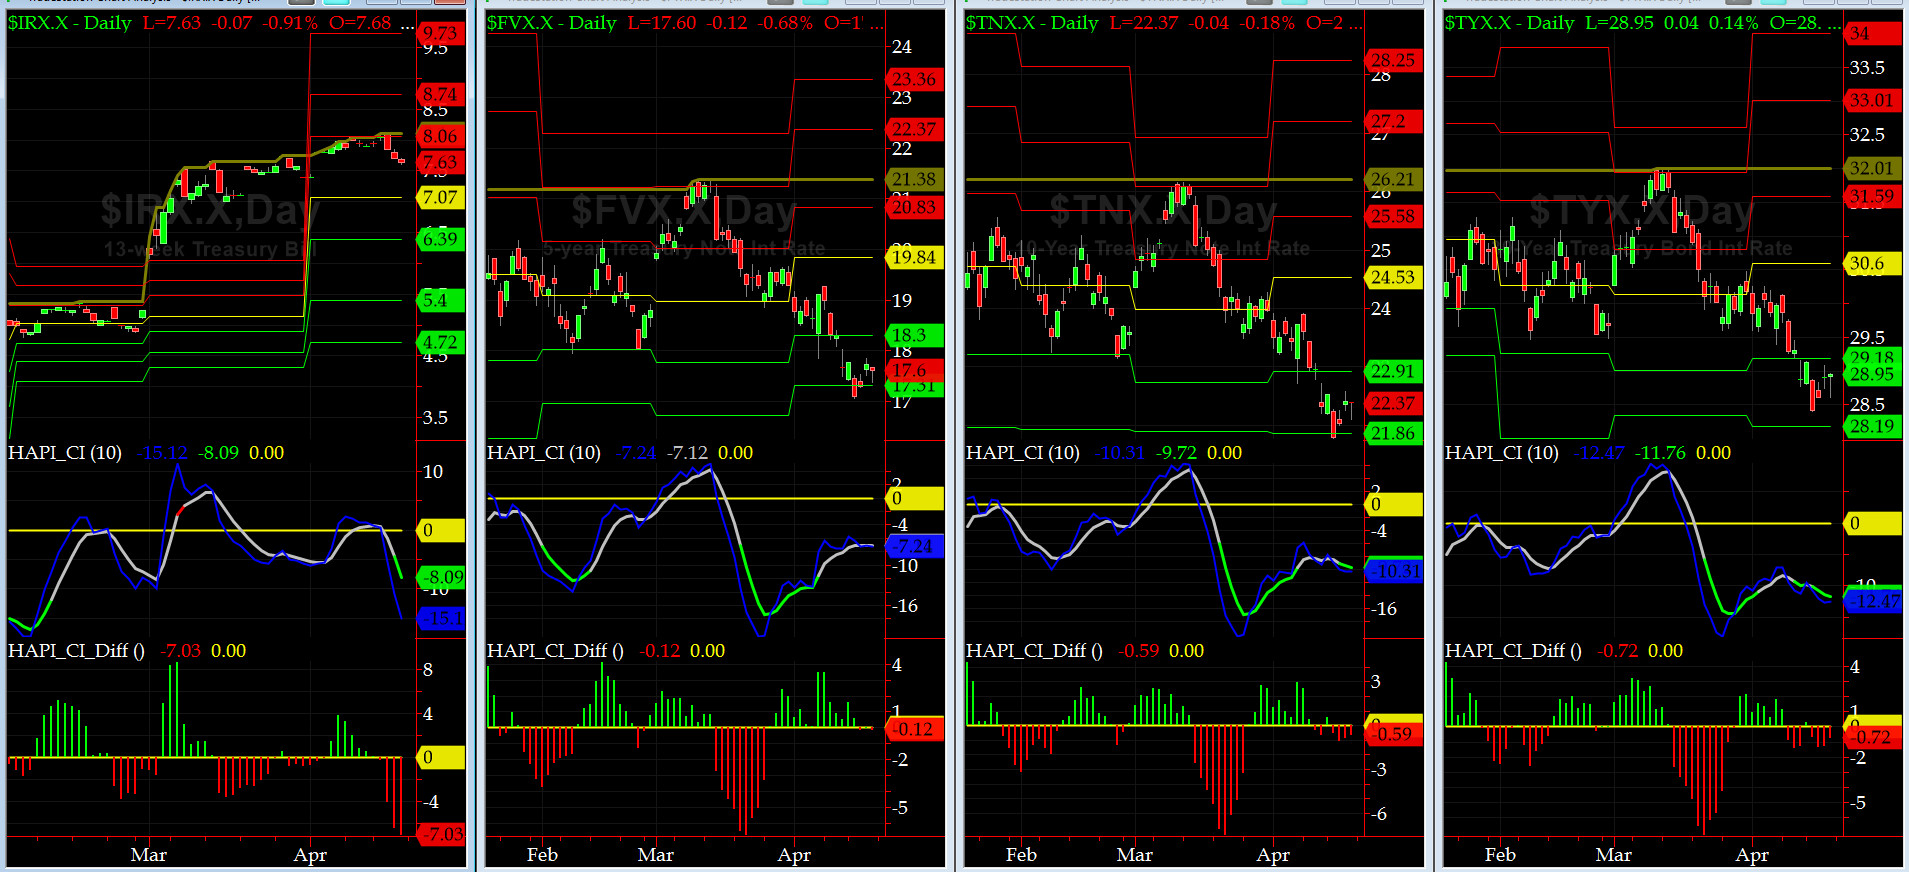
US Treasury T-Notes & T-Bonds Yields Chart
This past week, the US Bond Market rallied and pushed down the YTMs, from the short term to the long end, of the Yield Curve.
Fari Hamzei
|


 Proactive Market Timing