|
Sunday, May 7, 2017, 2030ET
Market Timing Charts, Analysis & Commentary for Issue #191
Timer Charts of S&P-500 Cash Index (SPX) + NASDAQ-100 Cash Index (NDX)
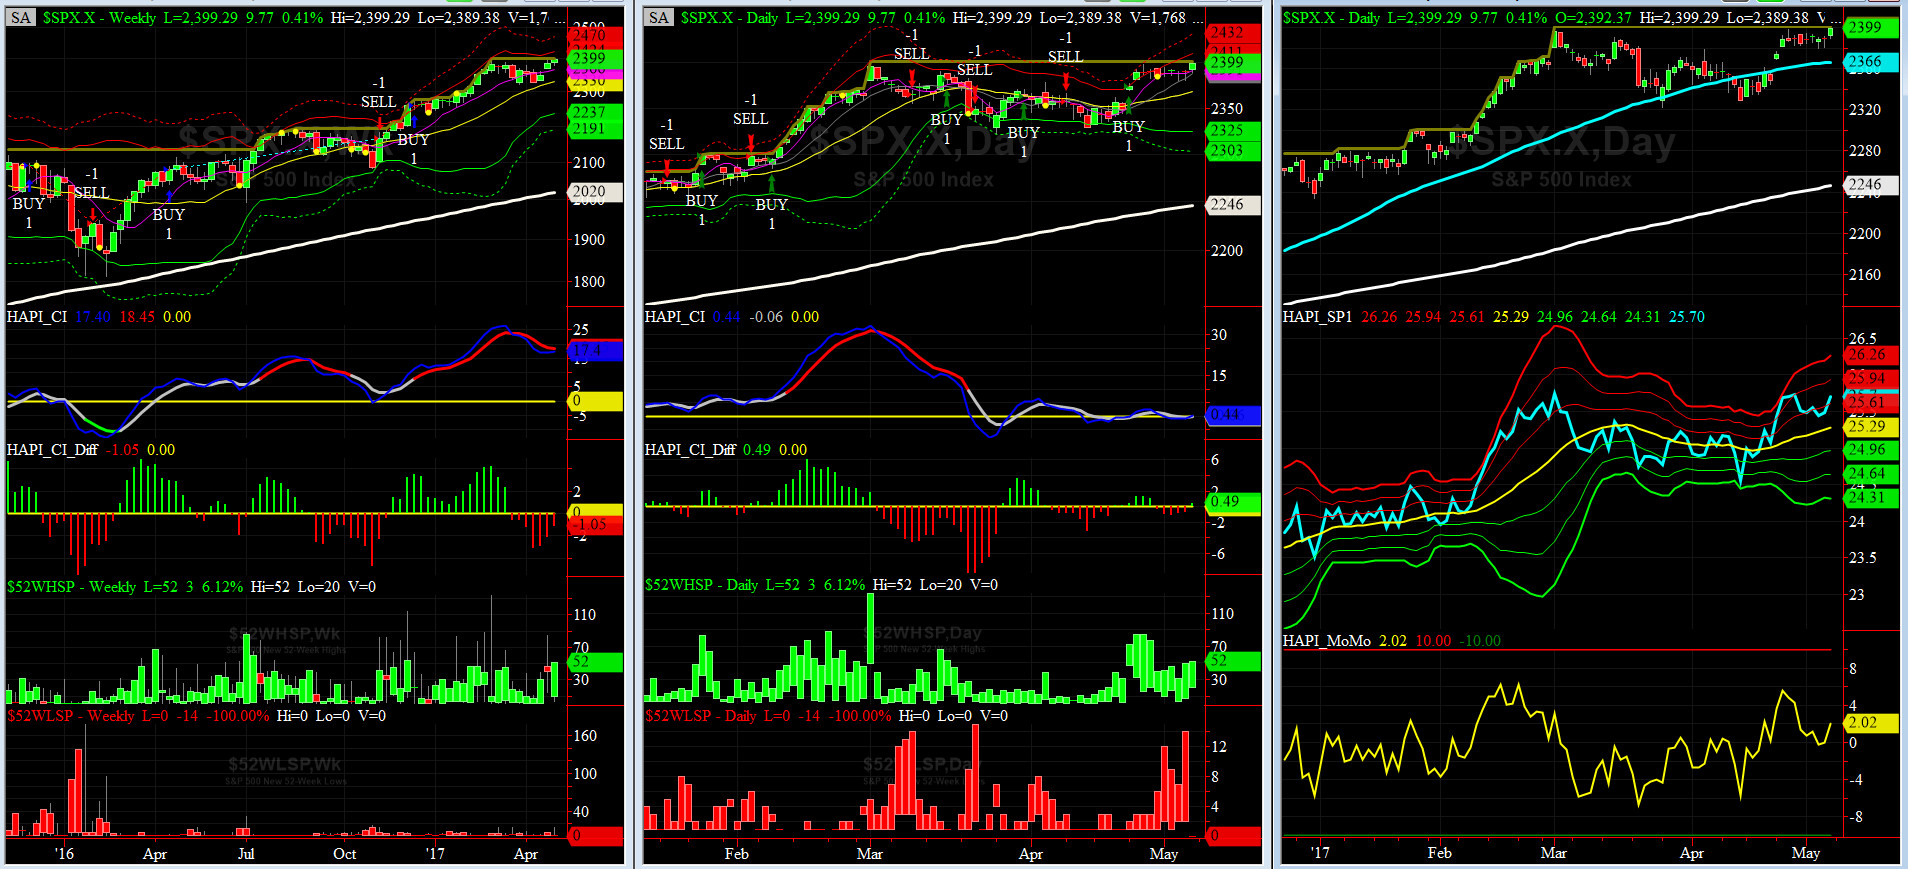
Most recent S&P-500 Cash Index (SPX): 2399.29 up +15.09 (up +0.6%) for the week ending Friday, May 5, 2017, which closed at about its +1.5 sigma.
SPX ALL TIME INTRADAY HIGH = 2400.98 (reached on Wednesday, March 1, 2017)
SPX ALL TIME CLOSING HIGH = 2399.29 (reached on Friday, May 5, 2017)
Current DAILY +2 Sigma SPX = 2411 with WEEKLY +2 Sigma = 2424
Current DAILY 0 Sigma (20 day MA) SPX = 2368 with WEEKLY 0 Sigma = 2330
Current DAILY -2 Sigma SPX = 2325 with WEEKLY -2 Sigma = 2237
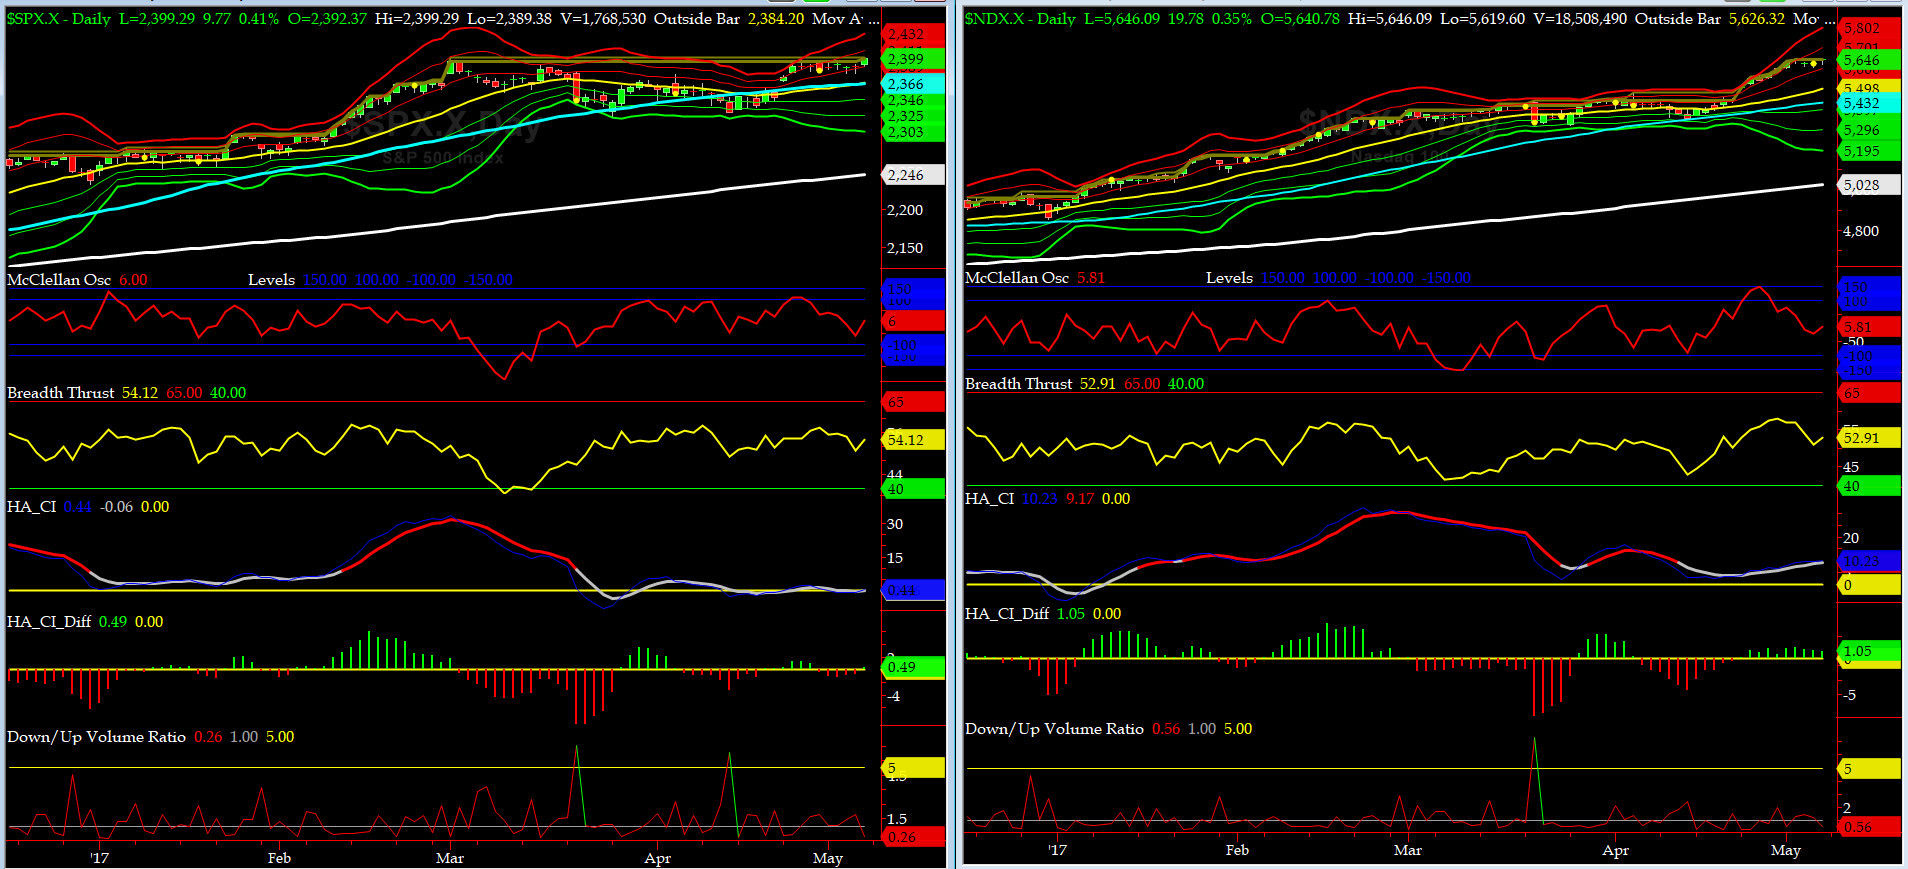
NYSE McClellan Oscillator = +6 (-150 is start of the O/S area; around -275 to -300 area or lower, we go into the �launch-pad� mode, over +150, we are in O/B area)
NYSE Breadth Thrust = 54.1 (40 is considered as oversold and 65 as overbought)
As of this writing, markets have dodged a missile as Emmanuel Macron of En Marche! defeated Marine Le Pen of Front National in French election and for now EU & Euro are "safe" but French/EU/Euro problems are not over and that battle shall be fought at a later date.
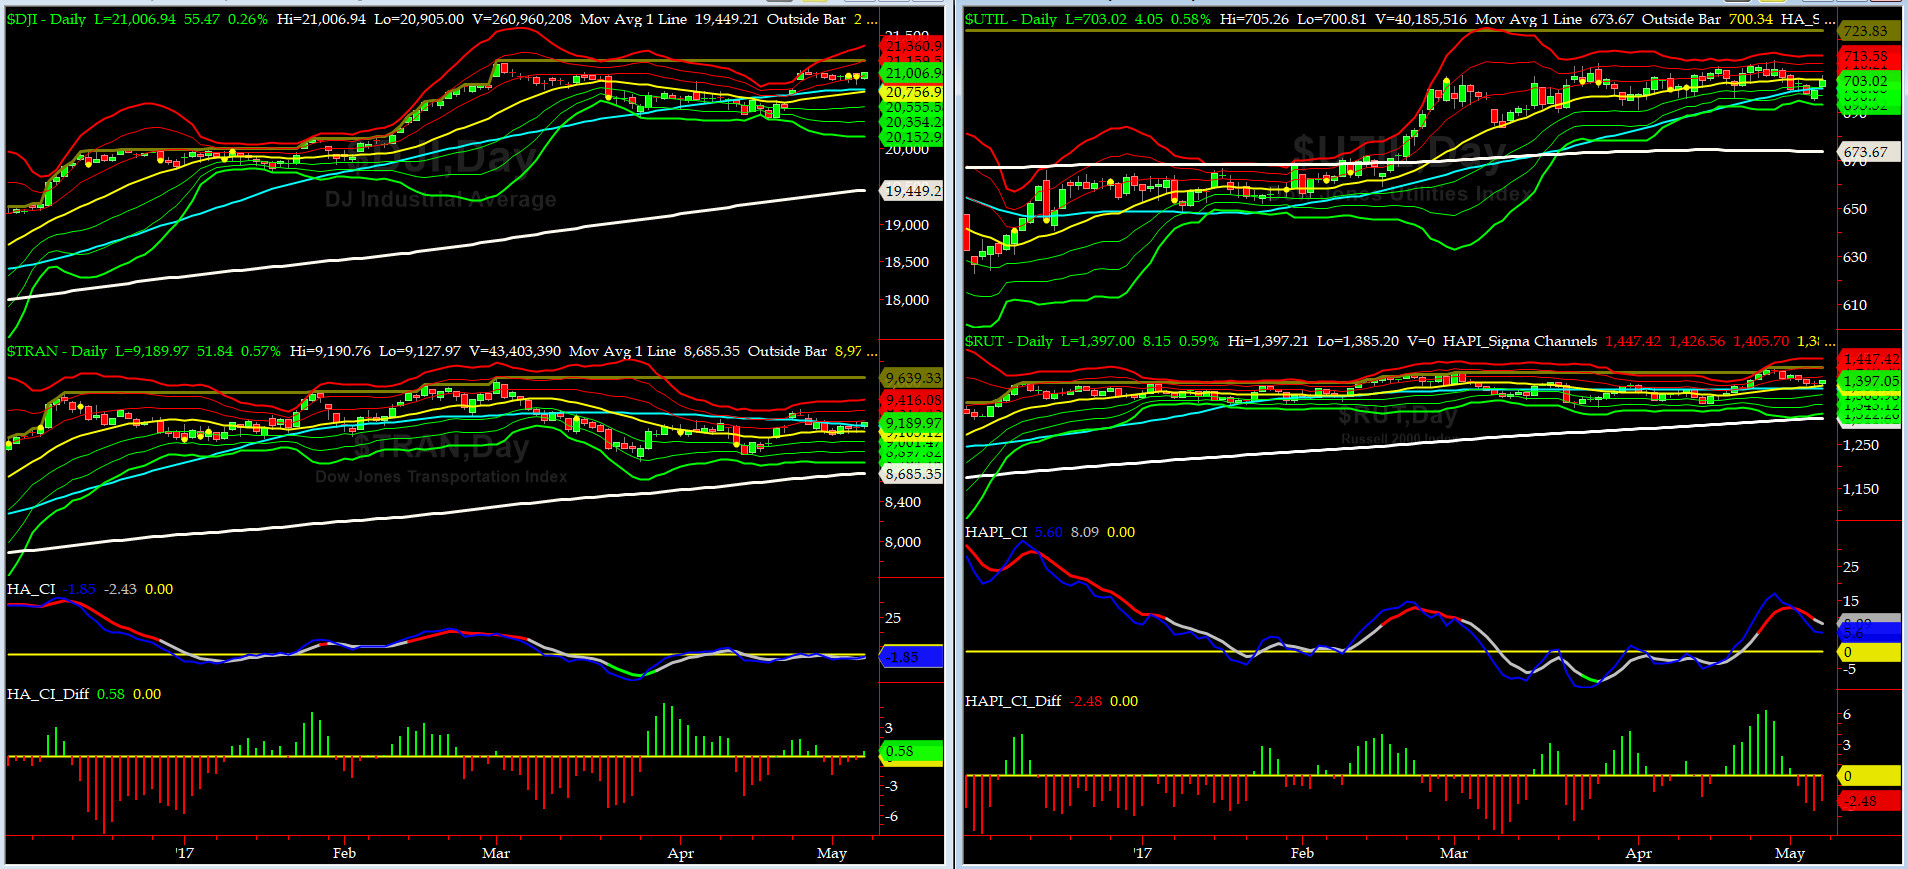
Canaries [in the Coal Mine] Chart for DJ TRAN & RUT Indices
200-Day MA DJ TRAN = 8685 or 5.8% below DJ TRAN (max observed in last 5 yrs = 20.2%, min = -20.3%)
200-Day MA RUT = 1311 or 6.6% below RUT (max observed in last 5 yrs = 21.3%, min = -22.6%)
DJ Transportation Index (proxy for economic conditions 6 to 9 months hence) went sideways for most of last week and closed above it 50-day MA.
Russell 2000 Small Caps Index (proxy for Risk ON/OFF) sank for most of last week till found support at its zero sigma/50-day MA. RISK, in the immortal words of Led Zeppelin is "dazed & confused" for now.....
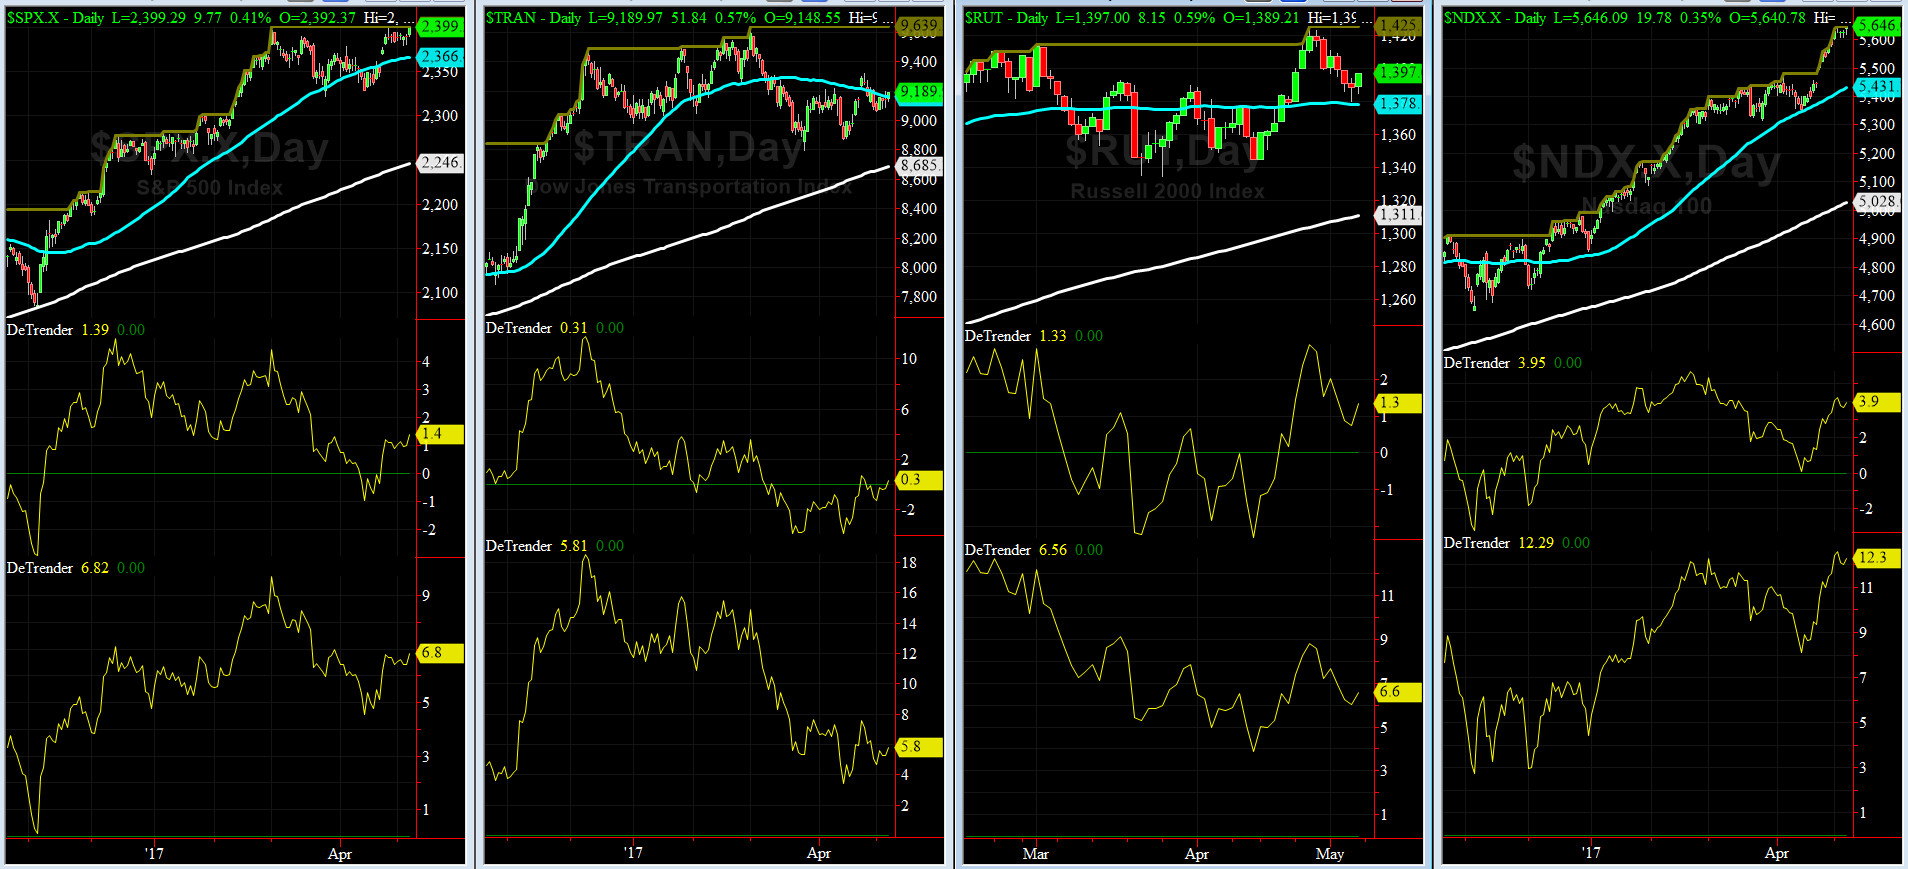
DeTrenders Charts for SPX, NDX, TRAN & RUT Indices
50-Day MA SPX = 2366 or 1.4% below SPX closed on Friday (max observed in last 5 yrs = +8.6%, min = -9.3%)
200-Day MA SPX = 2246 or 6.8% below SPX (max observed in last 5 yrs = 15.2%, min = -14%)
None of our EIGHT DeTrenders are negative. The DeTrenders for DJ Tran & RUT will continue to be harbingers of future price behavior in broad indices.
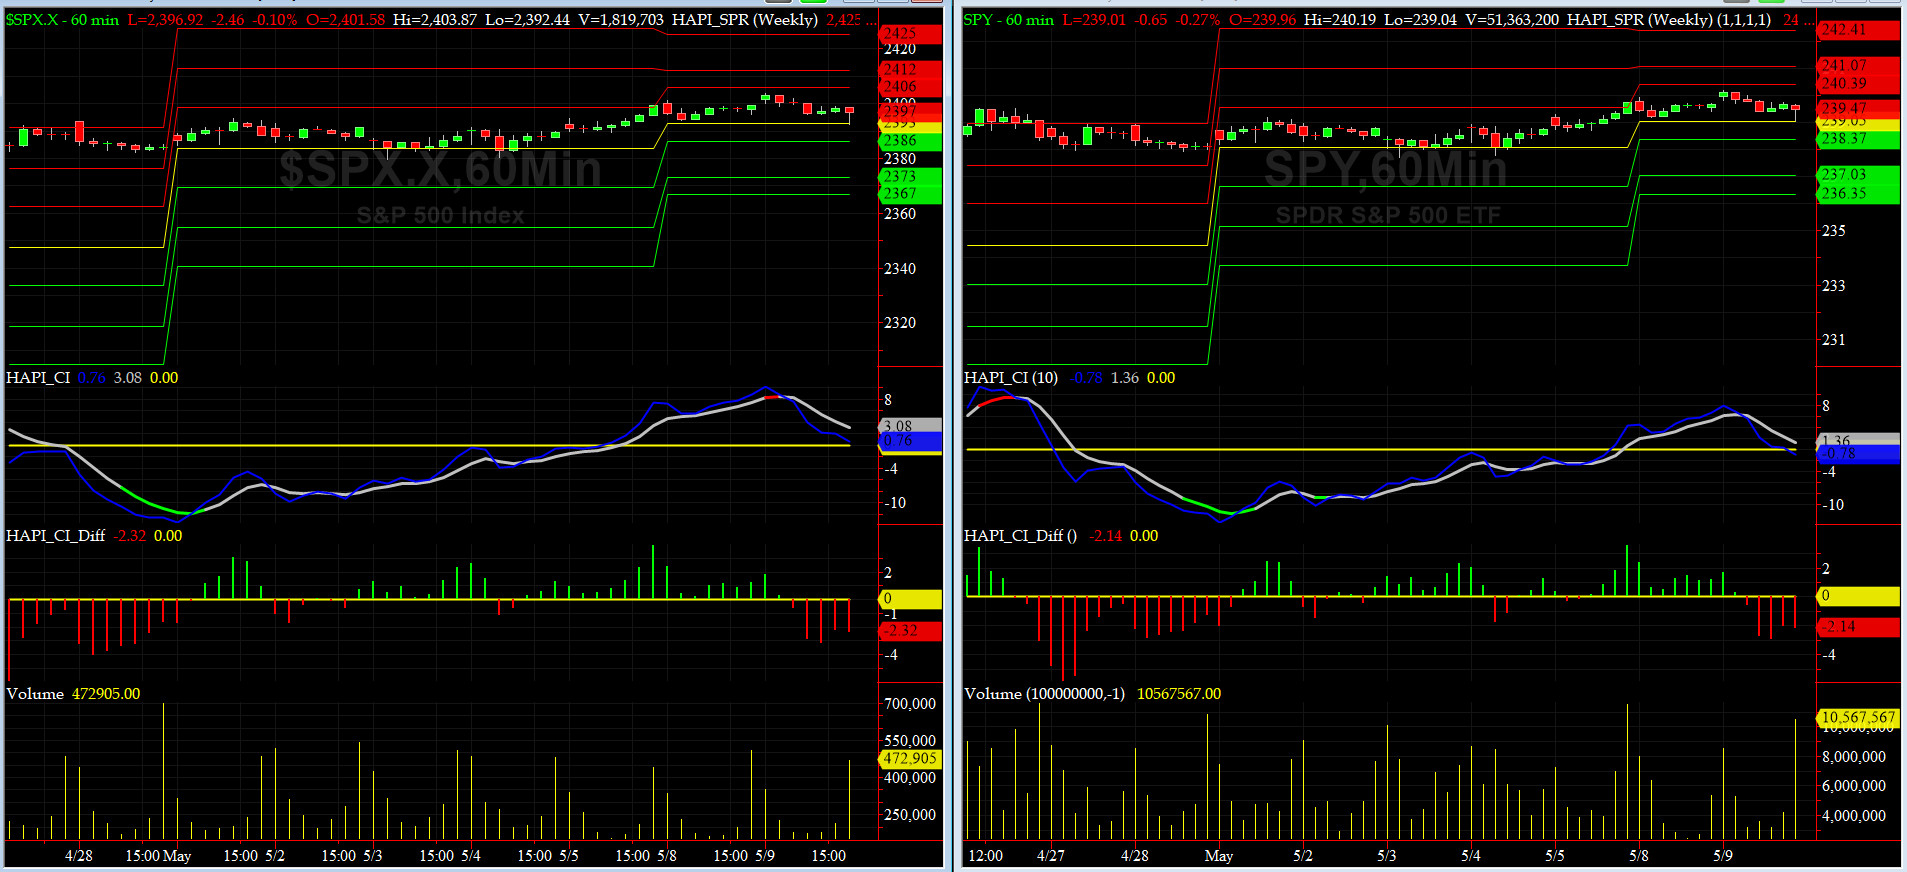
HA_SP1_Momo Chart
WEEKLY Timing Model = on a BUY Signal since Friday 12/16/16 CLOSE at 2258
DAILY Timing Model = on a BUY Signal since Monday 4/24/17 CLOSE at 2374
Max SPX 52wk-highs reading last week = 52 (over 120-140, the local maxima is in)
Max SPX 52wk-Lows reading last week = 14 (over 40-60, the local minima is in)
HA_SP1 at just above its +1 sigma channels
HA_Momo = +2 (reversals most likely occur above +10 or below -10)
Vol of the Vols Chart
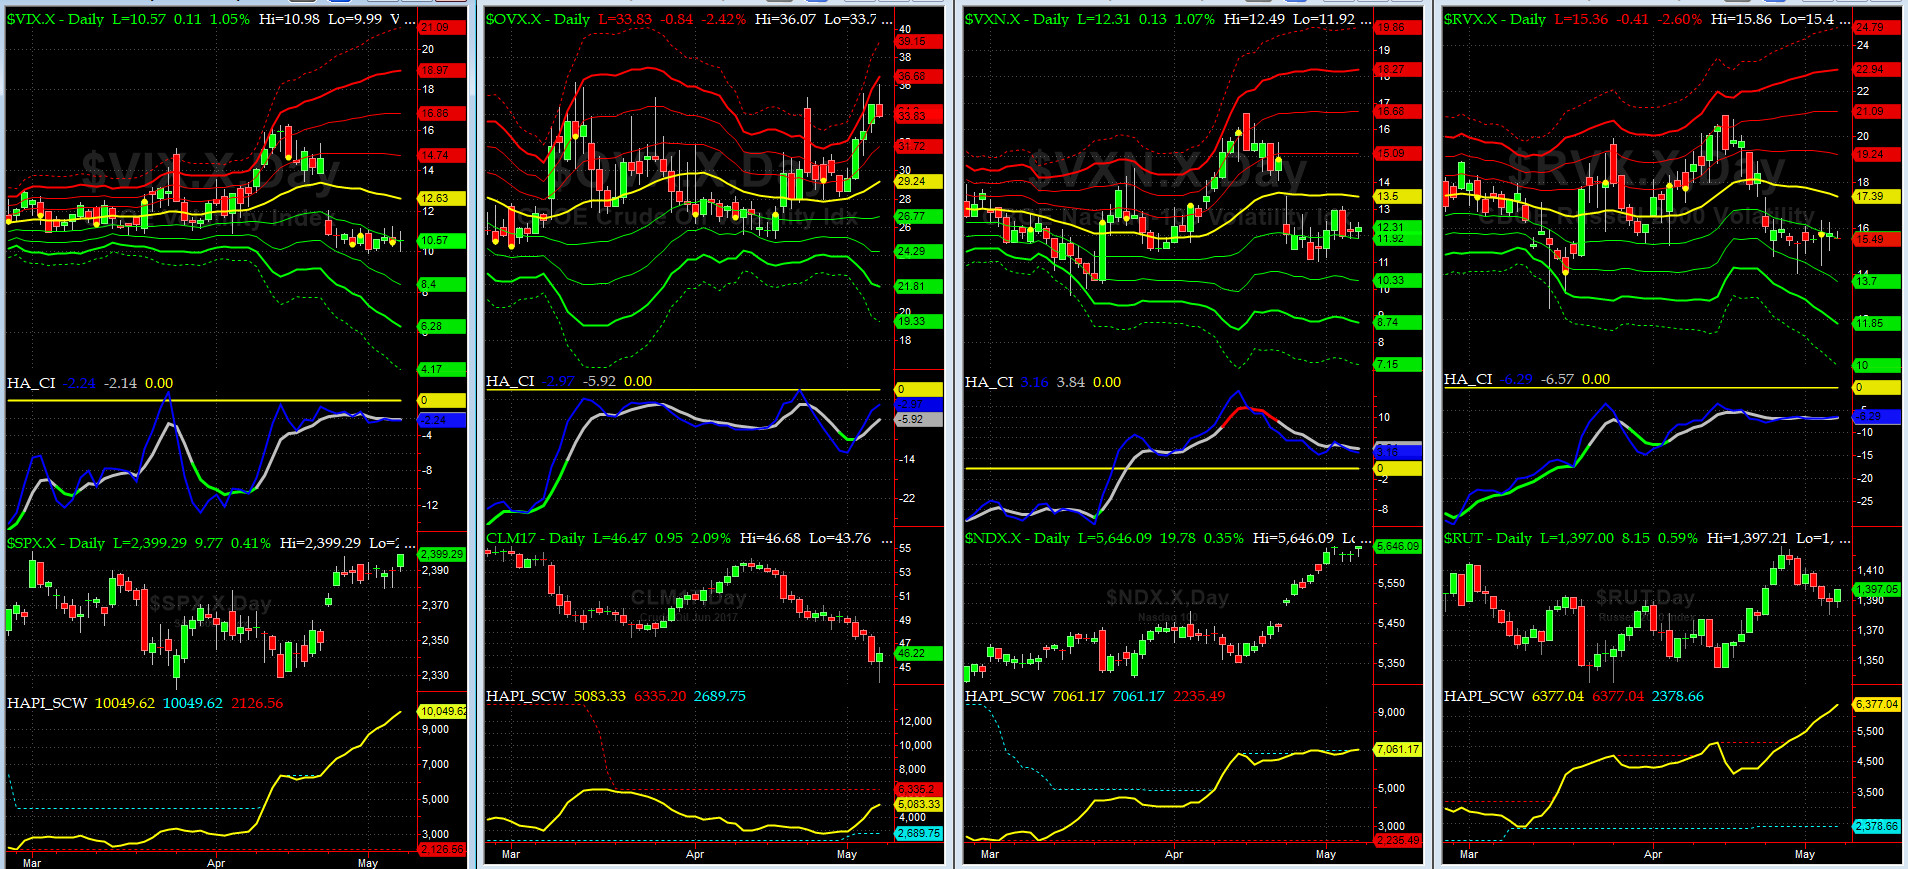
VIX is currently stands at 10.57, or just at its -1 sigma (remember it�s the VIX�s volatility pattern (its sigma channels) that matters, and not the level of VIX itself (this is per Dr. Robert Whaley, a great mentor and the inventor of original VIX, now called VXO). VIX usually peaks around a test of its +4 sigma).
Lat Monday SPOT VIX traded in single digits. This shall pass too......

5-day TRIN & TRINQ Charts
Both of our 5-day TRINs are at or near NEUTRAL zones here. No Signal as of now.

Components of SPX above their respective 200day MA Chart
This scoring indicator after testing 72% came back up and closed at 75%.
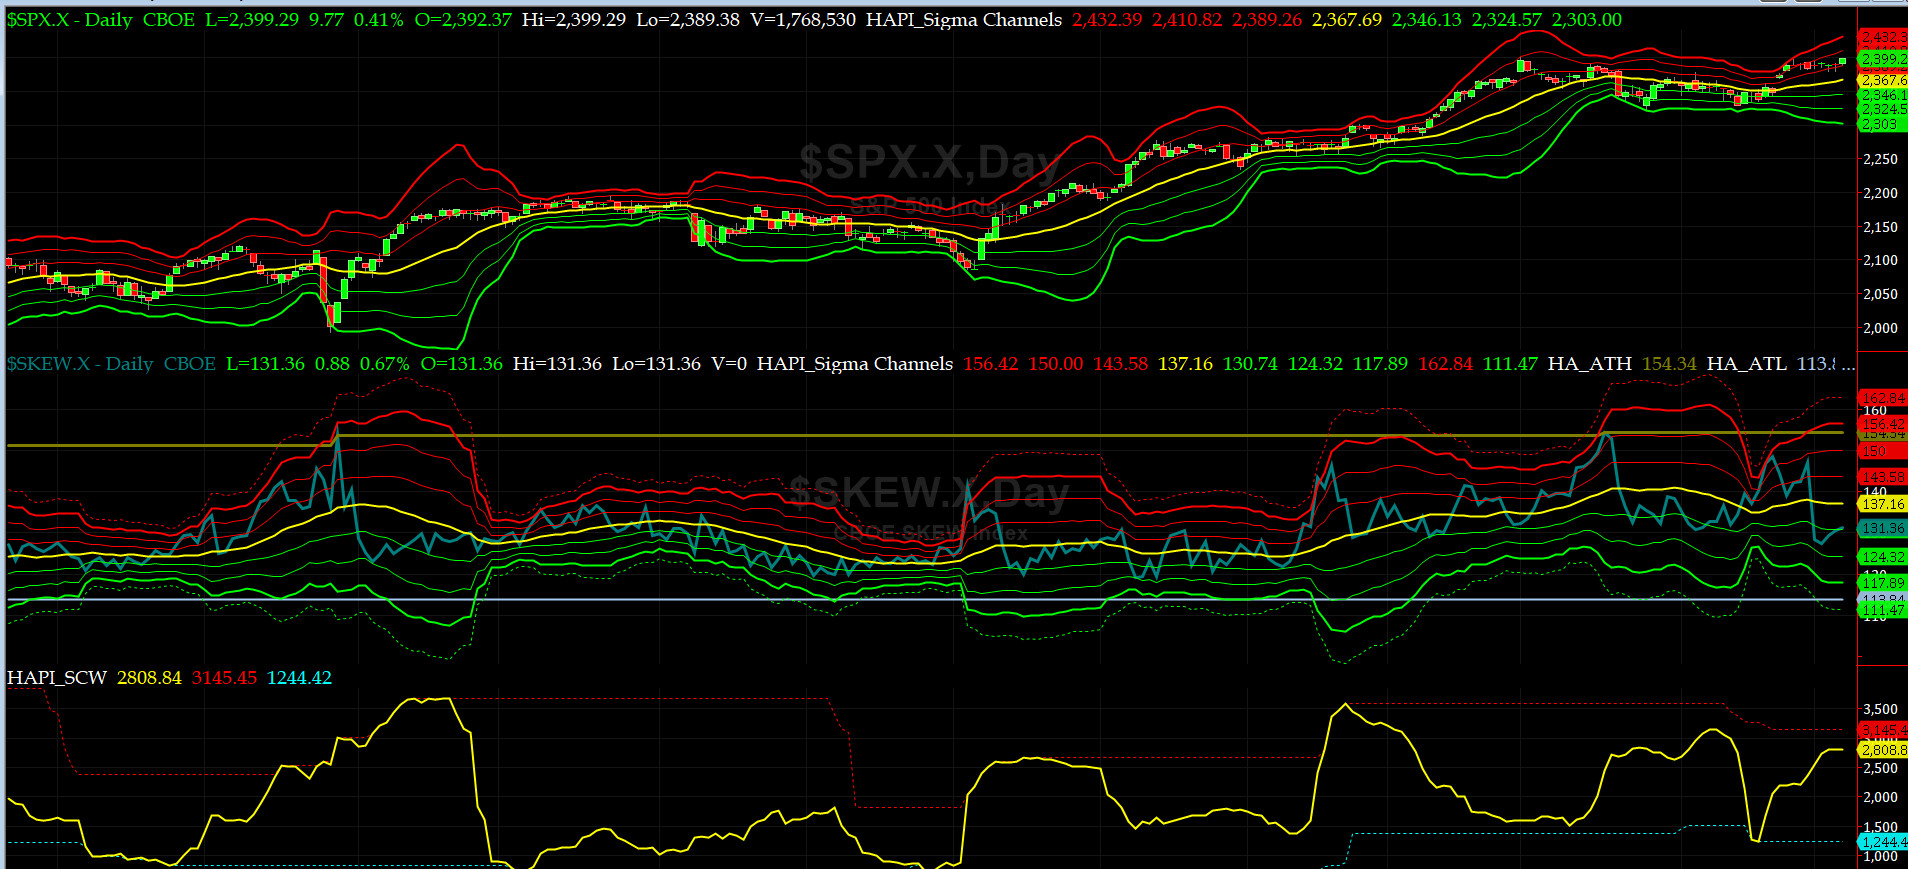
SPX SKEW (Tail Risk) Chart
Last week SPX SKEW (Tail Risk) gave back hard and then stabilized at 131 (normal = 120-125, range 100-150).
Is all quiet on the Eastern & Mid-Western Fronts? Smart Money thinks YES. Do we? Don't ask and we won't tell (LOL).
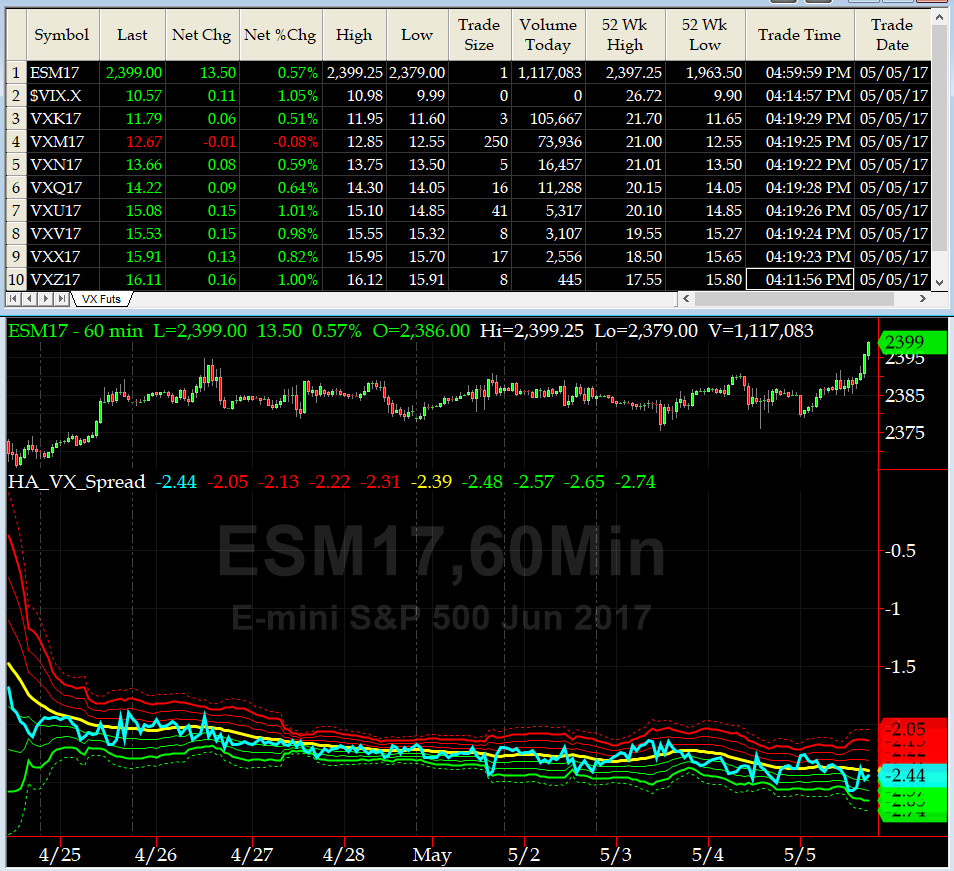
3-month VIX Futures Spread(VX) Chart
Our VX Spread (LONG MAY SHORT AUG) stayed flat-lined this week between -2.2 & -2.6, and, finally ended up at -2.44. This is still a NEUTRAL signal, for now.
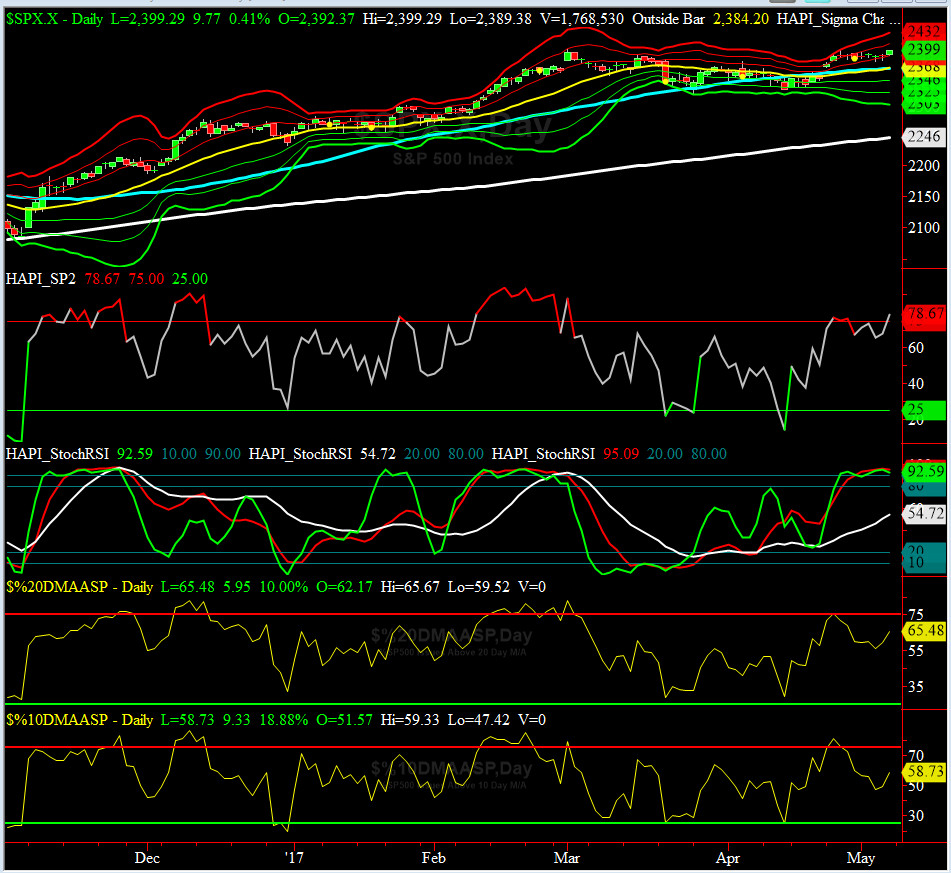
HA_SP2 Chart
HA_SP2 = 76.7 (Buy signal <= 25, Sell Signal >= 75)
We are in the OVERBOUGHT zone right now, but we could remain overbought for a while.
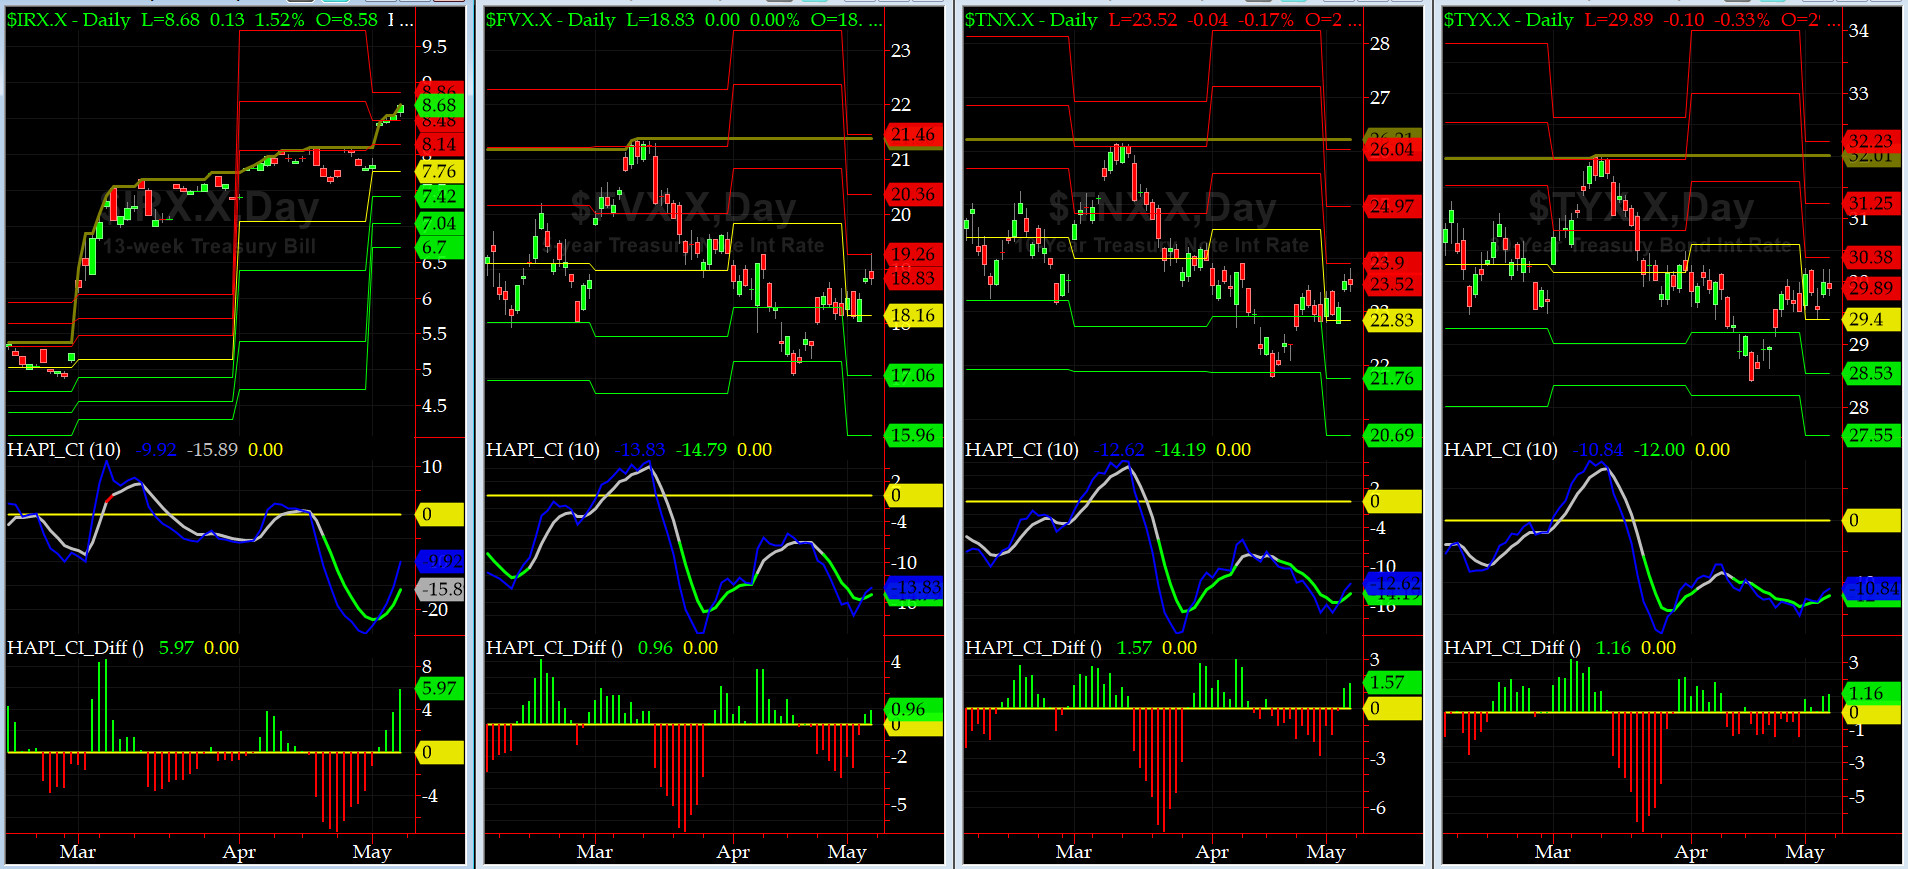
US Treasury T-Notes & T-Bonds Yields Chart
This past week, the US Bond Market sold off and pushed up the YTMs across the board.
Fari Hamzei
|


 Proactive Market Timing