|
Monday, May 29, 2017, 2330ET
Market Timing Charts, Analysis & Commentary for Issue #194
Timer Charts of S&P-500 Cash Index (SPX) + NASDAQ-100 Cash Index (NDX)
Most recent S&P-500 Cash Index (SPX): 2415.82 up +34.09 (up +1.43%) for the week ending Friday, May 26, 2017, which closed just below its +2 sigma.
SPX ALL TIME INTRADAY HIGH = 2418.71 (reached on Thursday, May 25, 2017)
SPX ALL TIME CLOSING HIGH = 2415.82 (reached on Friday, May 26, 2017)
Current DAILY +2 Sigma SPX = 2421 with WEEKLY +2 Sigma = 2432
Current DAILY 0 Sigma (20 day MA) SPX = 2394 with WEEKLY 0 Sigma = 2351
Current DAILY -2 Sigma SPX = 2367 with WEEKLY -2 Sigma = 2270
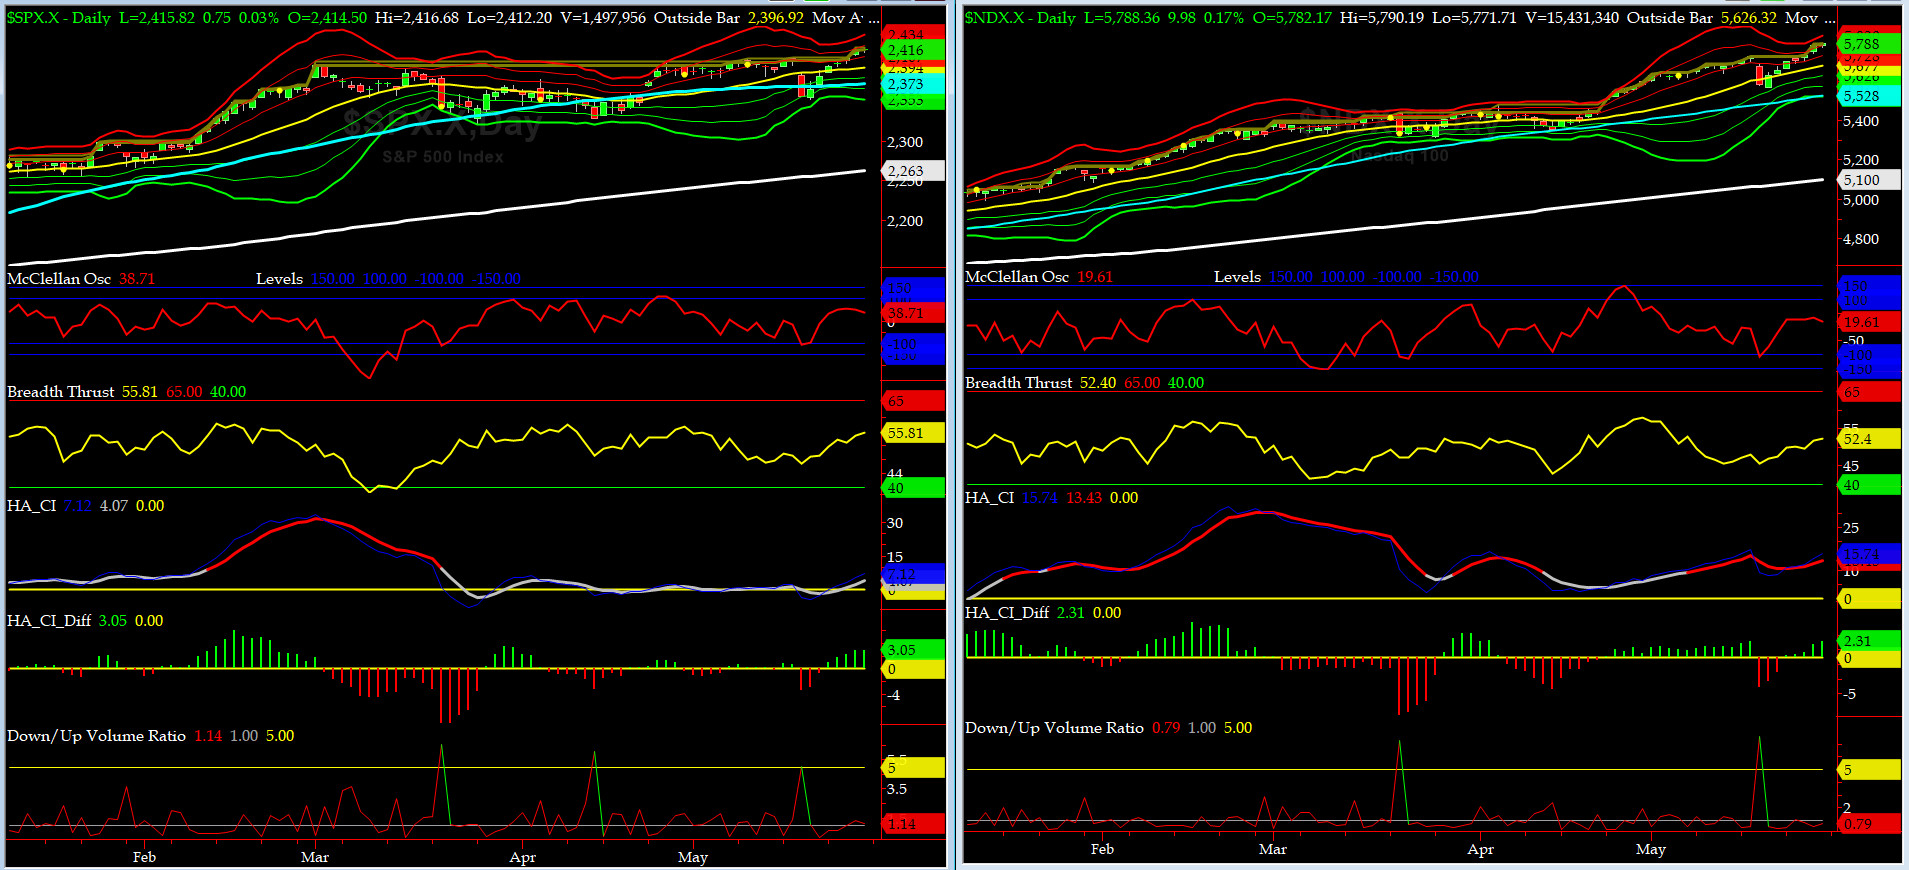
NYSE McClellan Oscillator = +39 (-150 is start of the O/S area; around -275 to -300 area or lower, we go into the �launch-pad� mode, over +150, we are in O/B area)
NYSE Breadth Thrust = 55.80 (40 is considered as oversold and 65 as overbought)
The market rebounded and went to new highs after suffering its worst week of 2017. Our beloved SWG is the new Teflon Don.
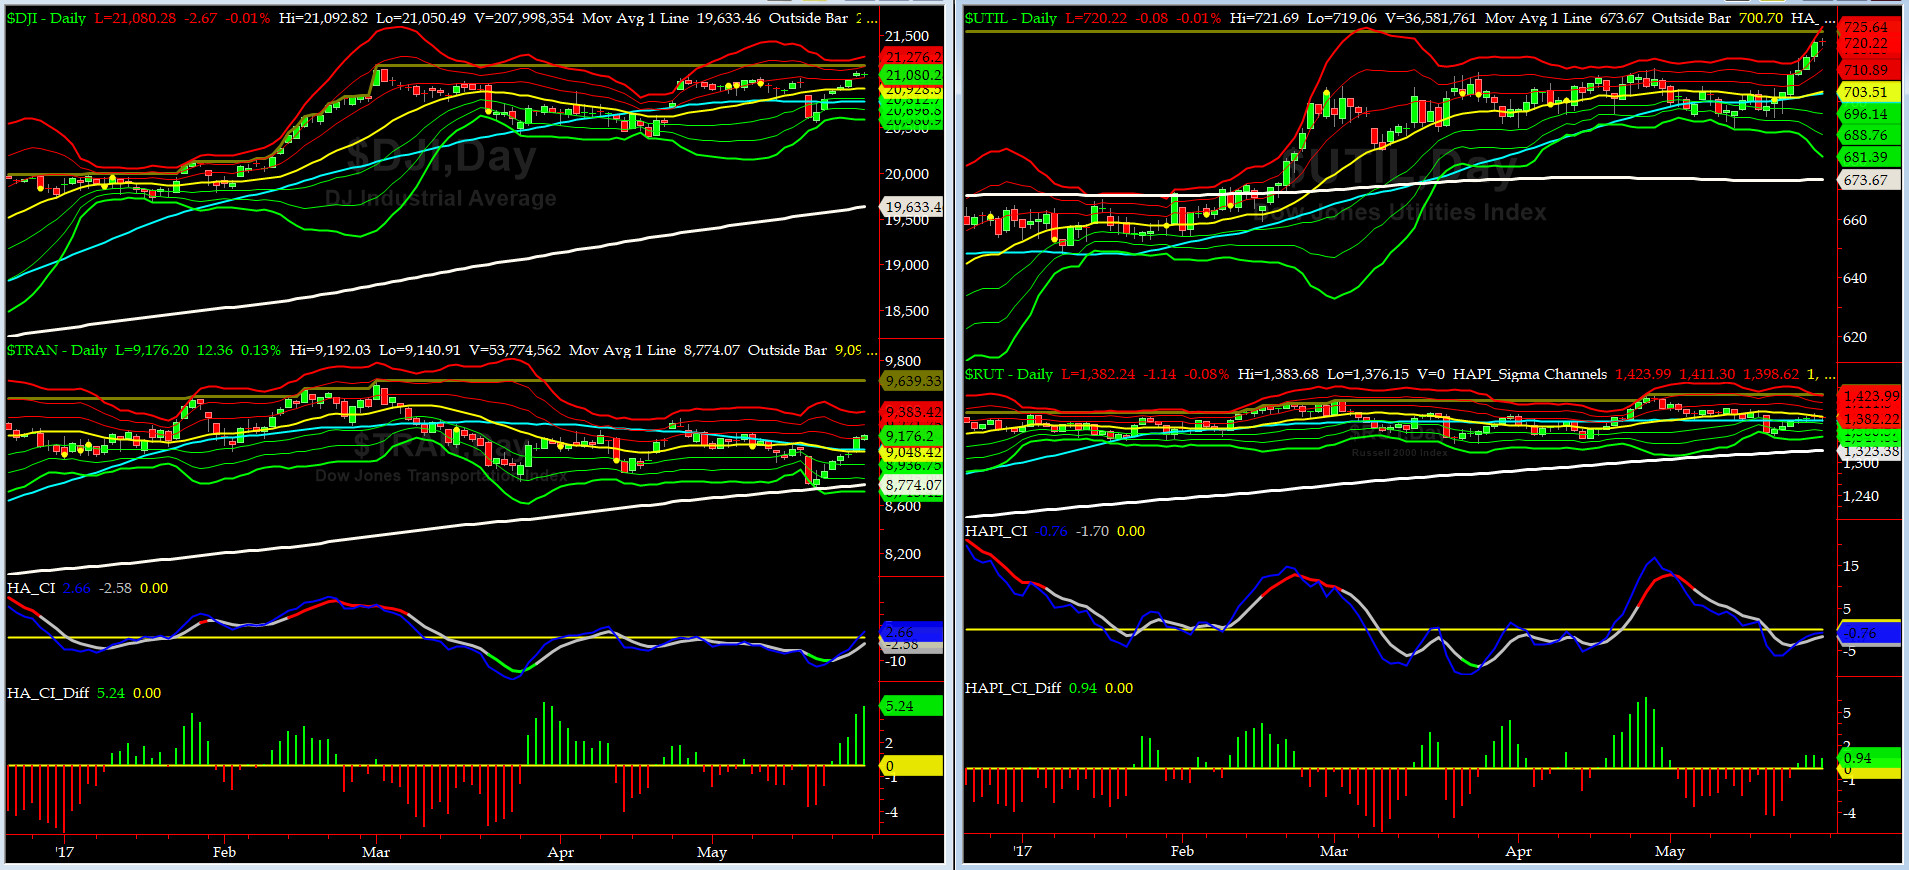
Canaries [in the Coal Mine] Chart for DJ TRAN & RUT Indices
200-Day MA DJ TRAN = 8774 or 4.6% below DJ TRAN (max observed in last 5 yrs = 20.2%, min = -20.3%)
200-Day MA RUT = 1323 or 4.4% below RUT (max observed in last 5 yrs = 21.3%, min = -22.6%)
DJ Transportation Index (proxy for economic conditions 6 to 9 months hence) rallied hard off of its 200-day MA but remains 5% below its ATH.
Russell 2000 Small Caps Index (proxy for Risk ON/OFF) hovered near its 50day MA.
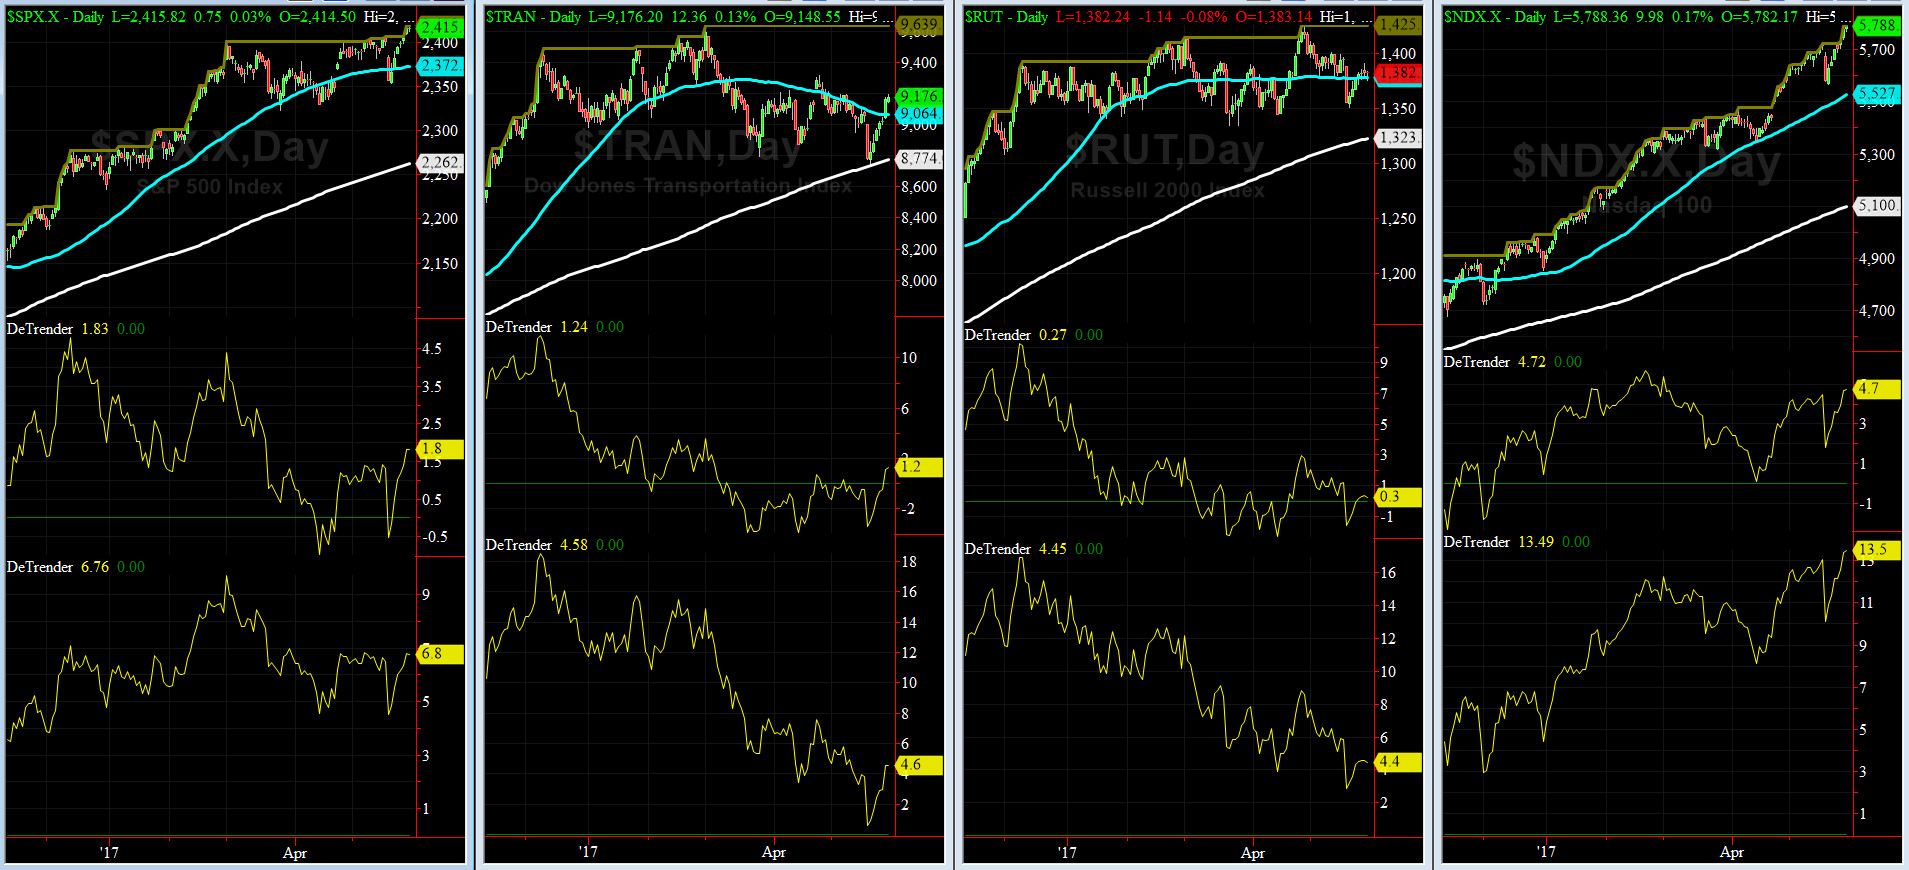
DeTrenders Charts for SPX, NDX, TRAN & RUT Indices
50-Day MA SPX = 2368 or 1.8% below SPX closed on Friday (max observed in last 5 yrs = +8.6%, min = -9.3%)
200-Day MA SPX = 2251 or 6.8% below SPX (max observed in last 5 yrs = 15.2%, min = -14%)
None of our EIGHT DeTrenders is negative. The DeTrenders for DJ Tran & RUT will continue to be harbingers of future price behavior in broad indices.
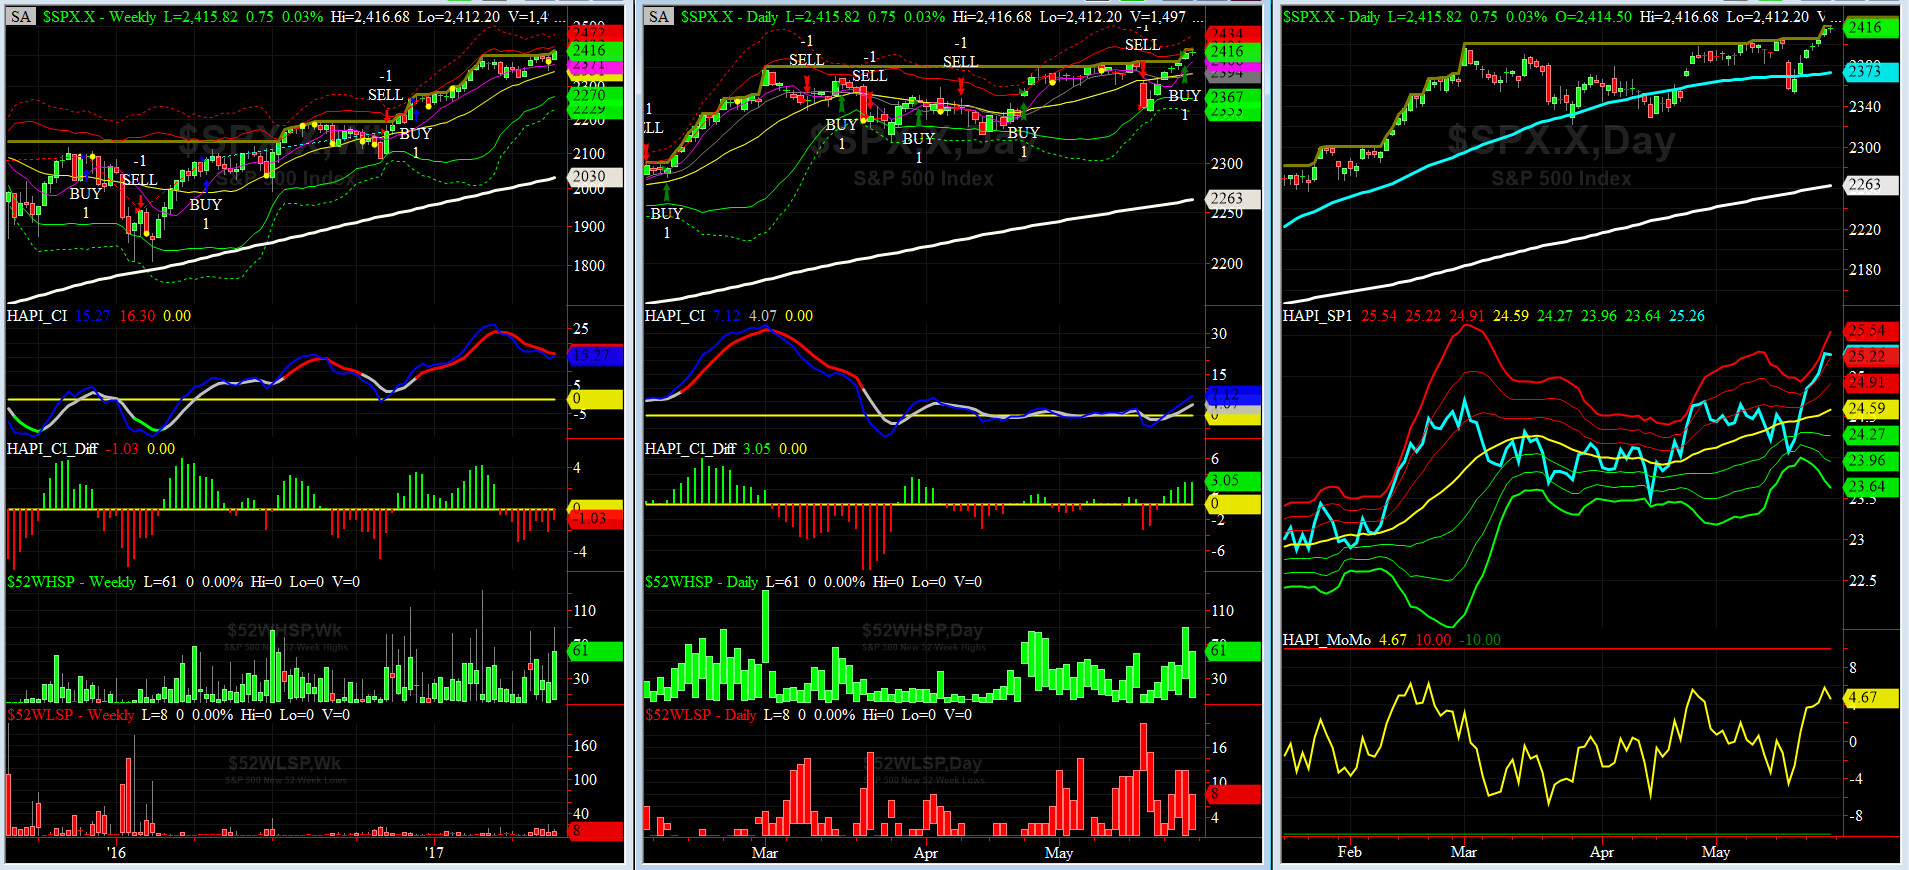
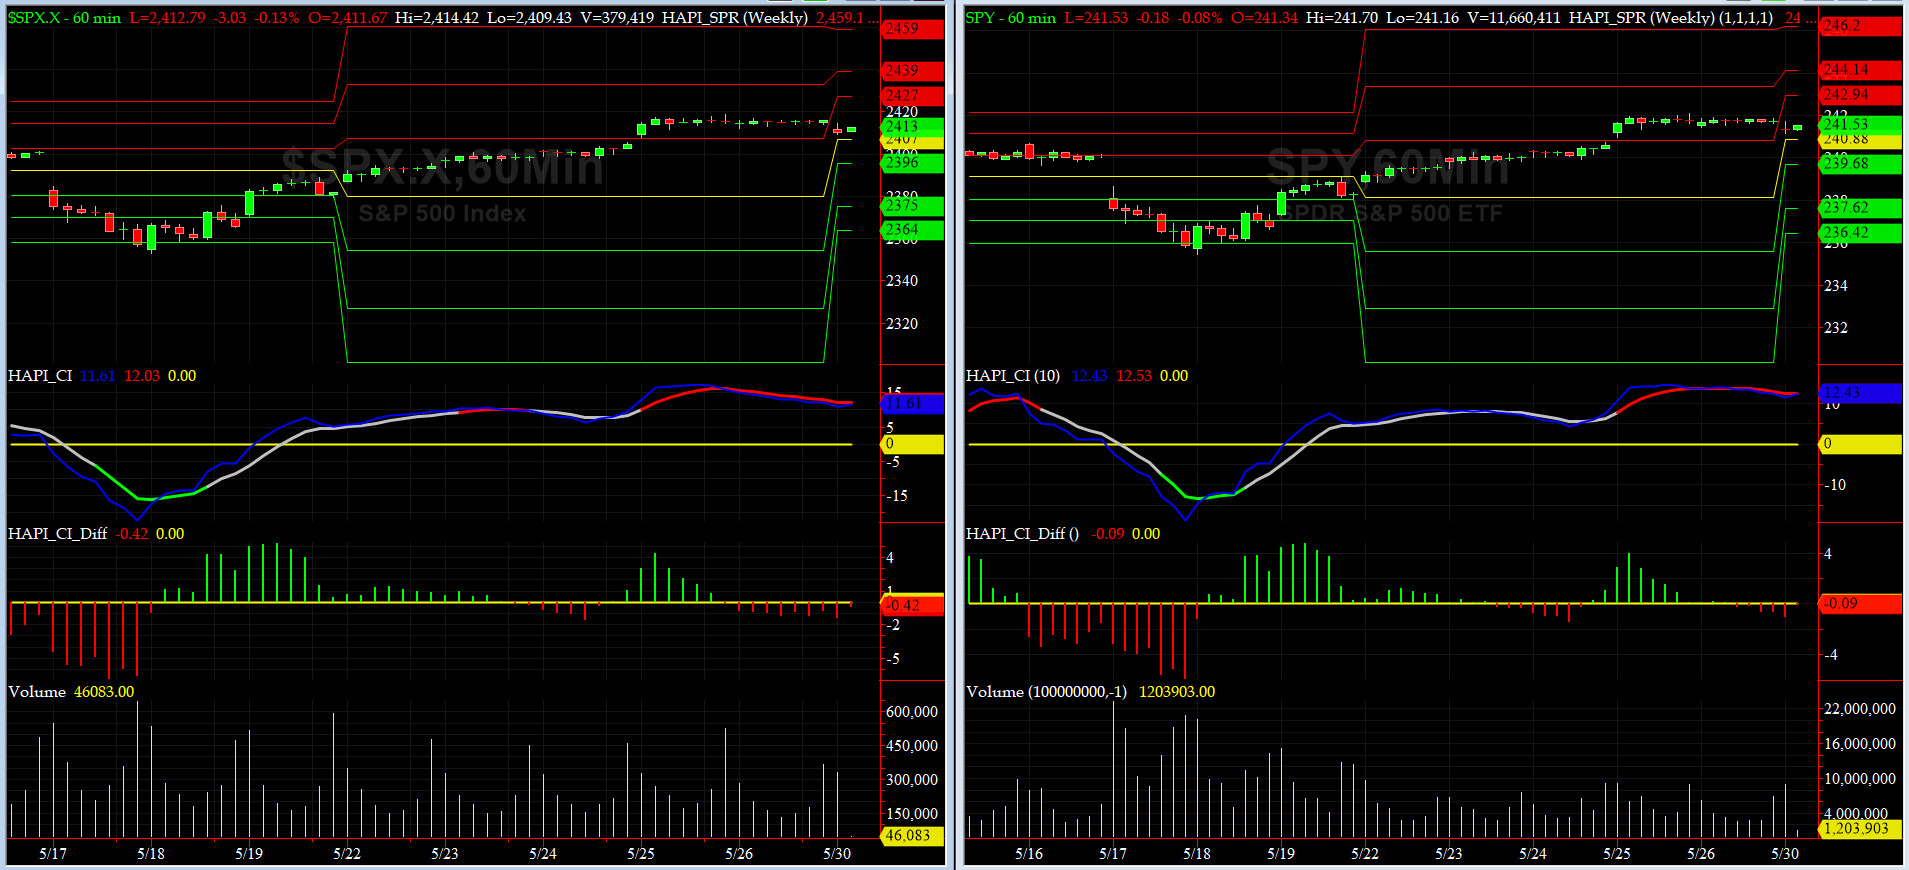
HA_SP1_Momo Chart
WEEKLY Timing Model = on a BUY Signal since Friday 12/16/16 CLOSE at 2258
DAILY Timing Model = on a BUY Signal since Thursday 5/25/17 CLOSE at 2415
Max SPX 52wk-highs reading last week = 90 (over 120-140, the local maxima is in)
Max SPX 52wk-Lows reading last week = 12 (over 40-60, the local minima is in)
HA_SP1 at just above its +2 sigma channels
HA_Momo = +4.7 (reversals most likely occur above +10 or below -10)
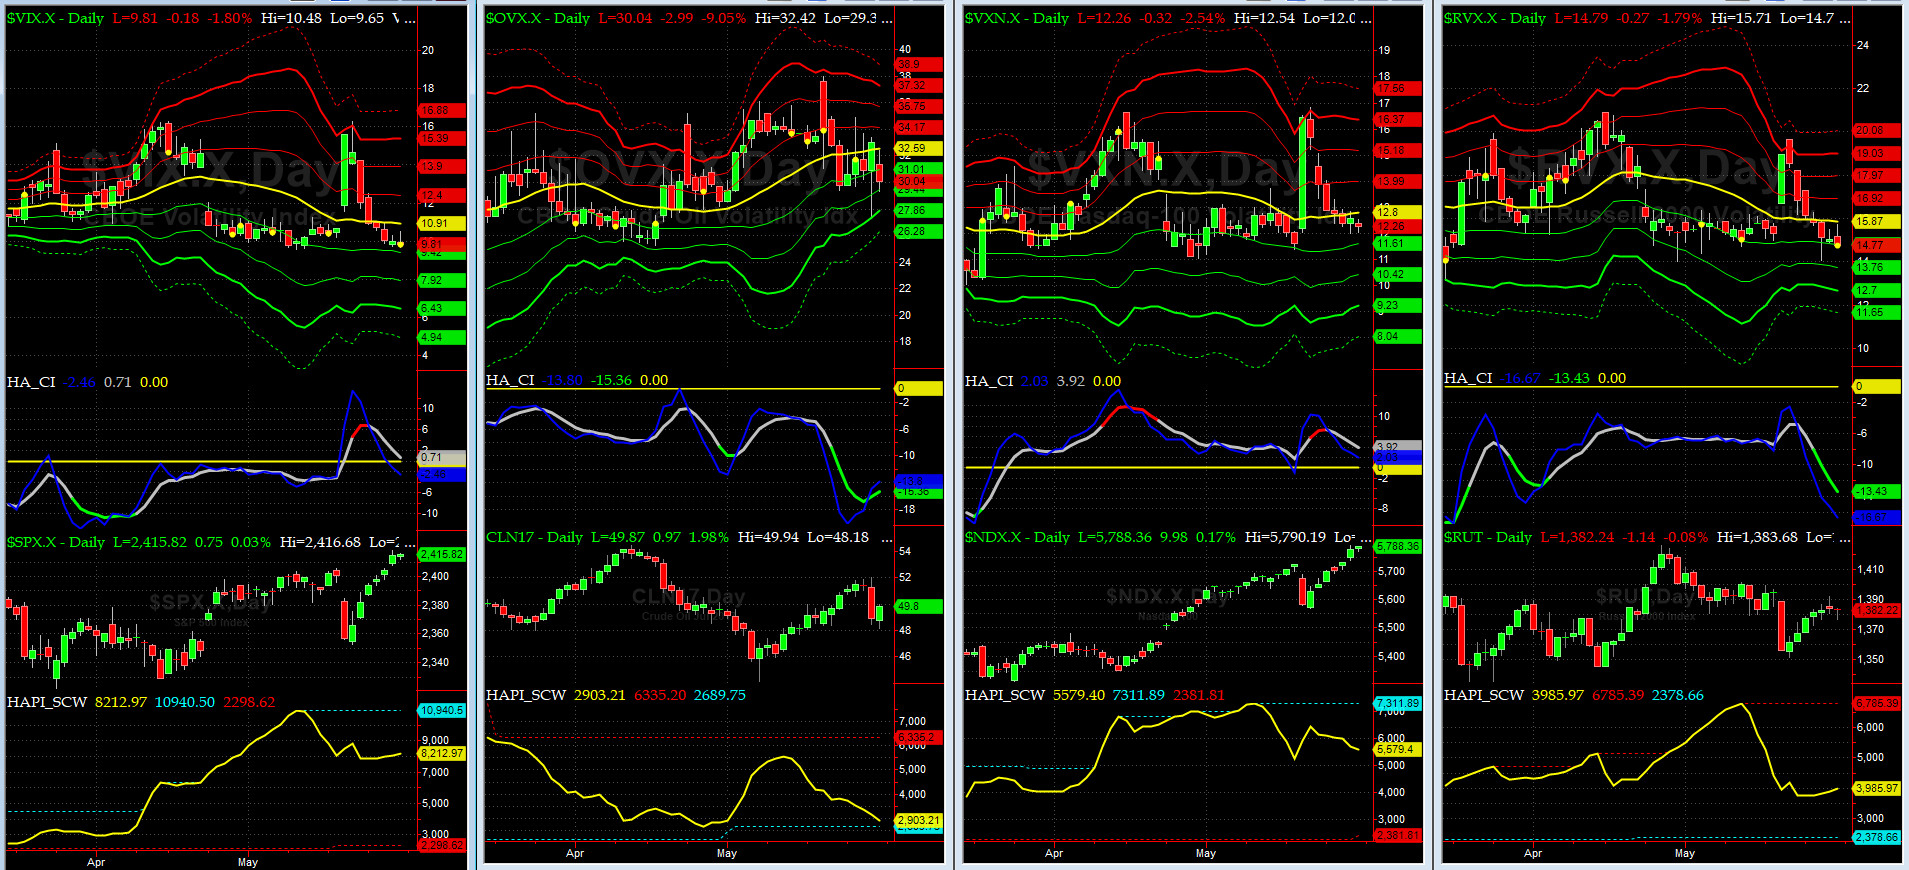
Vol of the Vols Chart
VIX currently stands at 9.8, or just above its -1 sigma ( remember it's the VIX volatility pattern ( its sigma channels) that matters, and not the level of VIX itself ( this is per Dr. Robert Whaley, a great mentor and inventor of original VIX, now called VXO ). VIX usually peaks around a test of its +4 sigma).
This week, both VIX and VNX (vol for NASDAQ) sold off from their +3 sigmas -- this shockwave is over too, IMHO.
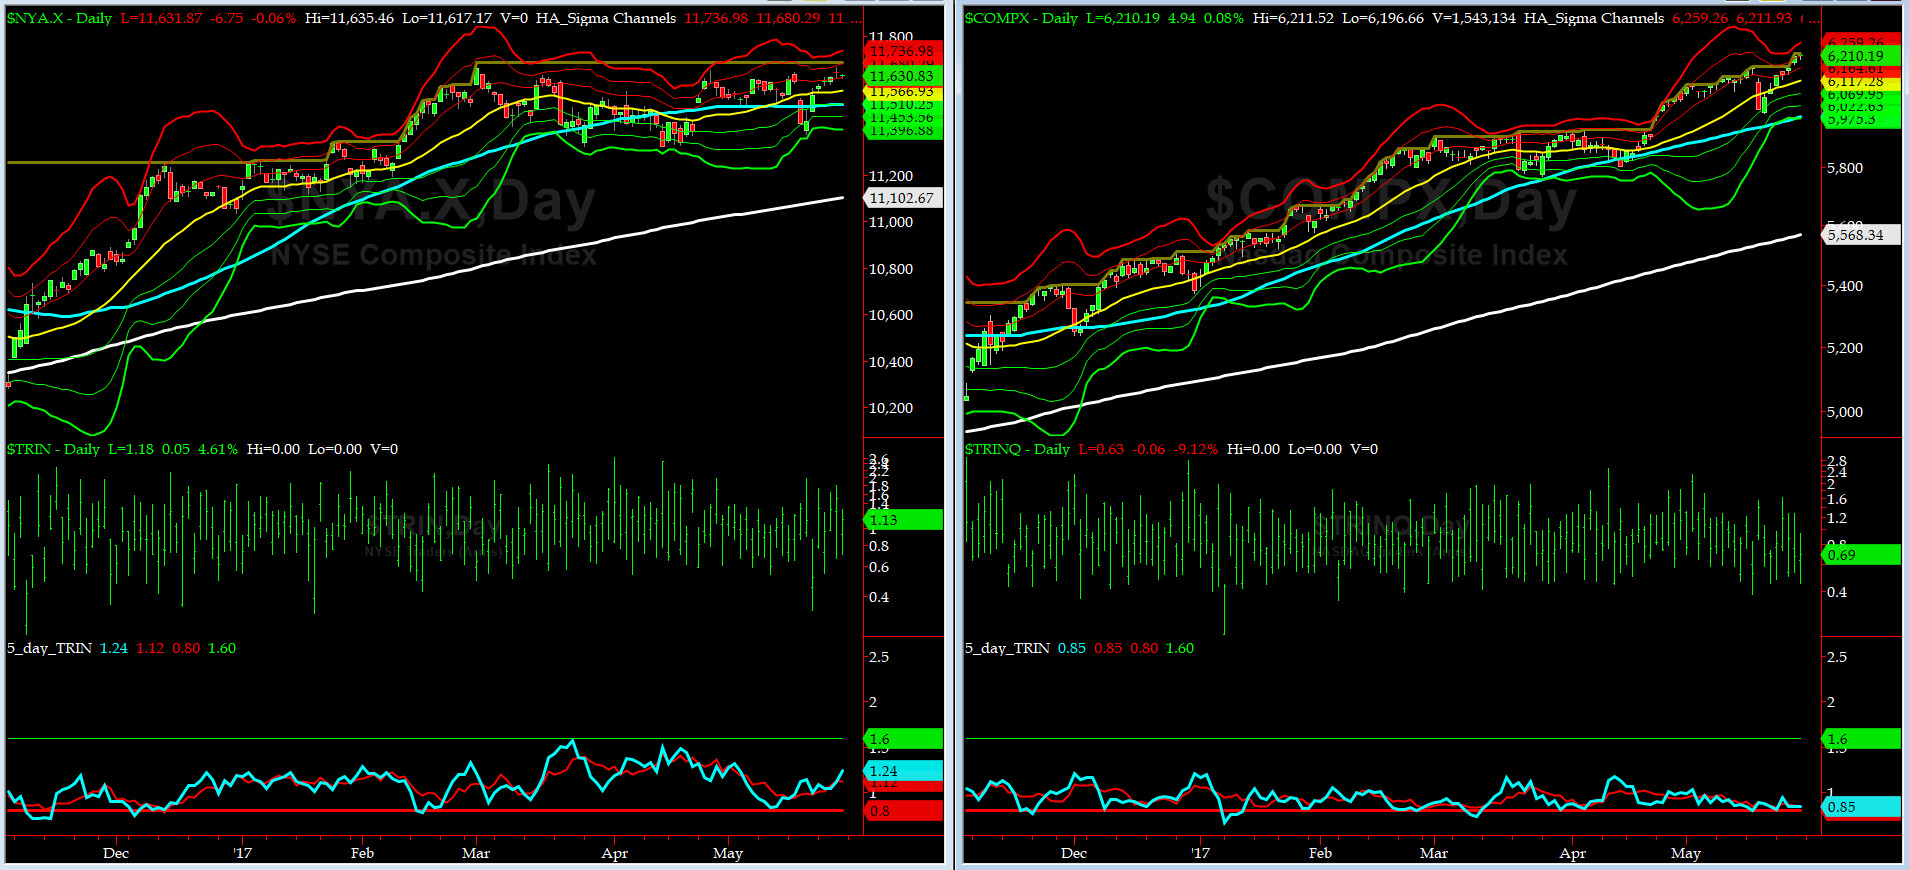
5-day TRIN & TRINQ Charts
NYSE 5-day TRIN is in NEUTRAL zone while the NASDAQ 5-day TRINQ remains in the SELL Zone area.
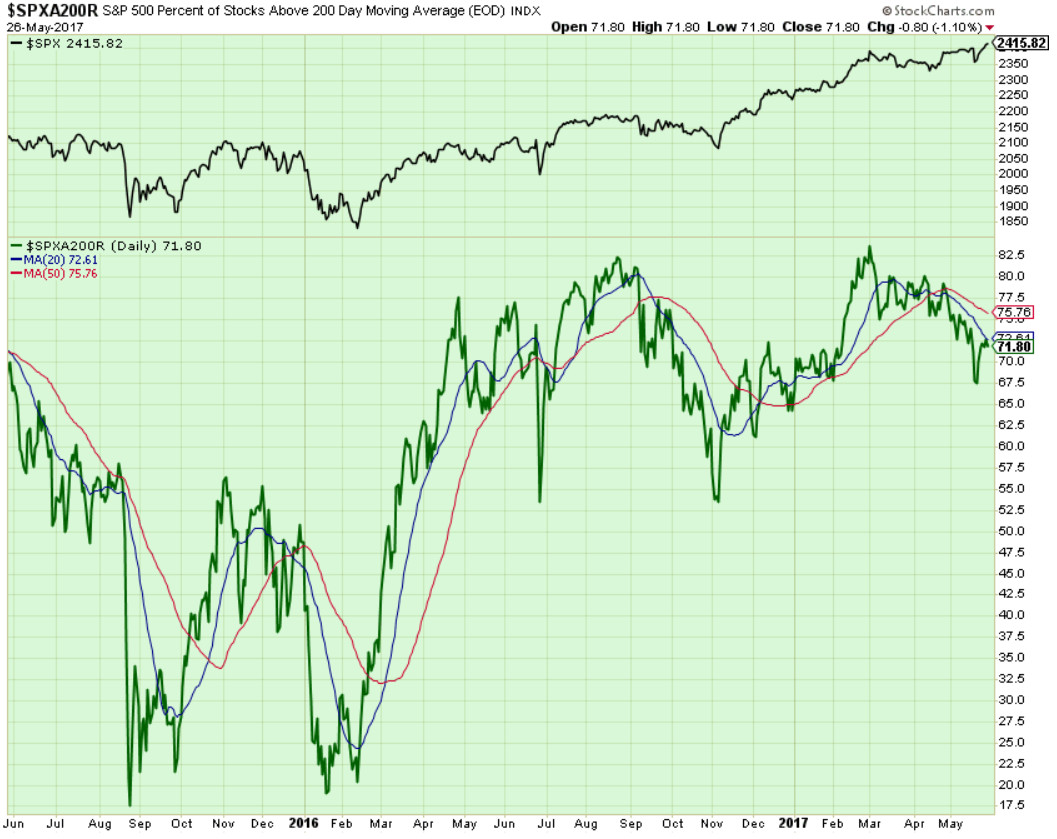
Components of SPX above their respective 200day MA Chart
This scoring indicator while did not test 50% zone, is in an strong divergence with SPX. This is a must watch indicator going forward.
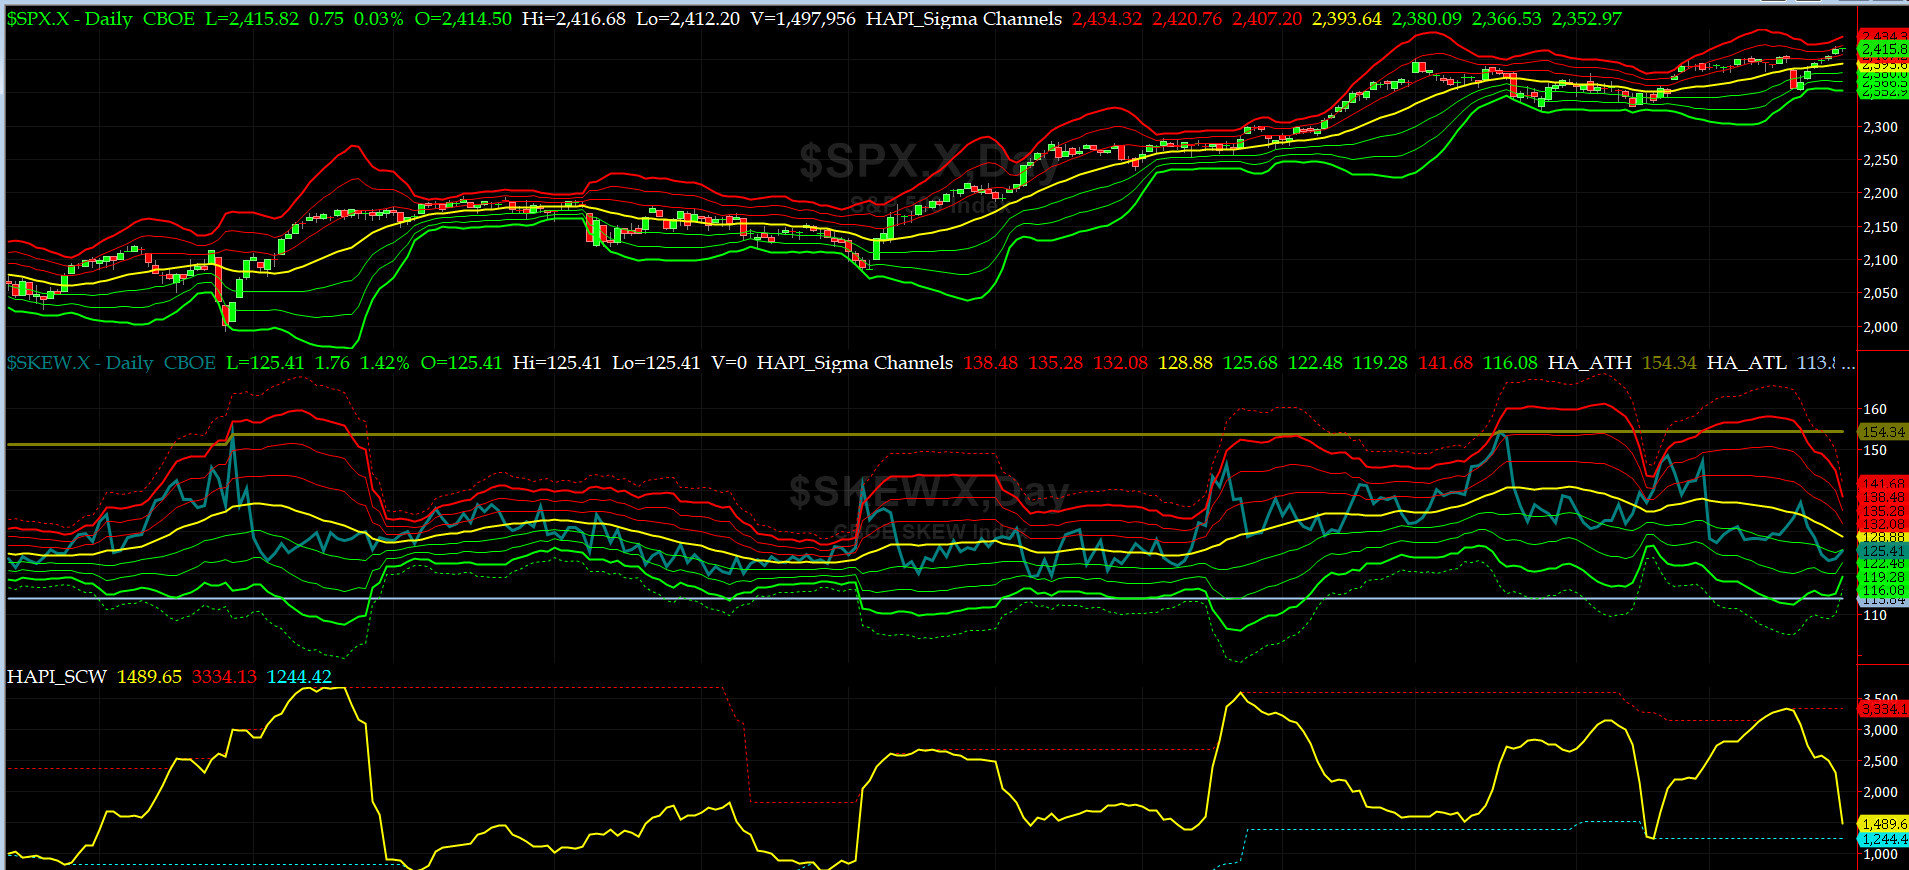
SPX SKEW (Tail Risk) Chart
Last week SPX SKEW (Tail Risk) traded down to 125 closing near its -1 sigma (normal = 120-125, range 100-150).
Are all quiet on the Eastern & Mid-Western Fronts? For now, large market participants think NOT. We shall see soon.
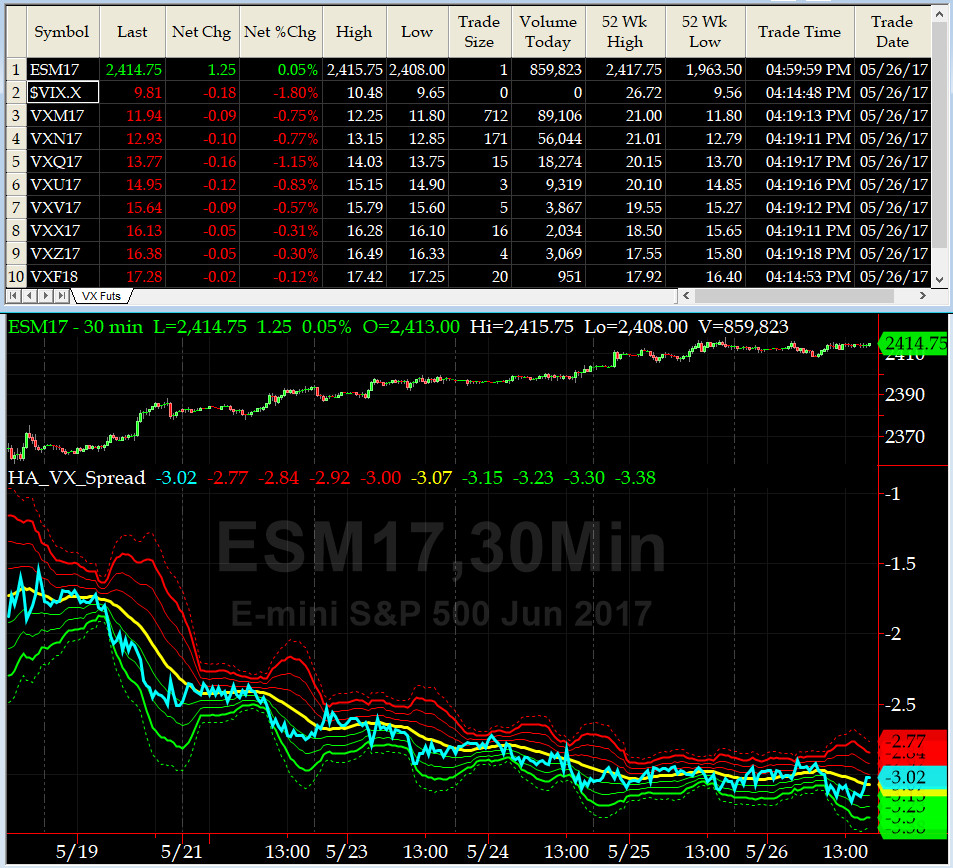
3-month VIX Futures Spread(VX) Chart
Our VX Spread traded near -3 for most of last week. BORING? ubetcha.
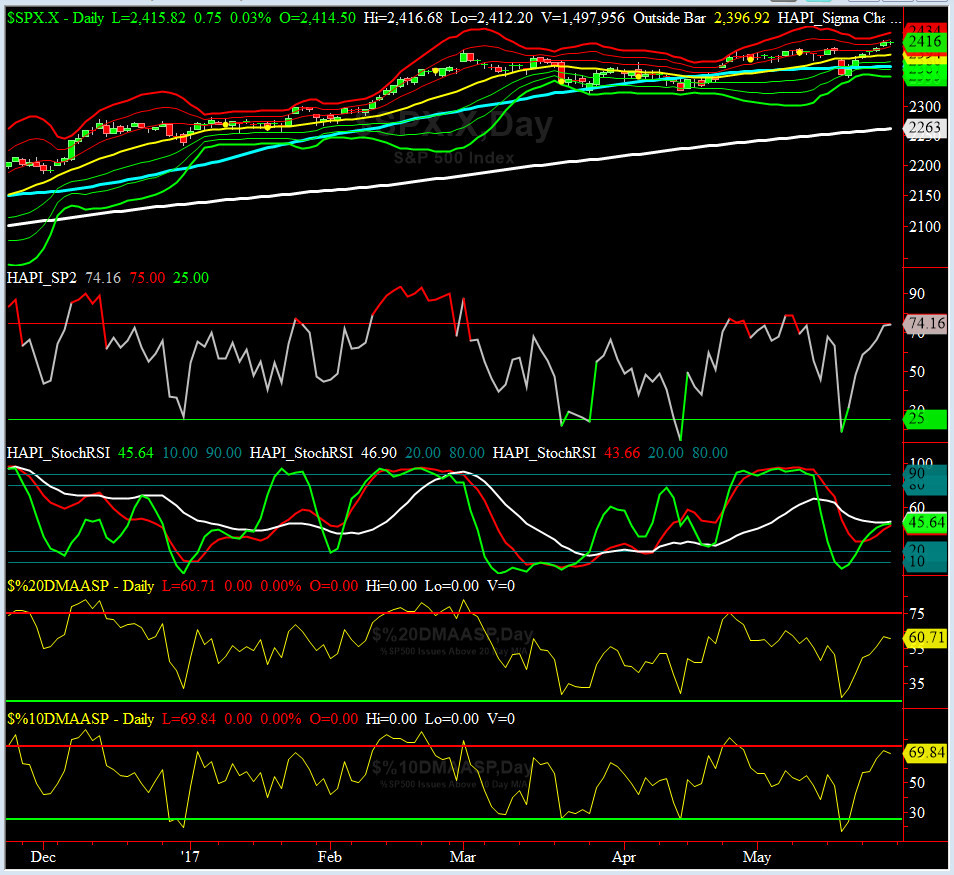
HA_SP2 Chart
HA_SP2 = 74.2 (Buy signal <= 25, Sell Signal >= 75)
We are almost in OVERBOUGHT zone now. Will the markets sell off here? not without a strong negative catalyst is the correct answer, ioho.
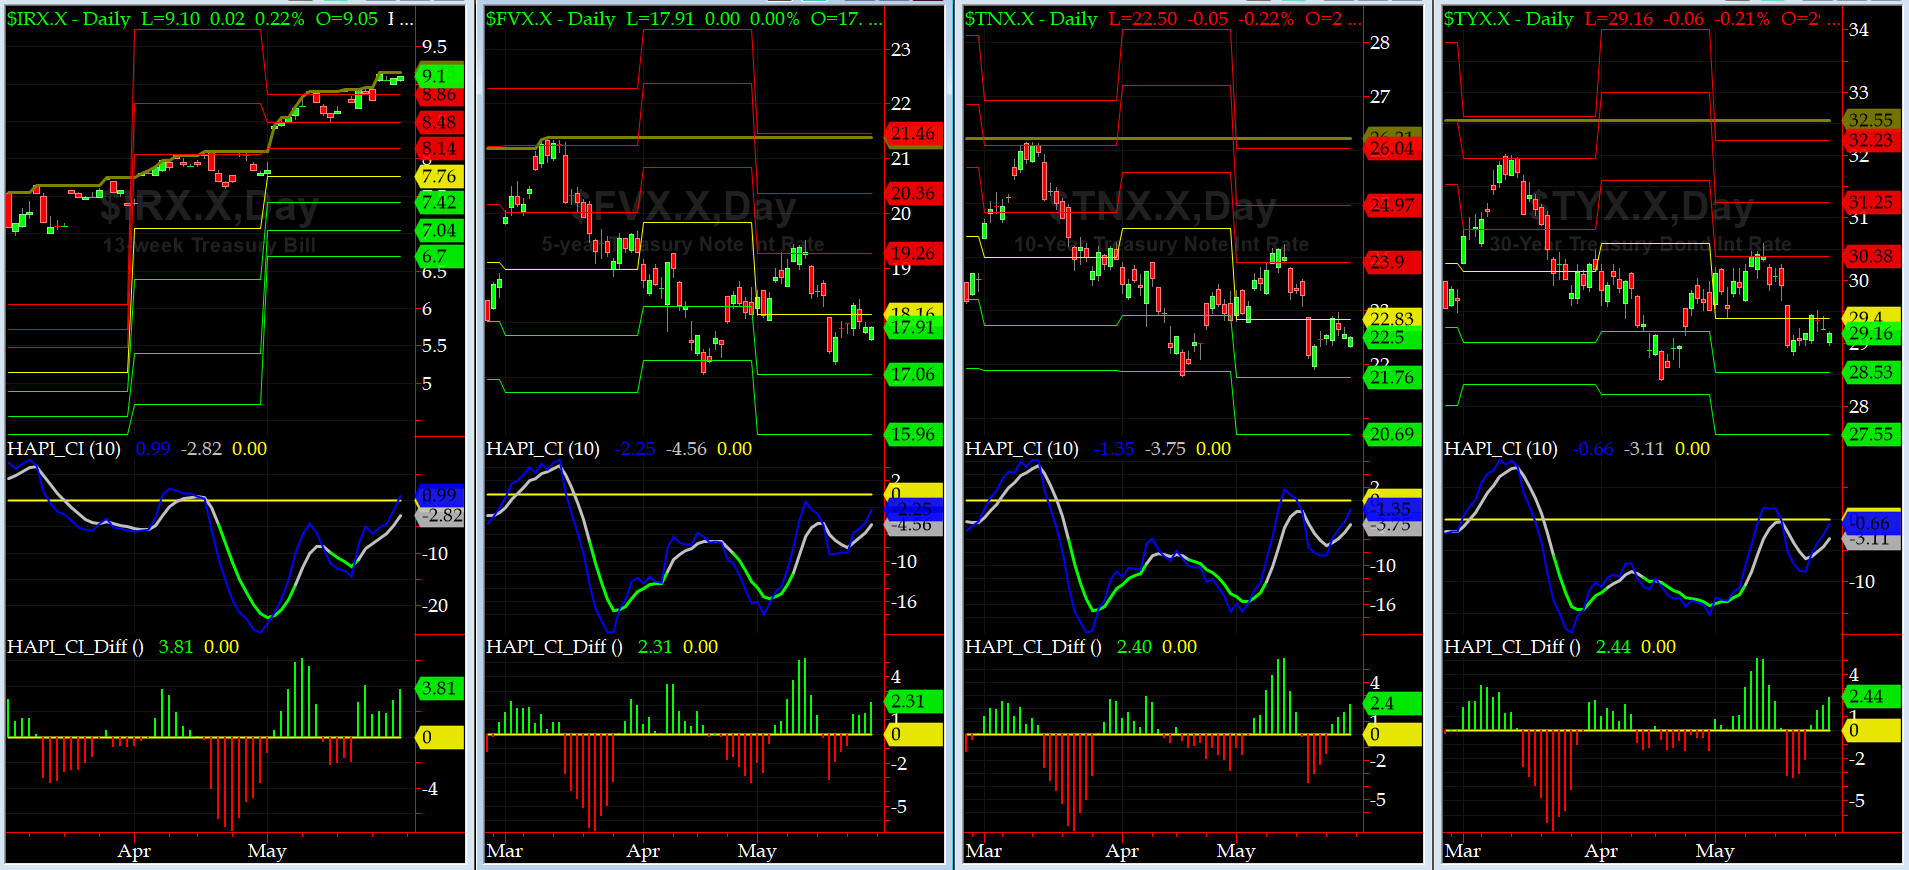
US Treasury T-Notes & T-Bonds Yields Chart
Last week was another boring week in the Debt Markets. More Iced Tea is what our beloved @Capt_Tiko suggests.
Fari Hamzei
|


 Proactive Market Timing