|
Sunday, June 18, 2017, 1115ET
Market Timing Charts, Analysis & Commentary for Issue #197

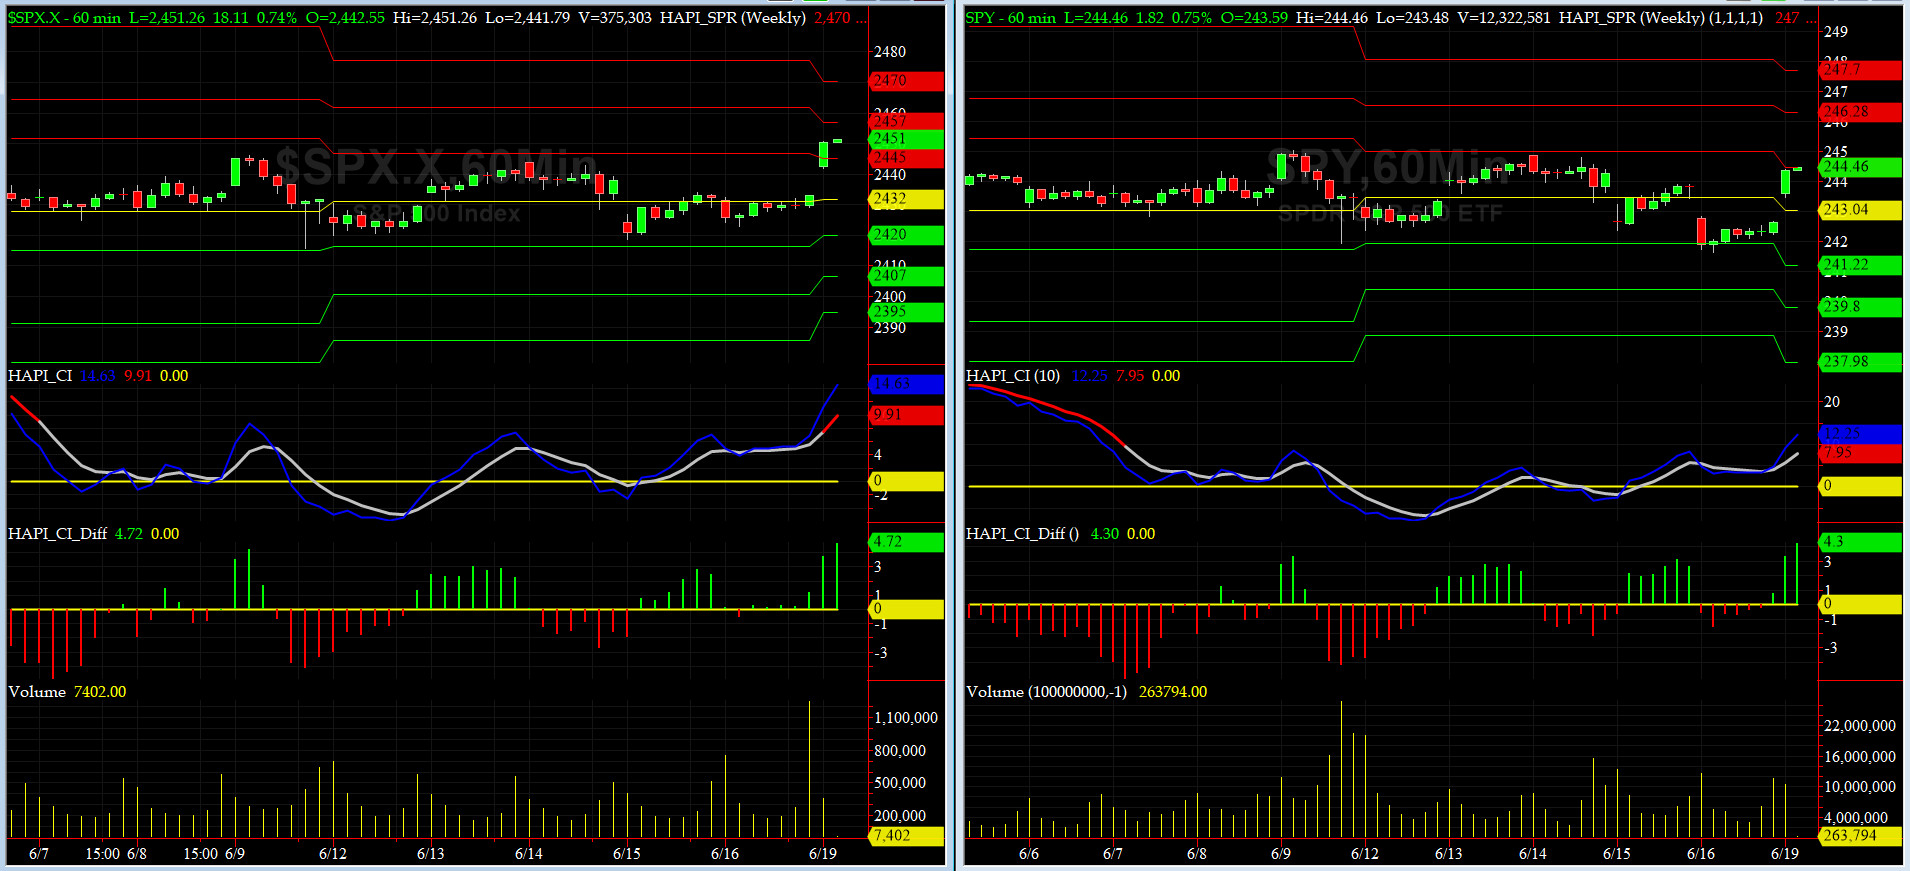
Timer Charts of S&P-500 Cash Index (SPX) + NASDAQ-100 Cash Index (NDX)
Most recent S&P-500 Cash Index (SPX): 2433.15 up +1.38 (up +0.05%) for the week ending Friday, June 16, 2017, which closed at its +0.5 sigma.
SPX ALL TIME INTRADAY HIGH = 2446.20 (reached on Friday, June 9, 2017)
SPX ALL TIME CLOSING HIGH = 2440.35 (reached on Tuesday, June 13, 2017)
Current DAILY +2 Sigma SPX = 2455 with WEEKLY +2 Sigma = 2444
Current DAILY 0 Sigma (20 day MA) SPX = 2409 with WEEKLY 0 Sigma = 2367
Current DAILY -2 Sigma SPX = 2364 with WEEKLY -2 Sigma = 2290
NYSE McClellan Oscillator = +24.4 (-150 is start of the O/S area; around -275 to -300 area or lower, we go into the �launch-pad� mode, over +150, we are in O/B area)
NYSE Breadth Thrust = 52.4 (40 is considered as oversold and 65 as overbought)
Last Wednesday was the worst day for SWG, aka Grumpie, since he was inaugurated. The beyond reproach Princetonian Robert Mueller, acting in his capacity as special counsel for DoJ, was mentioned as looking into Obstruction of Justice by current Oval Office occupant. As a young student living in Washington during Watergate, this time, the same issue has preoccupied us in most of our media encounters. Recently, we have been warning everyone, about this, in so many words and now cat is out of the bag.
The whole GOP Agenda is at risk now and market will soon price that in.

Canaries [in the Coal Mine] Chart for DJ TRAN & RUT Indices
200-Day MA DJ TRAN = 8875 or 6.1% below DJ TRAN (max observed in last 5 yrs = 20.2%, min = -20.3%)
200-Day MA RUT = 1334 or 5.4% below RUT (max observed in last 5 yrs = 21.3%, min = -22.6%)
DJ Transportation Index (proxy for economic conditions 6 to 9 months hence) went sideways again this past week.
Russell 2000 Small Caps Index (proxy for Risk ON/OFF) sold hard last week but still managed to close above its 50-day MA?
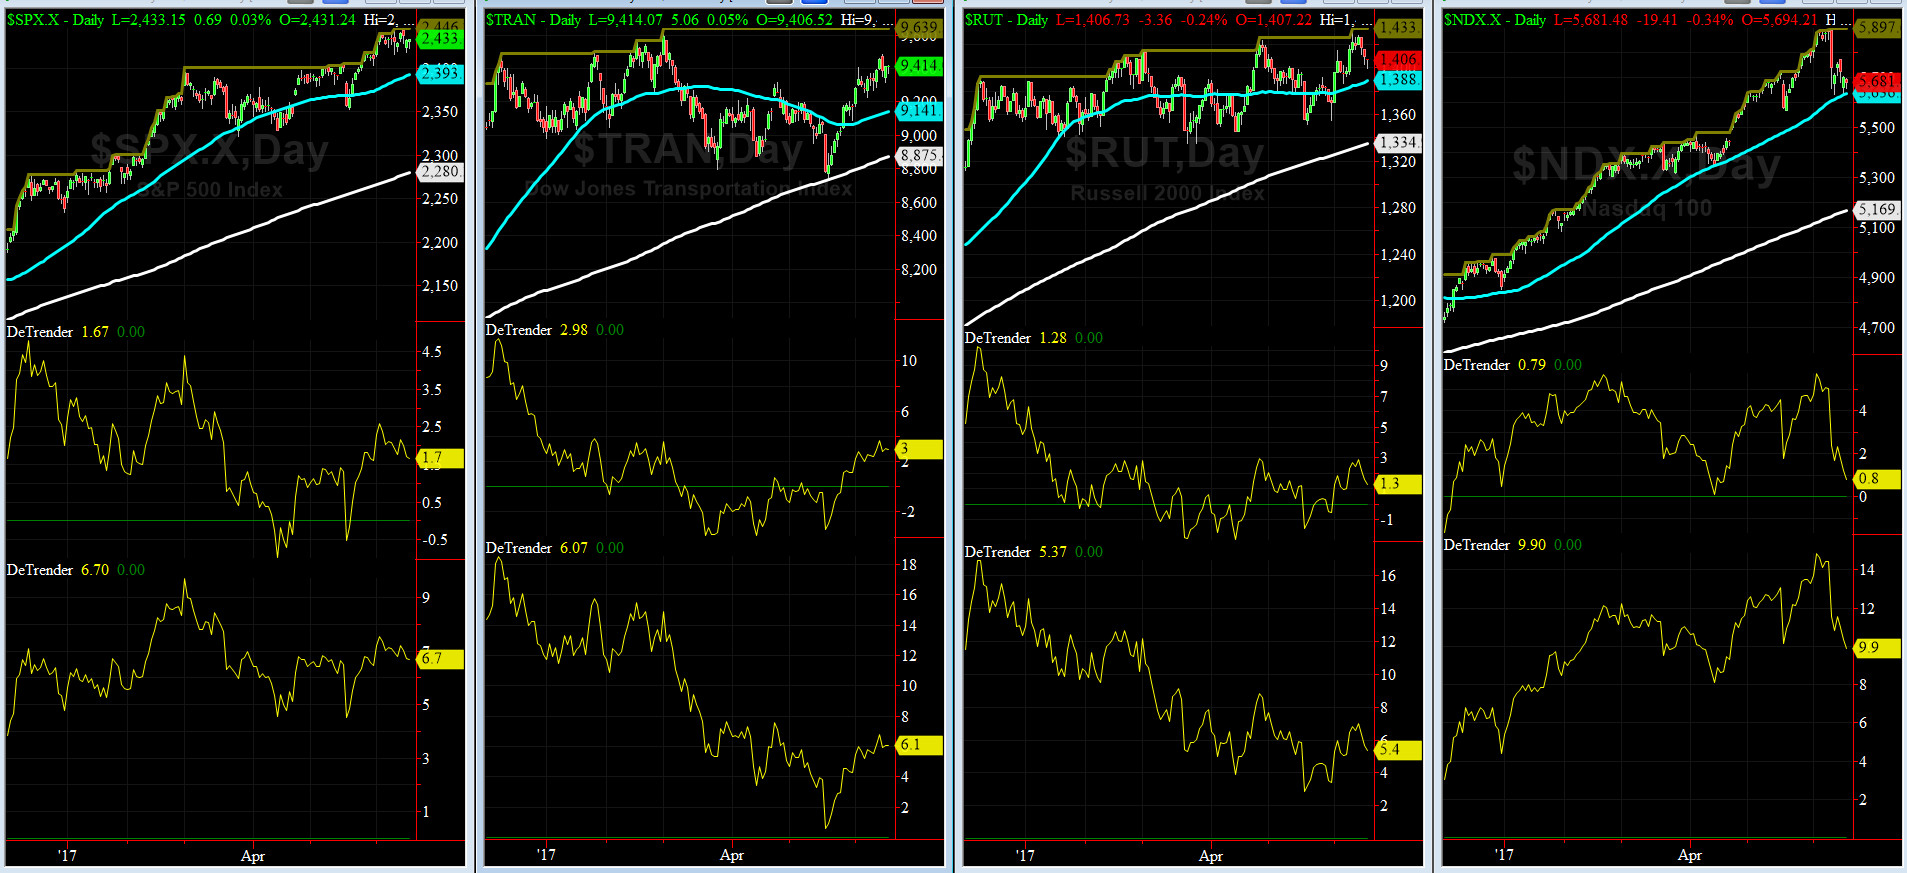
DeTrenders Charts for SPX, NDX, TRAN & RUT Indices
50-Day MA SPX = 2393 or 1.7% below SPX closed on Friday (max observed in last 5 yrs = +8.6%, min = -9.3%)
200-Day MA SPX = 2280 or 6.7% below SPX (max observed in last 5 yrs = 15.2%, min = -14%)
ALL of our EIGHT DeTrenders are POSITIVE for 4th week in a row. The DeTrenders for DJ Tran & RUT will continue to be harbingers of future price behavior in broad indices.
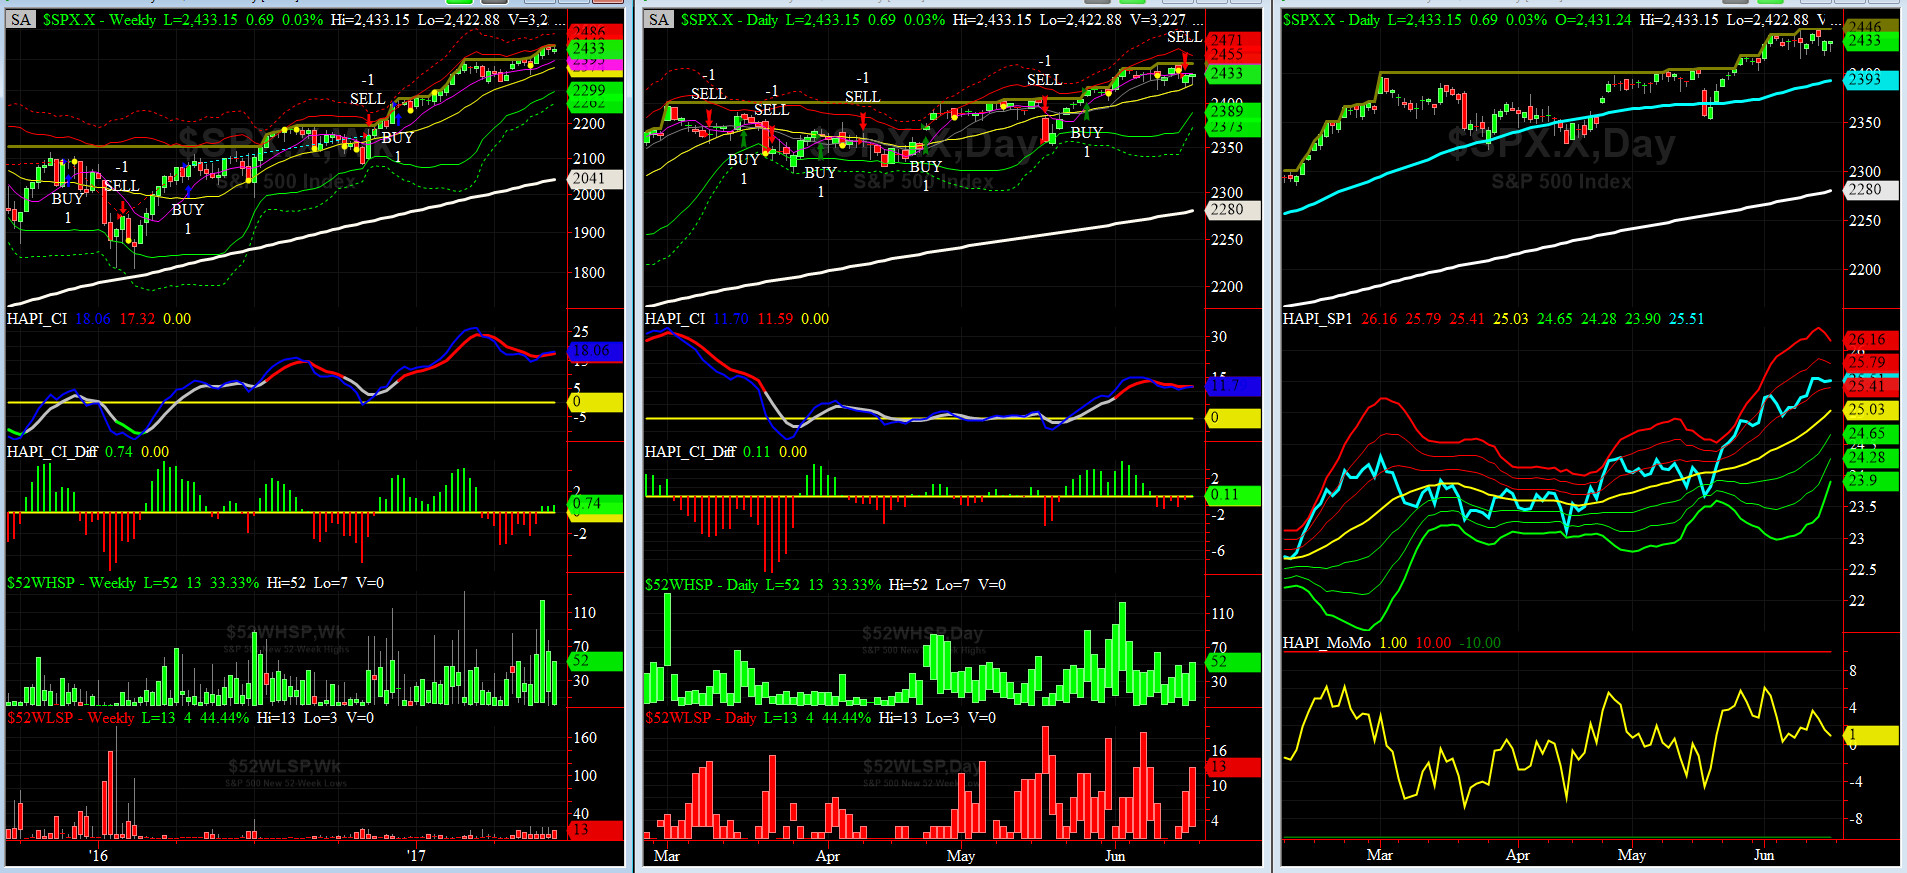
HA_SP1_Momo Chart
WEEKLY Timing Model = on a BUY Signal since Friday 12/16/16 CLOSE at 2258
DAILY Timing Model = on a SELL Signal since Thursday 6/15/17 CLOSE at 2432
Max SPX 52wk-highs reading last week = 52 (over 120-140, the local maxima is in)
Max SPX 52wk-Lows reading last week = 13 (over 40-60, the local minima is in)
HA_SP1 at just above its +1 sigma channels
HA_Momo = +1 (reversals most likely occur above +10 or below -10)
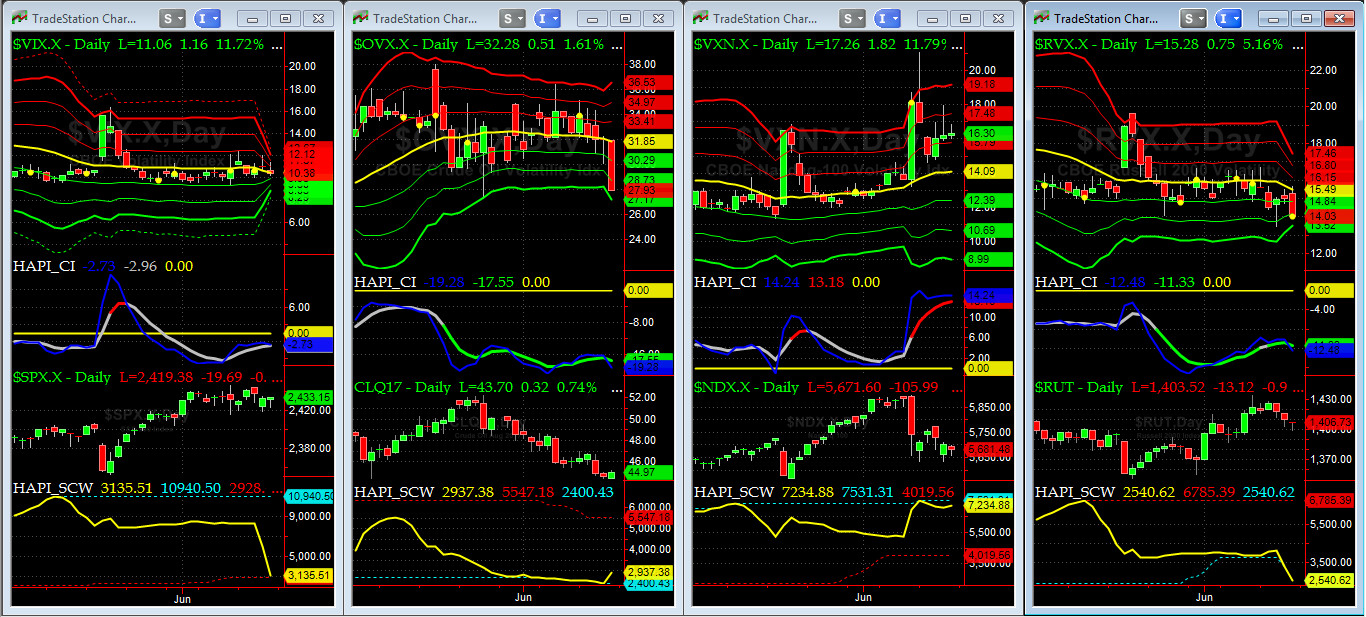
Vol of the Vols Chart
VIX currently stands at 10.35, or just at its zero sigma (remember it's the VIX volatility pattern ( its sigma channels) that matters, and not the level of VIX itself ( this is per Dr. Robert Whaley, a great mentor and inventor of original VIX, now called VXO ). VIX usually peaks around a test of its +4 sigma).
Vol Indices remained fairly quiet for most of this past week. And on Monday, we saw an decent DROP in NASDAQ Vol, VXN, from +4 sigma to +0.5 sigma on Tuesday.
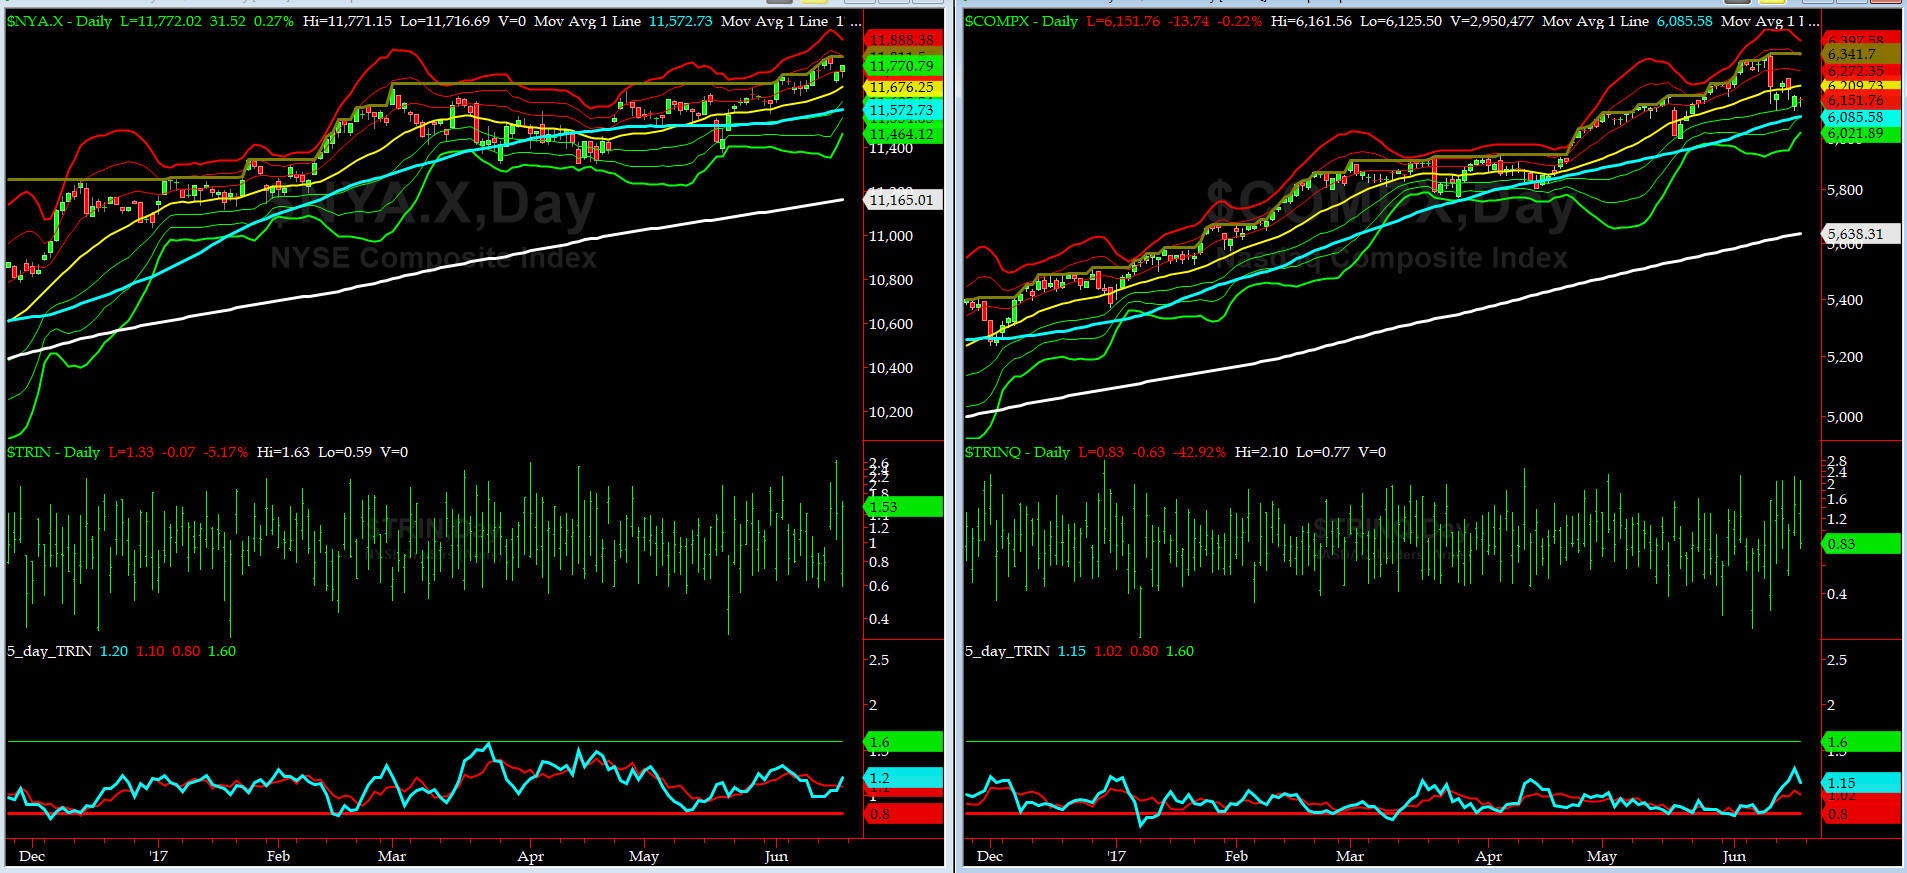
5-day TRIN & TRINQ Charts
Both NYSE & NASDAQ 5-day TRINs are very NEUTRAL here. No signal here.
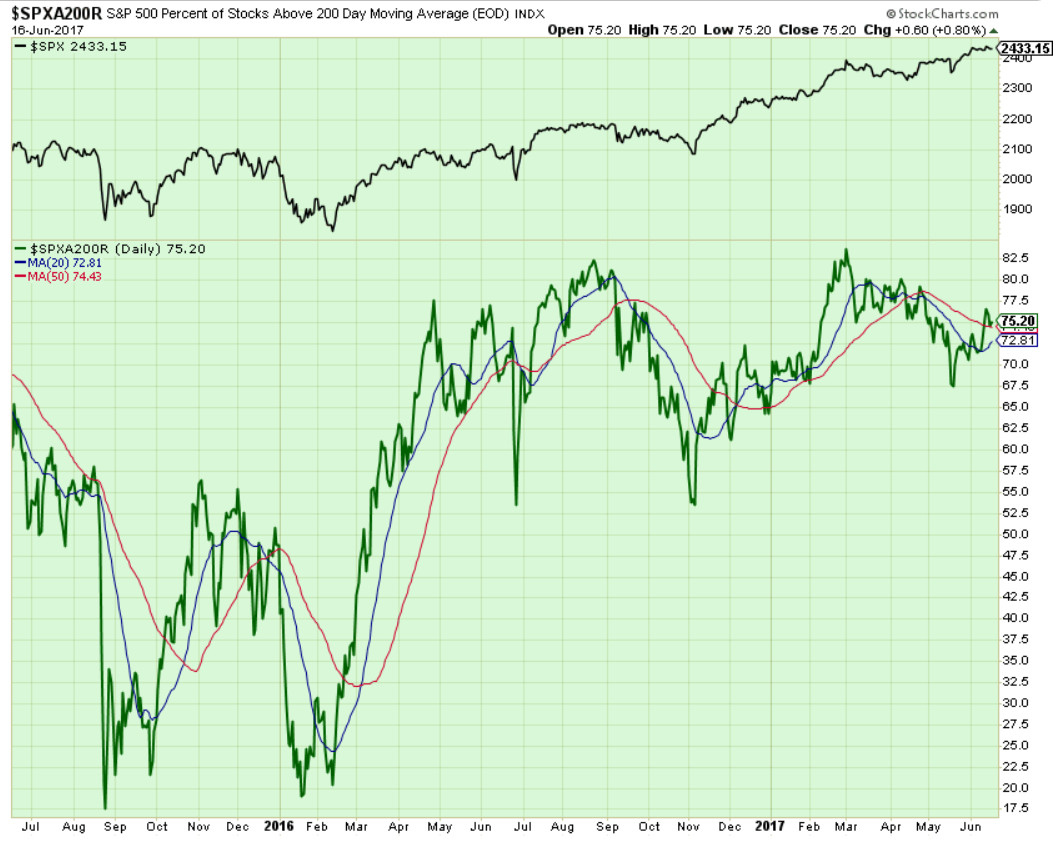
Components of SPX above their respective 200day MA Chart
This scoring indicator had a minor spike his past week but strong divergences with SPX continued further.
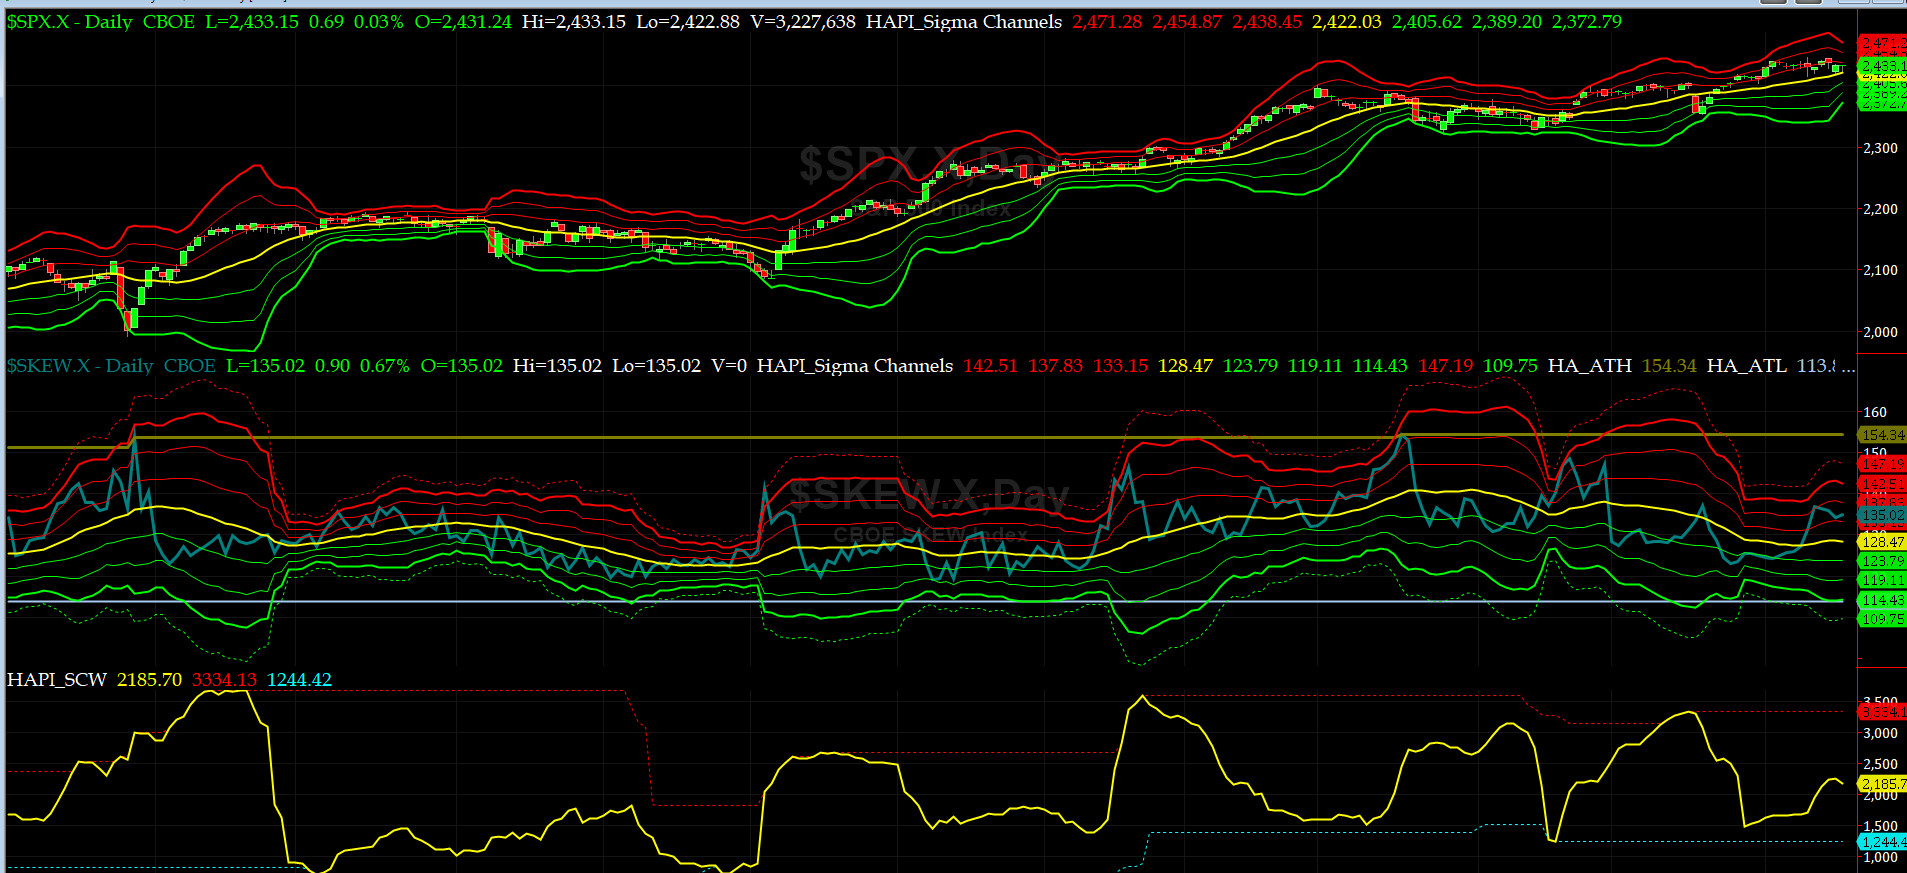
SPX SKEW (Tail Risk) Chart
Last week SPX SKEW (Tail Risk) rose to 135 near its +1 sigma (normal = 120-125, range 100-150).
Is all quiet on the Eastern & Mid-Western Fronts? Large market participants (BLUE TEAM) continue say NO. Interesting times are ahead, ioho.
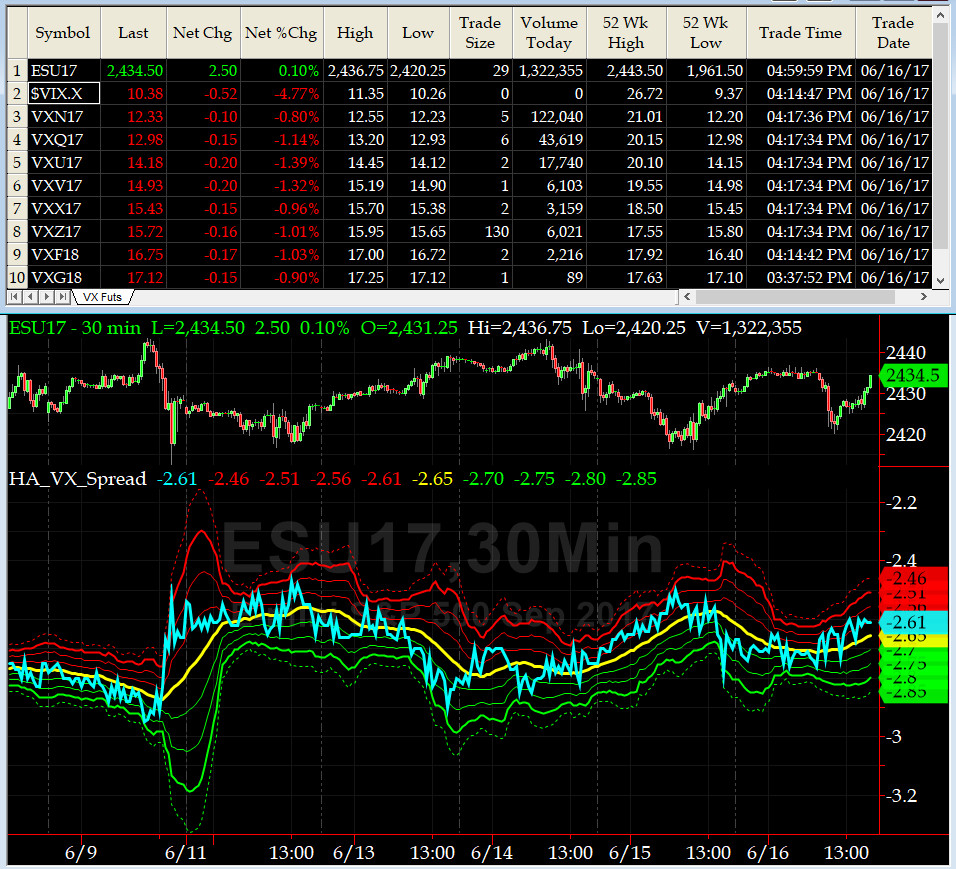
3-month VIX Futures Spread(VX) Chart
On Friday, we rolled our VX Spread to LONG July SHORT October, which traded on Friday around -2.6. No signal here, as of now.
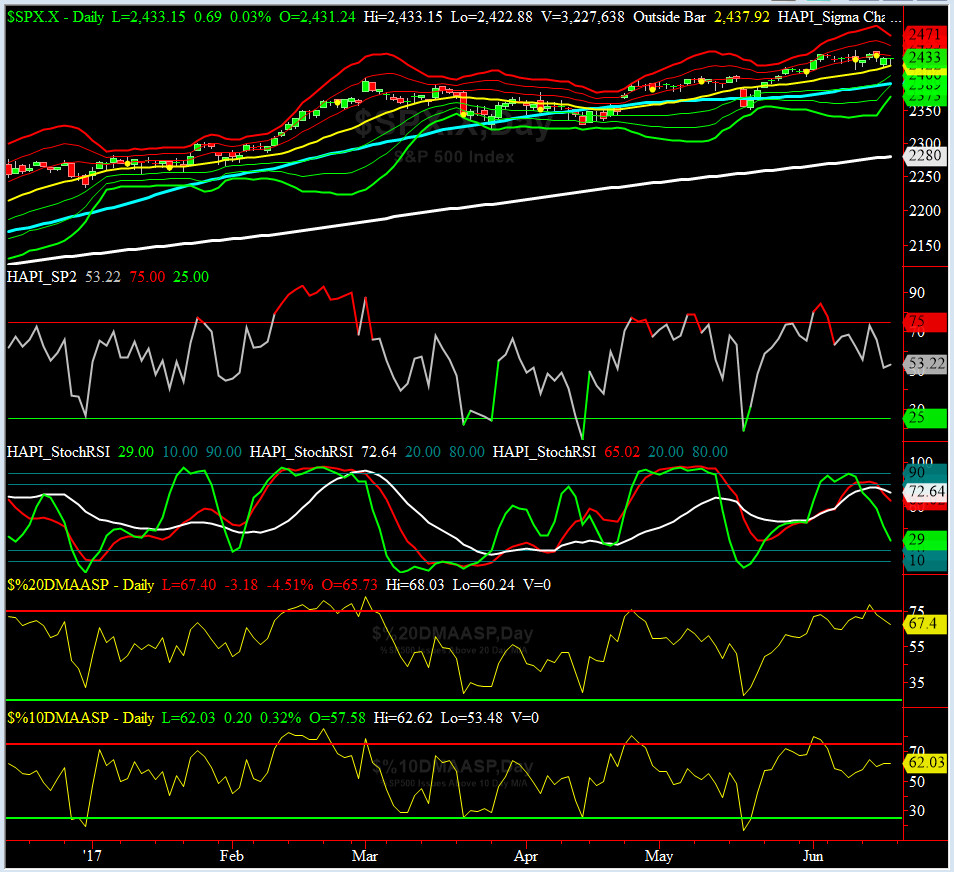
HA_SP2 Chart
HA_SP2 = 53 (Buy signal <= 25, Sell Signal >= 75)
We are fast approaching NEUTRAL zone. More sell0ff ahead? while we would welcome that, what is hard to see here is the requisite catalyst. More iced tea? Our XO, @Capt_Tiko, says: absolutely.....
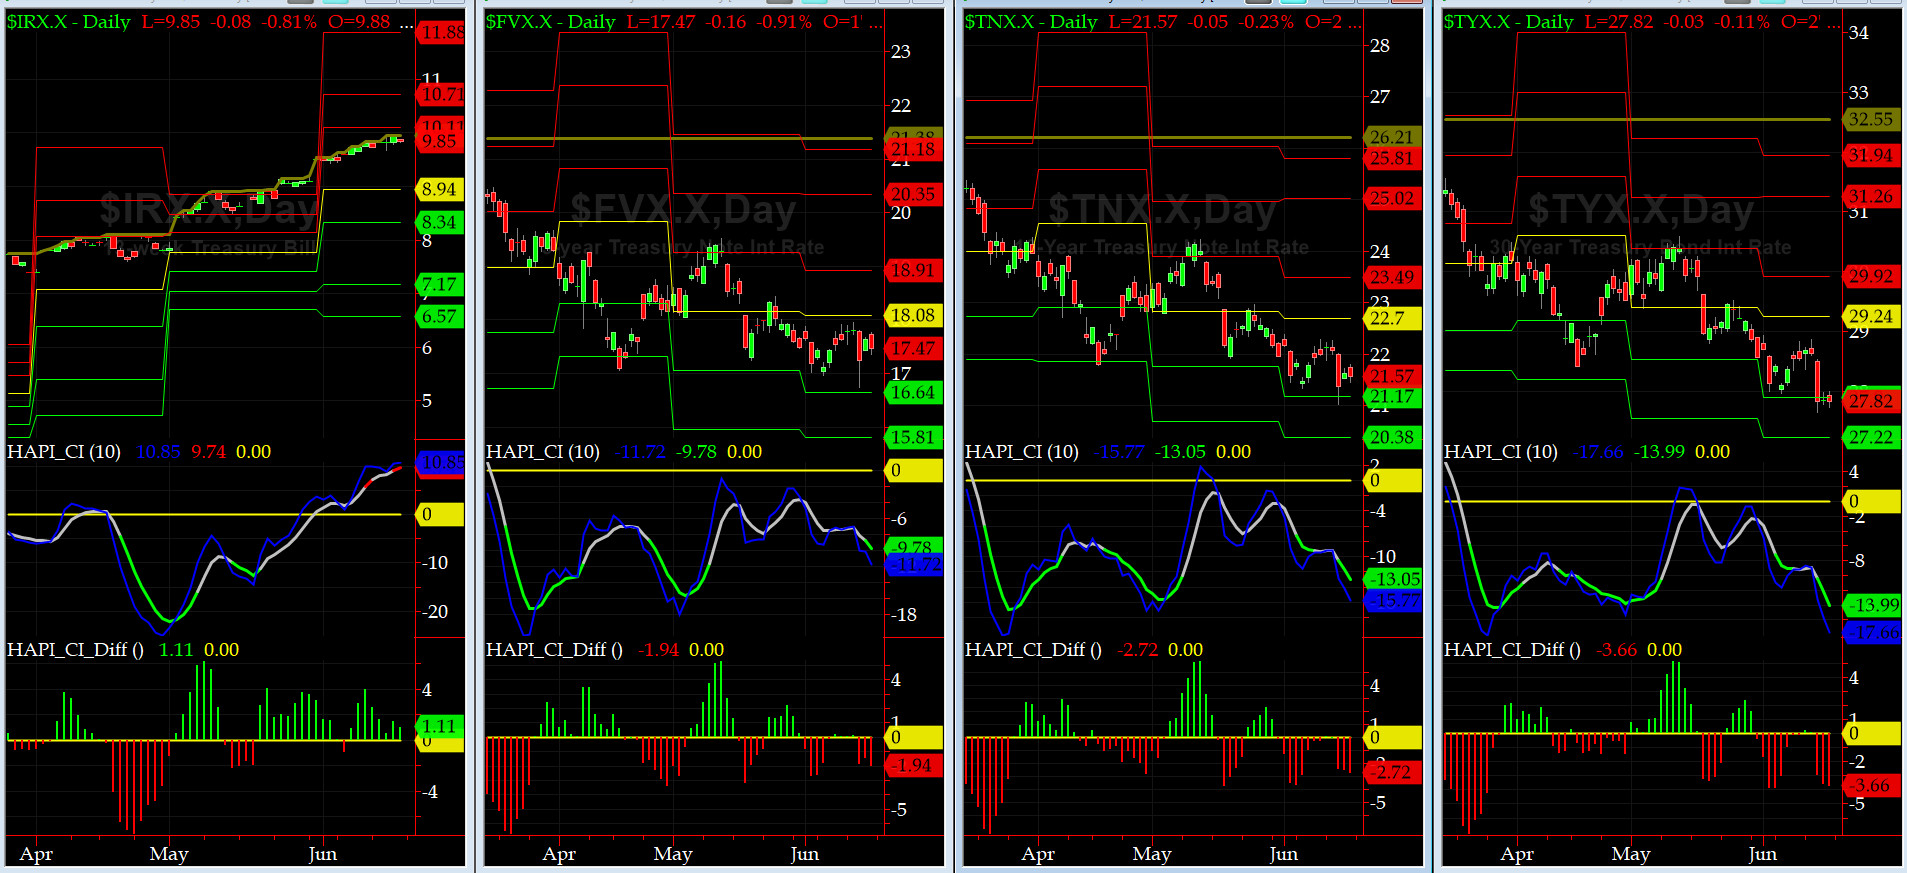
US Treasury T-Notes & T-Bonds Yields Chart
We saw more flight-to-safety trades this past week in US Debt Markets (we know we are sounding like a broken record).
Fari Hamzei
|


 Proactive Market Timing