|
Sunday, July 2, 2017, 2250ET
Market Timing Charts, Analysis & Commentary for Issue #199
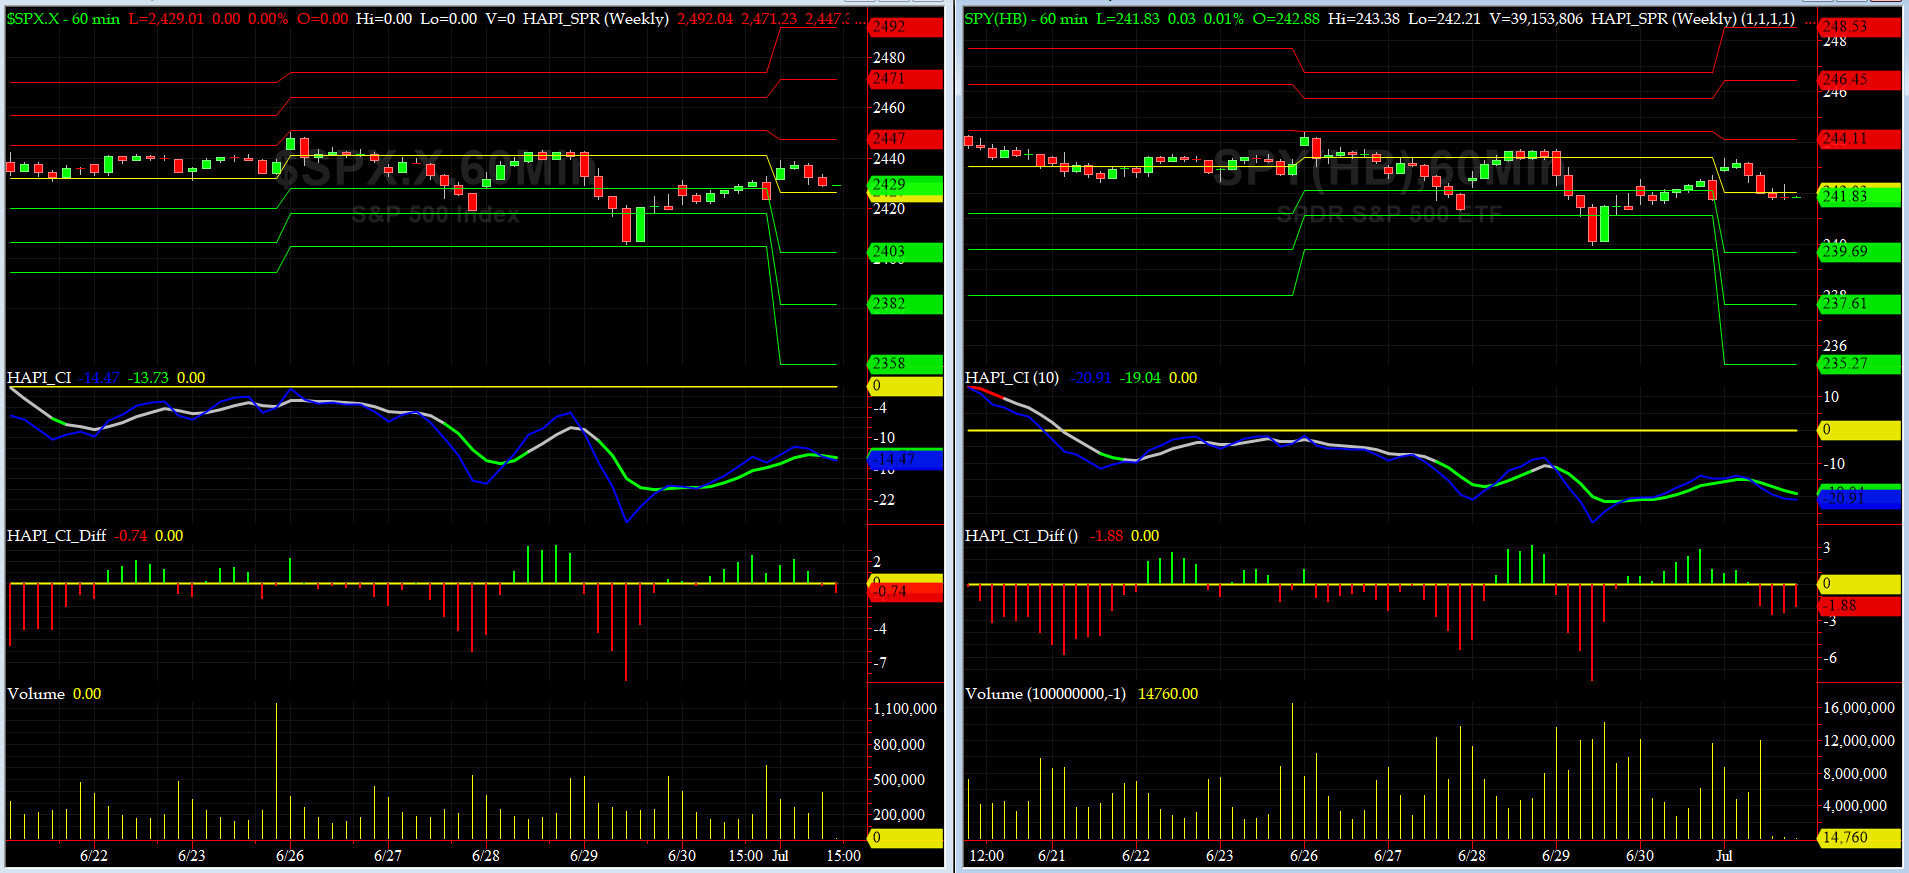
Timer Charts of S&P-500 Cash Index (SPX) + NASDAQ-100 Cash Index (NDX)
Most recent S&P-500 Cash Index (SPX): 2423.41 down -14.89 (down -0.6%) for the week ending Friday, June 30, 2017, which closed near its -2 sigma.
SPX ALL TIME INTRADAY HIGH = 2453.82 (reached on Monday, June 19, 2017)
SPX ALL TIME CLOSING HIGH = 2453.46 (reached on Monday, June 19, 2017)
Current DAILY +2 Sigma SPX = 2449 with WEEKLY +2 Sigma = 2453
Current DAILY 0 Sigma (20 day MA) SPX = 2434 with WEEKLY 0 Sigma = 2387
Current DAILY -2 Sigma SPX = 2419 with WEEKLY -2 Sigma = 2320
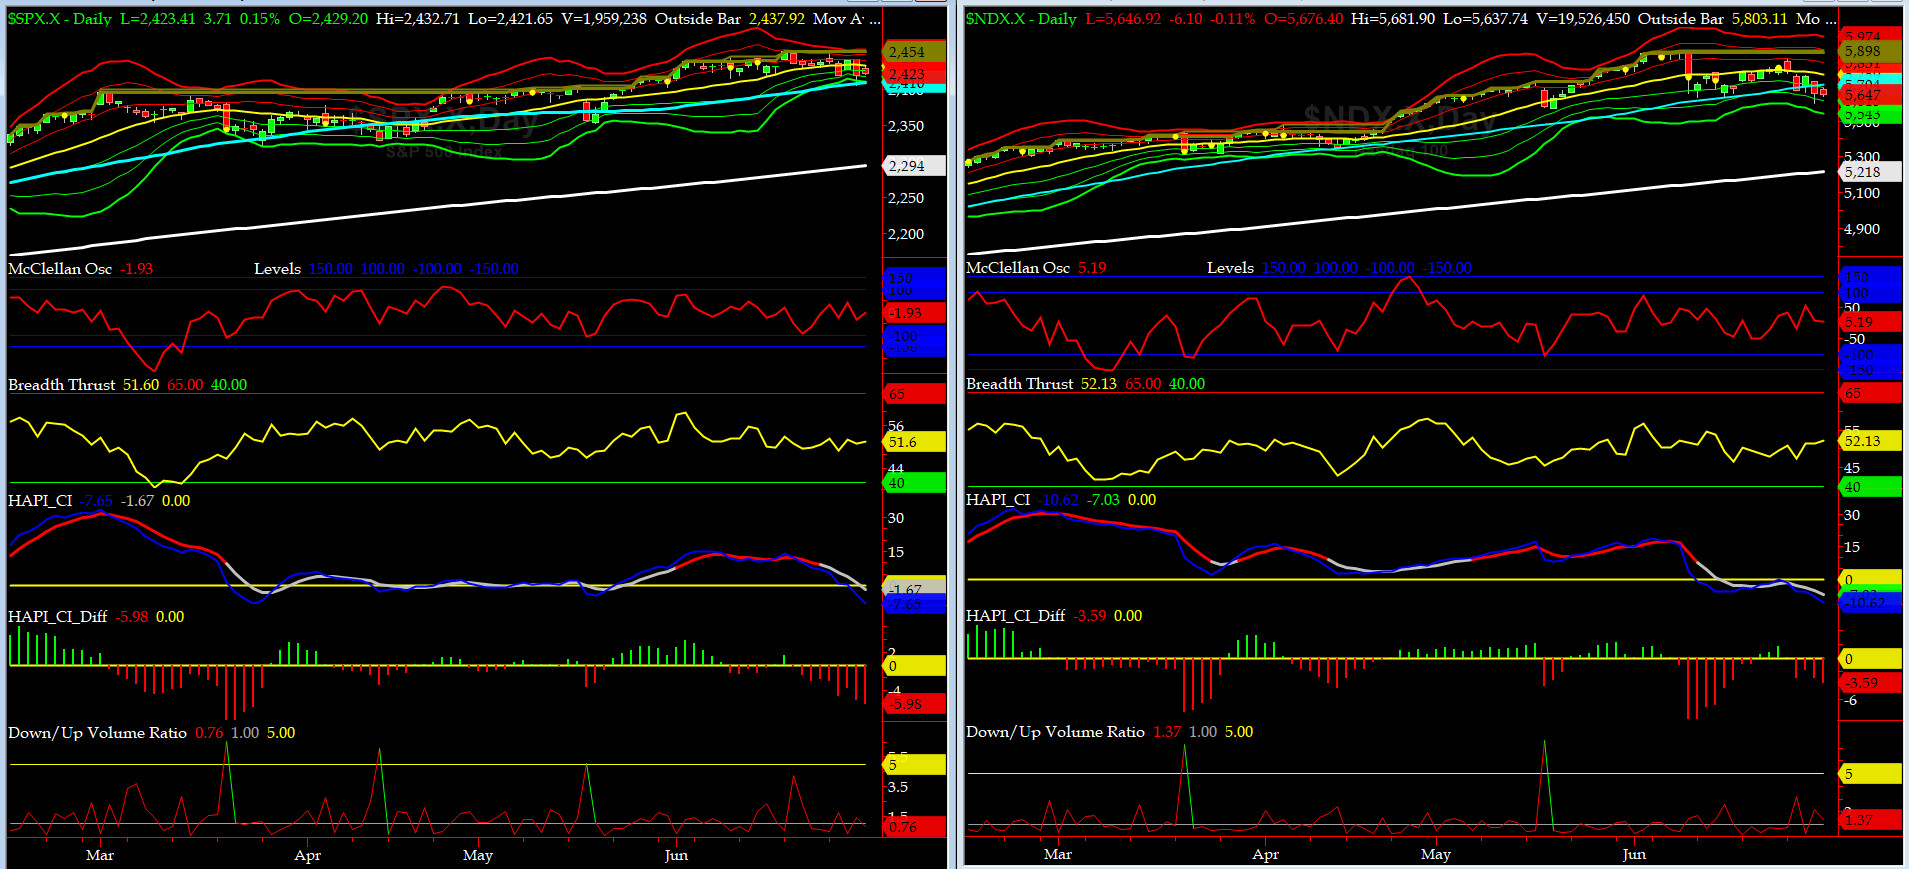
NYSE McClellan Oscillator = -1.9 (-150 is start of the O/S area; around -275 to -300 area or lower, we go into the �launch-pad� mode, over +150, we are in O/B area)
NYSE Breadth Thrust = 51.6 (40 is considered as oversold and 65 as overbought)
The NDX chartpattern is ominous. We shall stay short here. Maybe, and just maybe, finally the markets are seeing what we have been expecting since mid-April.
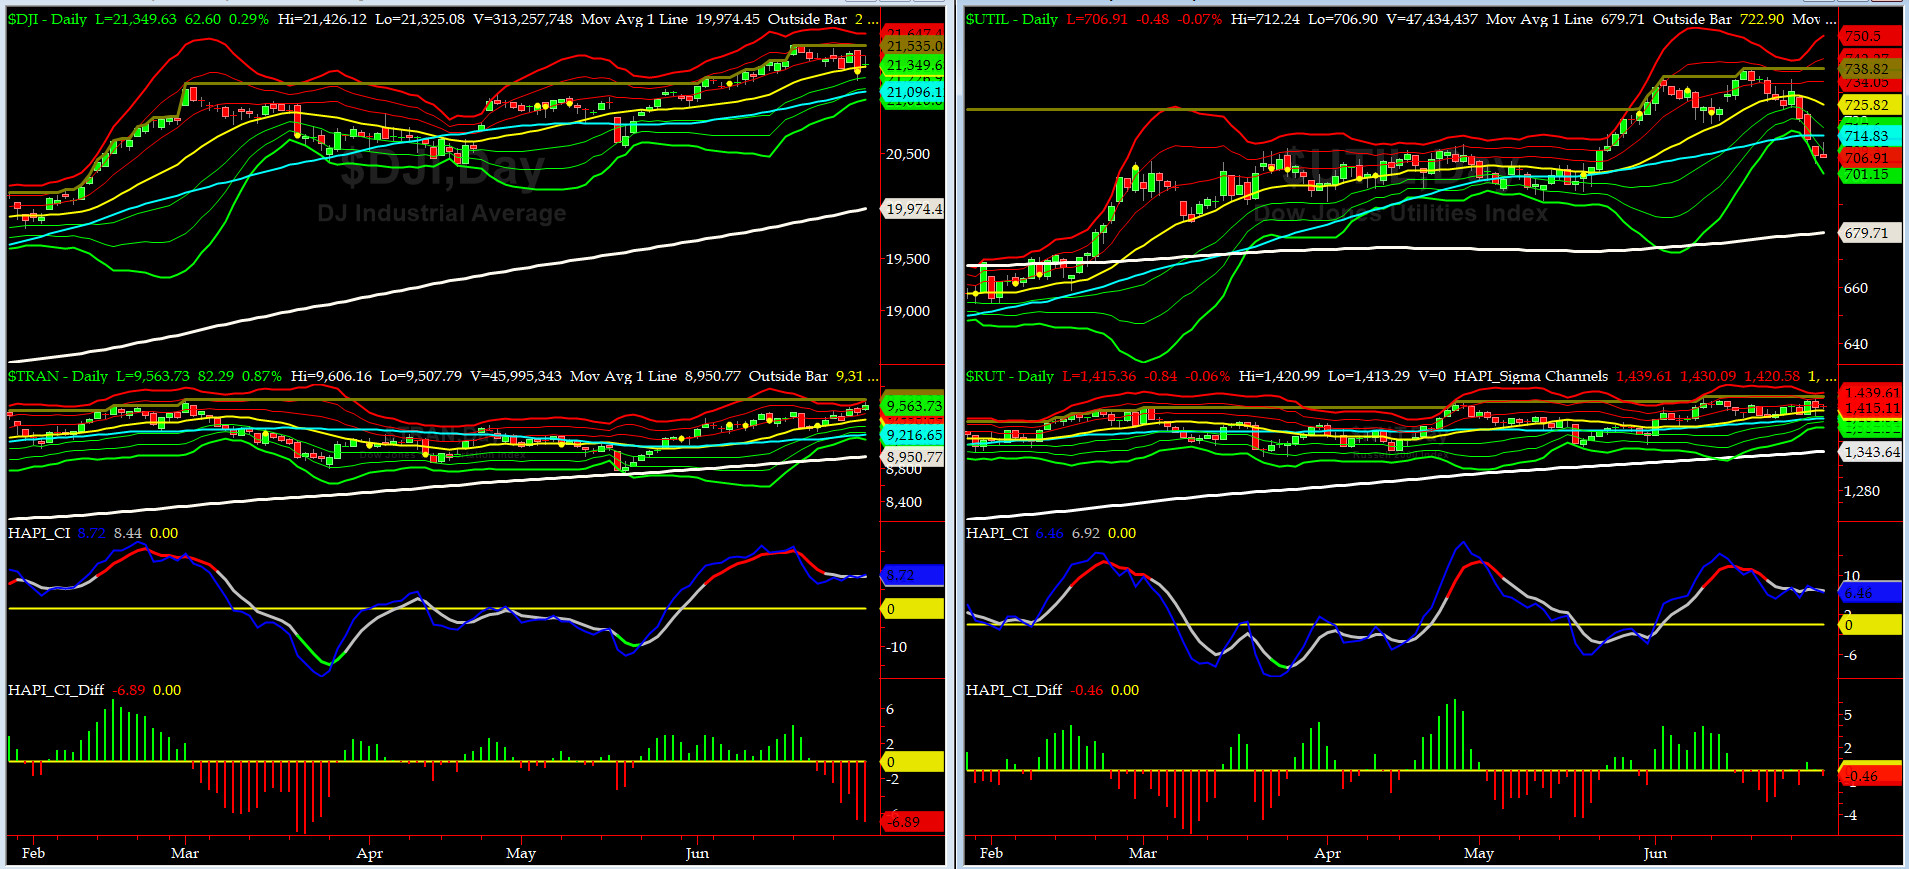
Canaries [in the Coal Mine] Chart for DJ TRAN & RUT Indices
200-Day MA DJ TRAN = 8950 or 6.8% below DJ TRAN (max observed in last 5 yrs = 20.2%, min = -20.3%)
200-Day MA RUT = 1343 or 5.3% below RUT (max observed in last 5 yrs = 21.3%, min = -22.6%)
DJ Transportation Index (proxy for economic conditions 6 to 9 months hence) rallied last week and stopped just short of a new ATH.
Russell 2000 Small Caps Index (proxy for Risk ON/OFF) was flat for the week. RISK is still ON.

DeTrenders Charts for SPX, NDX, TRAN & RUT Indices
50-Day MA SPX = 2410 or 0.5% below SPX close of Friday (max observed in last 5 yrs = +8.6%, min = -9.3%)
200-Day MA SPX = 2293 or 5.6% below SPX (max observed in last 5 yrs = 15.2%, min = -14%)
SEVEN of our EIGHT DeTrenders are POSITIVE now while the DeTrenders for DJ Tran & RUT will continue to be harbingers of future price behavior in broad indices, it is worth noting that NDX is leading lower here with a close below its 50-day MA.
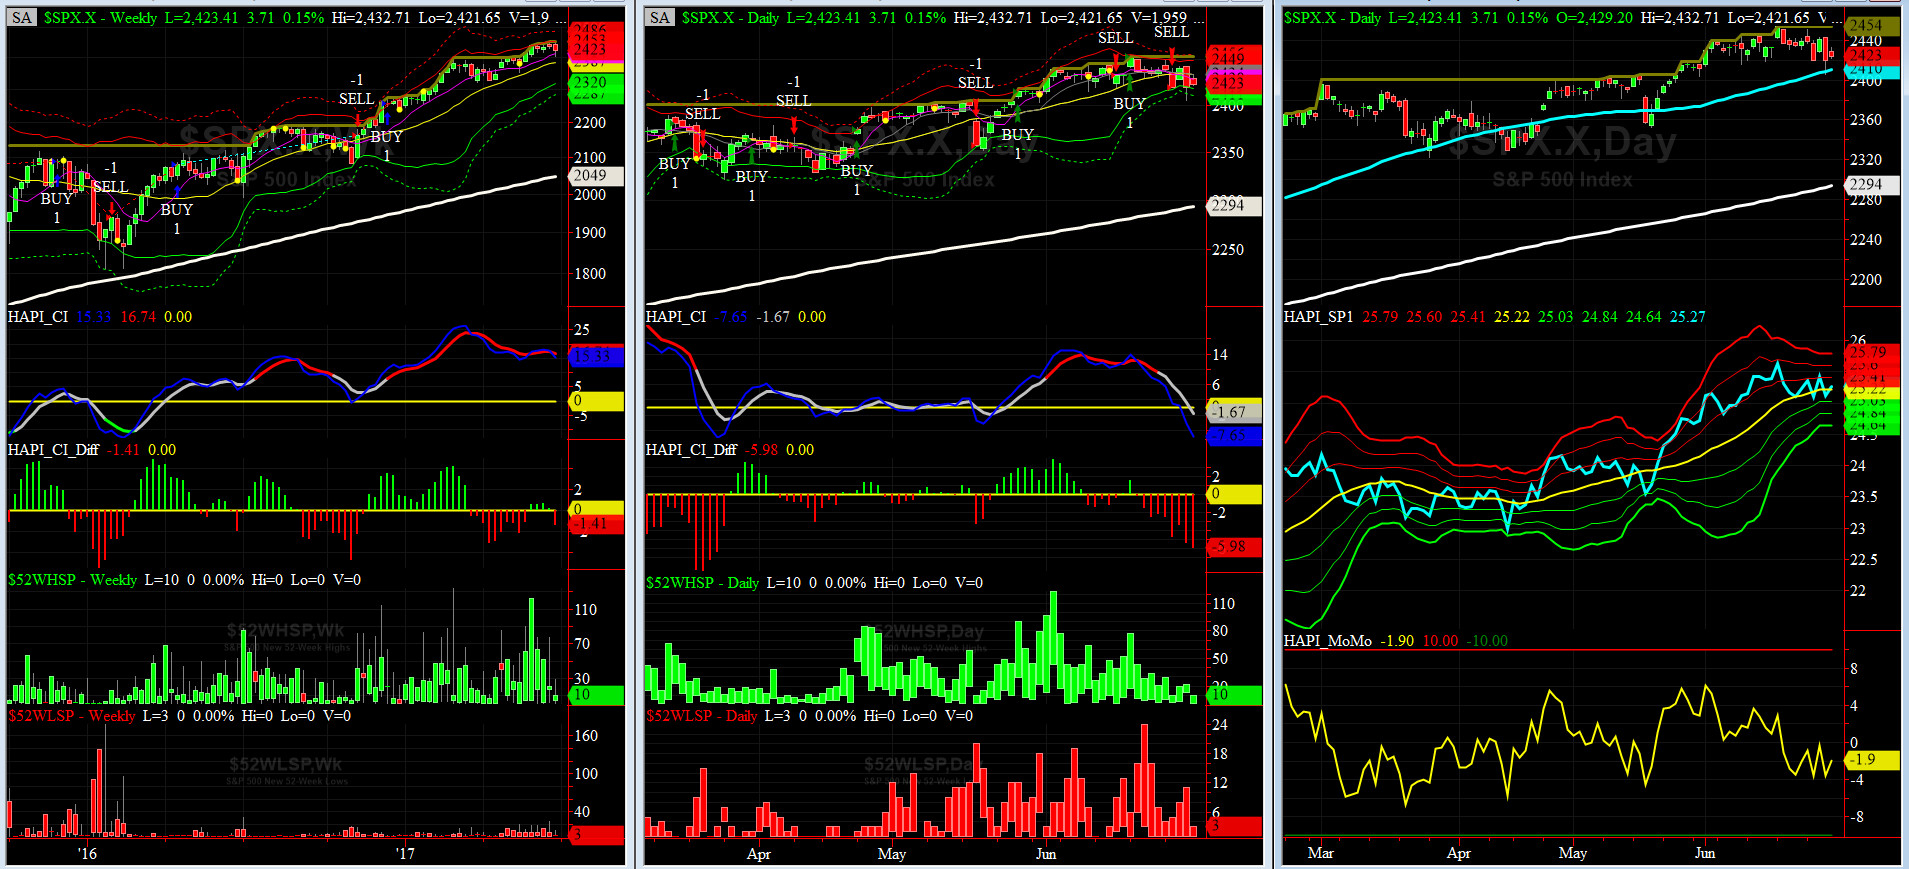
HA_SP1_Momo Chart
WEEKLY Timing Model = on a BUY Signal since Friday 12/16/16 CLOSE at 2258
DAILY Timing Model = on a SELL Signal since Tuesday 6/27/17 CLOSE at 2419
Max SPX 52wk-highs reading last week = 29 (over 120-140, the local maxima is in)
Max SPX 52wk-Lows reading last week = 11 (over 40-60, the local minima is in)
HA_SP1 closed at just about its zero sigma channels
HA_Momo = -1.9 (reversals most likely occur above +10 or below -10)
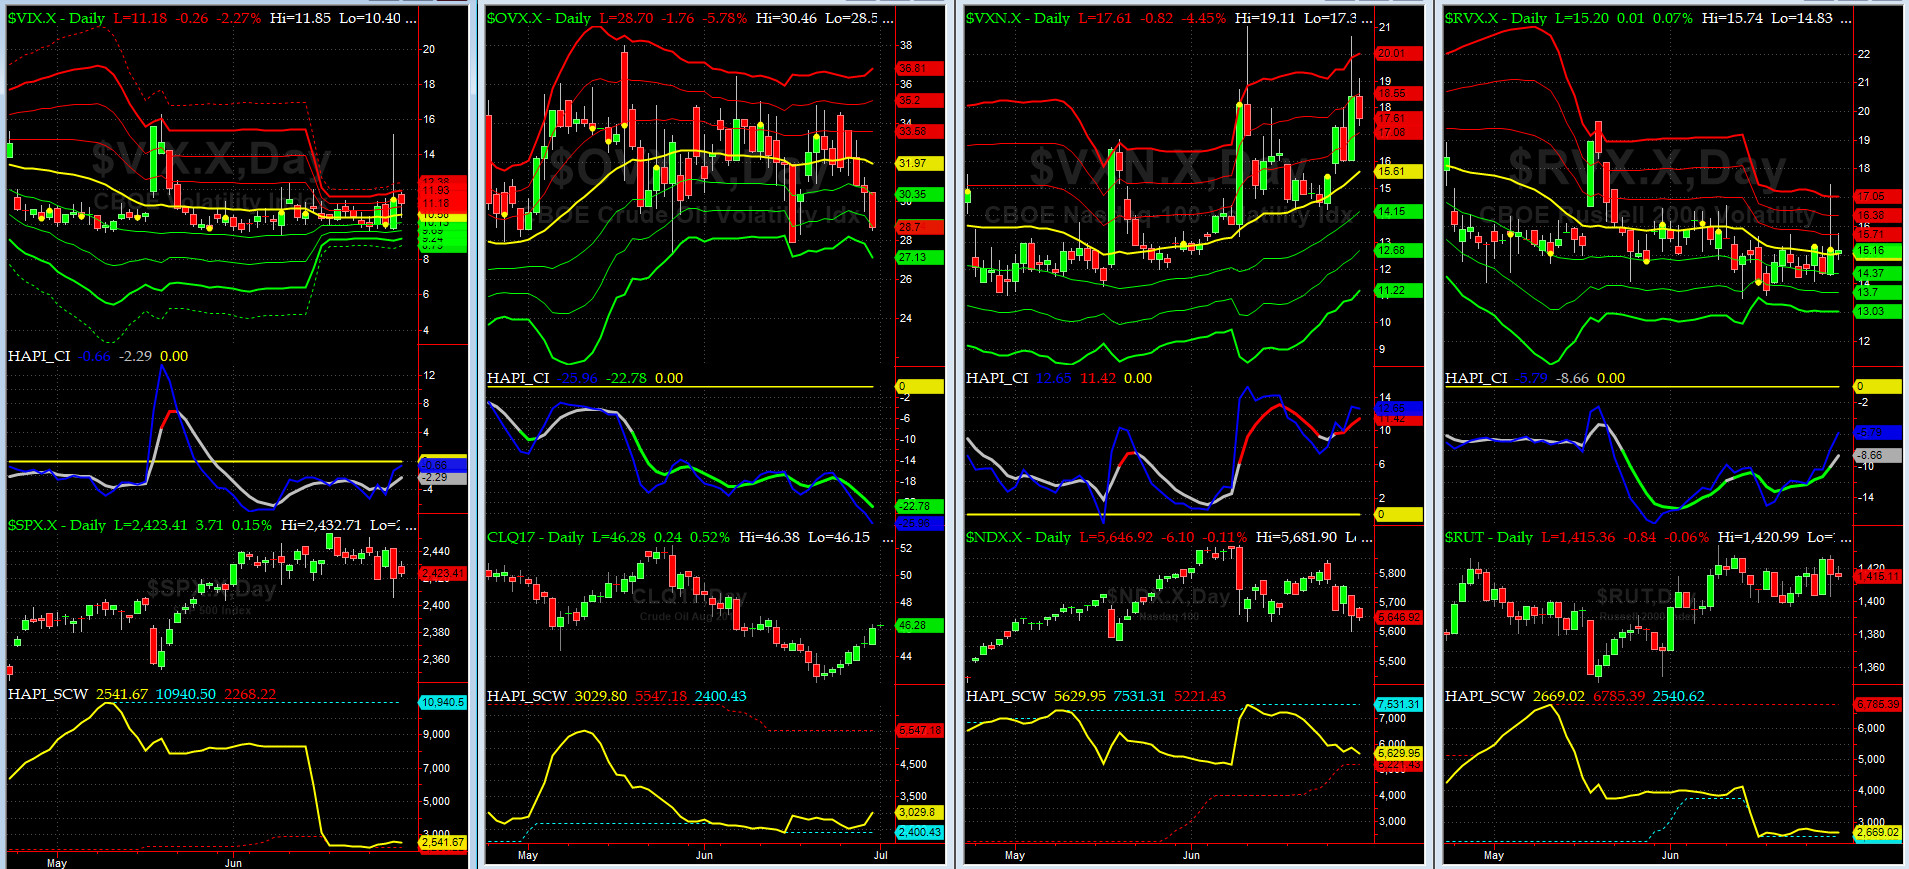
Vol of the Vols Chart
VIX currently stands at 10.02, or just at its -1 sigma (remember it's the VIX volatility pattern ( its sigma channels) that matters, and not the level of VIX itself ( this is per Dr. Robert Whaley, a great mentor and inventor of original VIX, now called VXO ). VIX usually peaks around a test of its +4 sigma).
Vol Indices again remained quiet this past week, except for Thursday. And by far, the biggest mover was OVX (vols for WTI Crude) as our beloved @Capt_Tiko took off for a badly needed R&R in Cote d'Azur. We love his style.
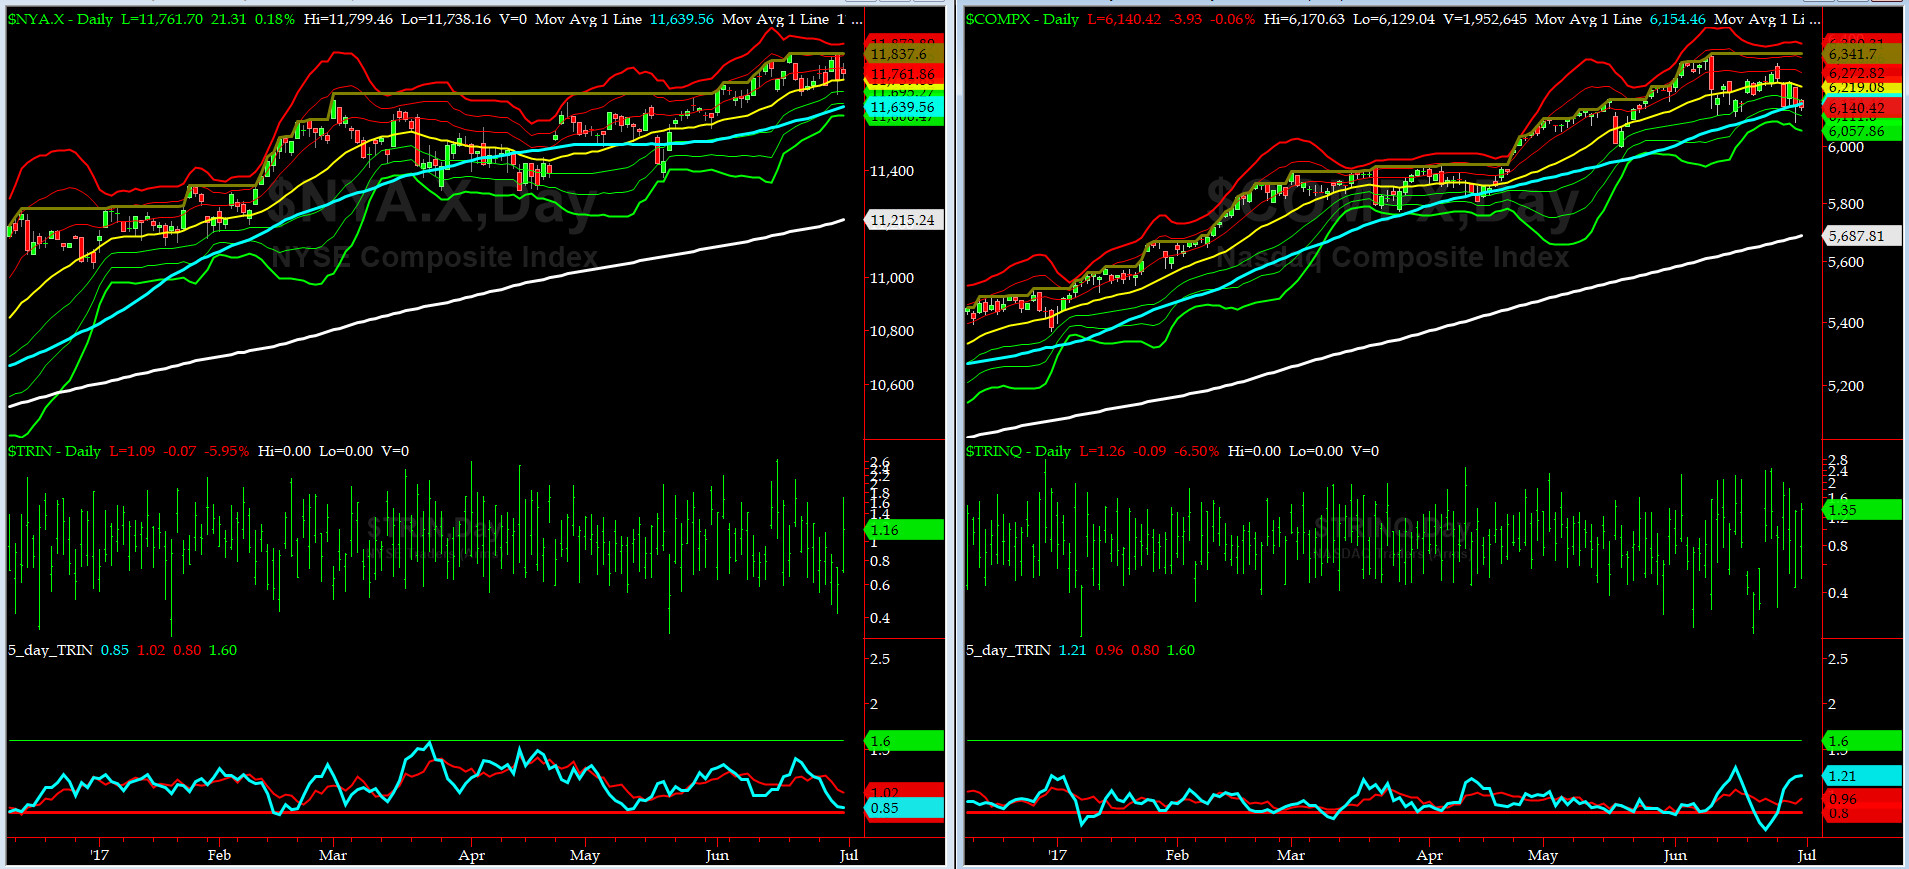
5-day TRIN & TRINQ Charts
What a SELL Signal that was for NASDAQ last week via its 5-day TRINQ. Our options trades in QQQ & IBB were the main beneficiaries. Now NYSE 5-day TRIN is getting ready for another SELL signal. Fasten your harness (as we say in the NAVY).
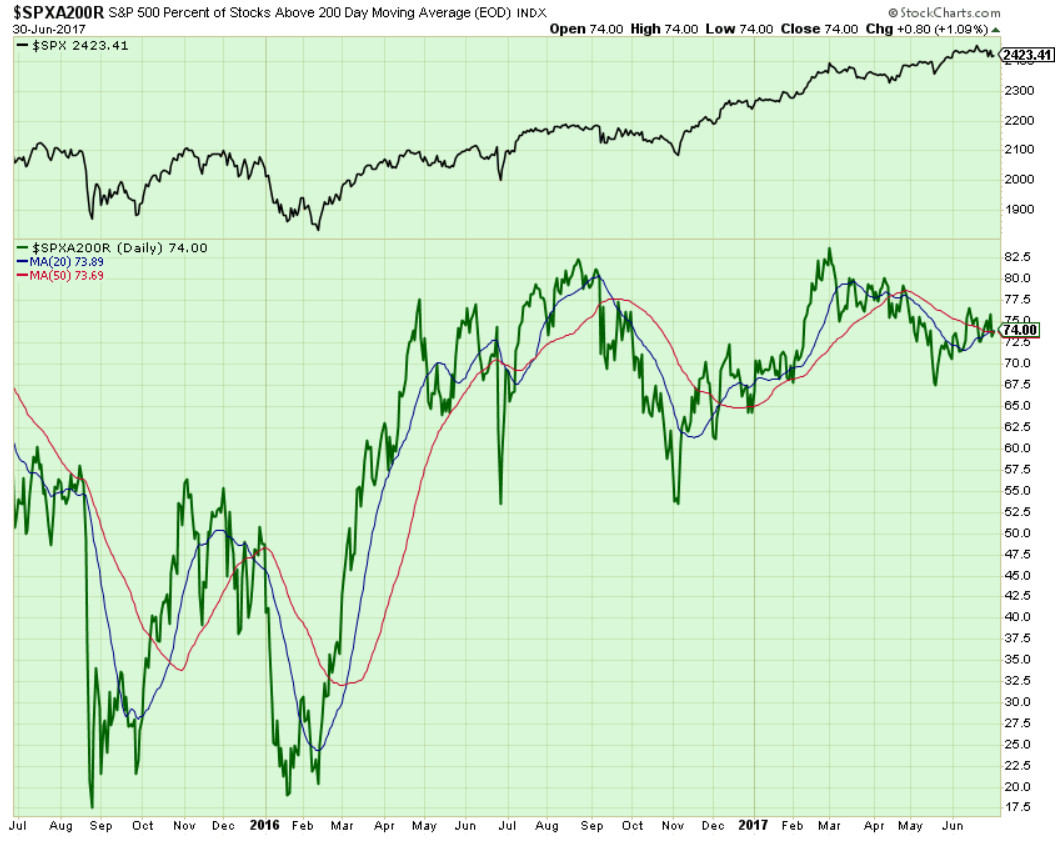
Components of SPX above their respective 200day MA Chart
This scoring indicator still having divergences with SPX. Closed at 74% and we should look for test of 67% (or lower).
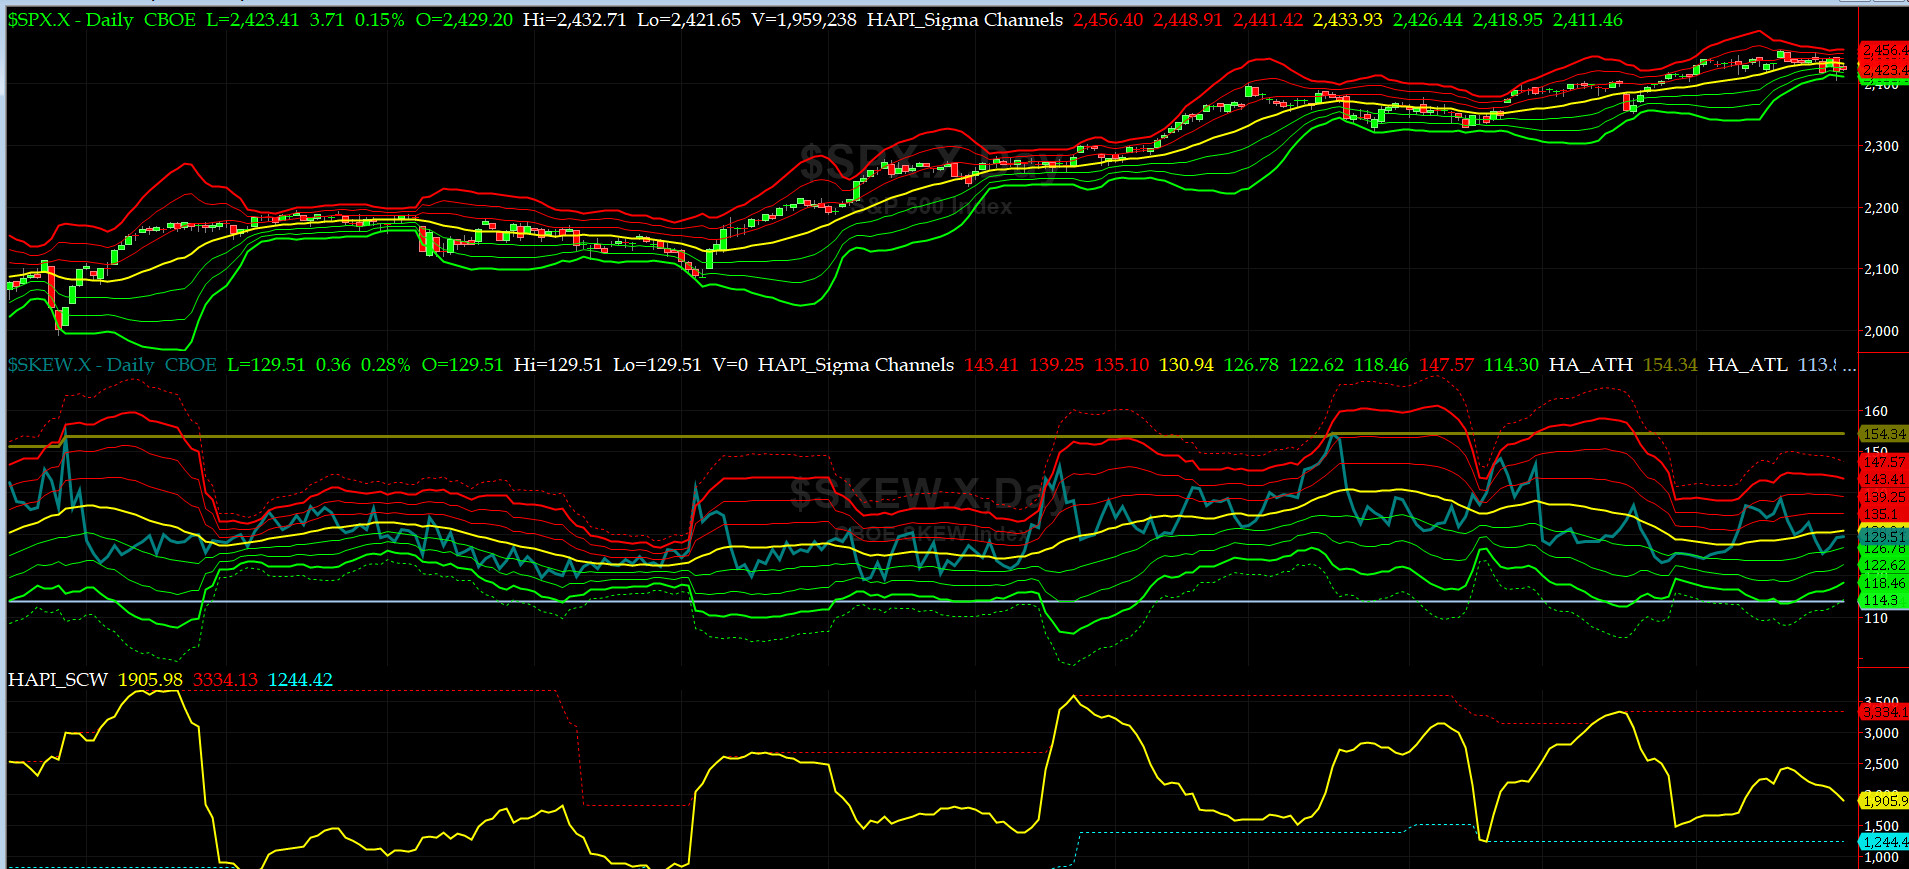
SPX SKEW (Tail Risk) Chart
Last week SPX SKEW (Tail Risk) dropped to 126 and then closed at 129.5 its zero sigma (normal = 120-125, range 100-150).
Is all quiet on the Eastern & Mid-Western Fronts? Of course NOT -- a few cared last week and we saw a pullback but again it was bought. This ain't over till the Fat Lady sings.
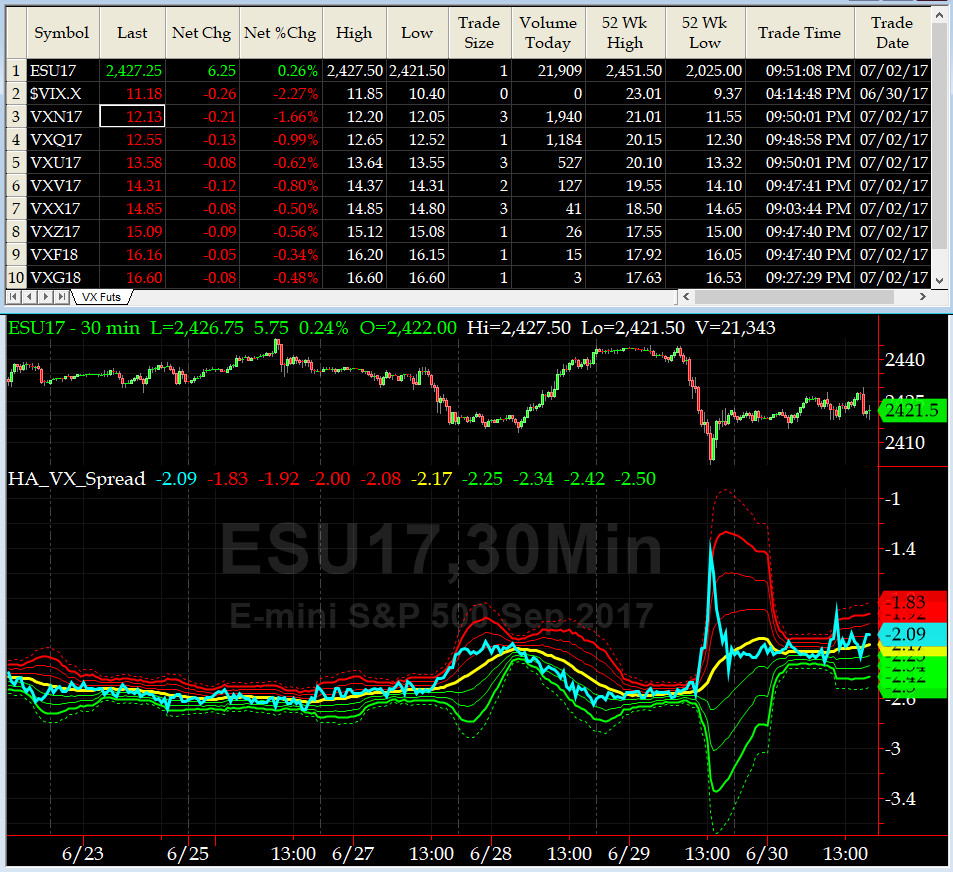
3-month VIX Futures Spread(VX) Chart
This indicator also went nowhere fast during the last week with exception of one quick spike on Thursday. No signal here, as of now.
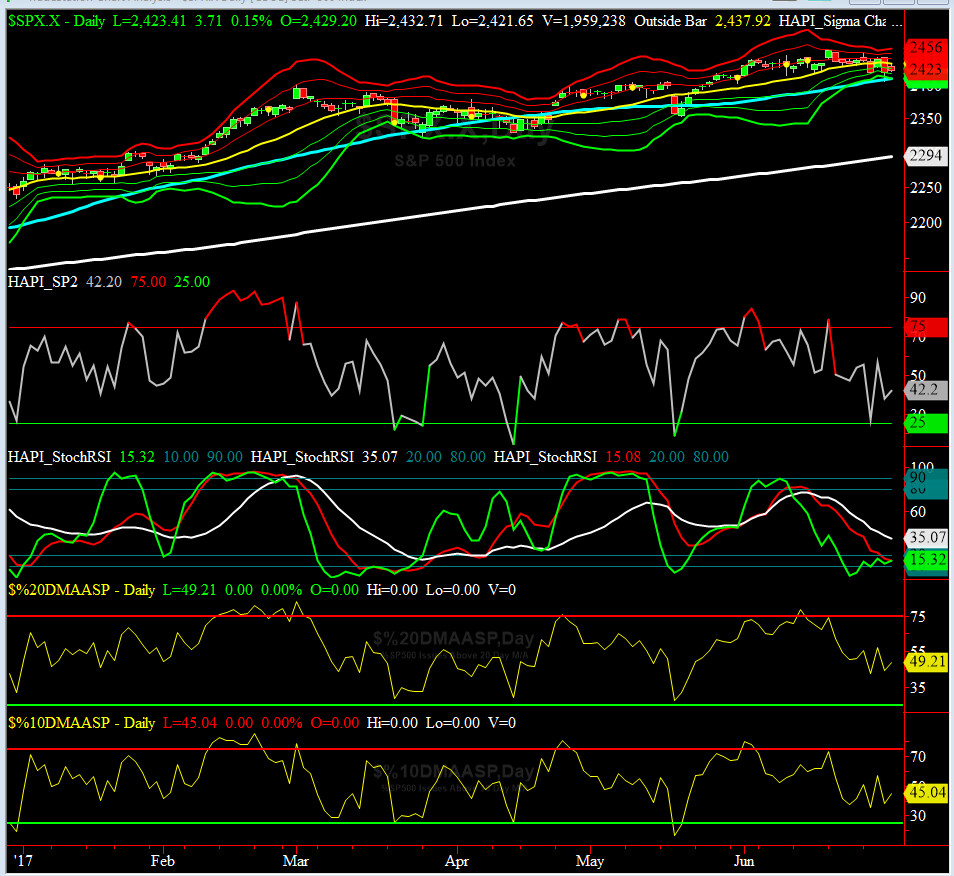
HA_SP2 Chart
HA_SP2 = 42 (Buy signal <= 25, Sell Signal >= 75)
We are just below NEUTRAL zone.... a test of 25 would be great for this bloated market of ours.
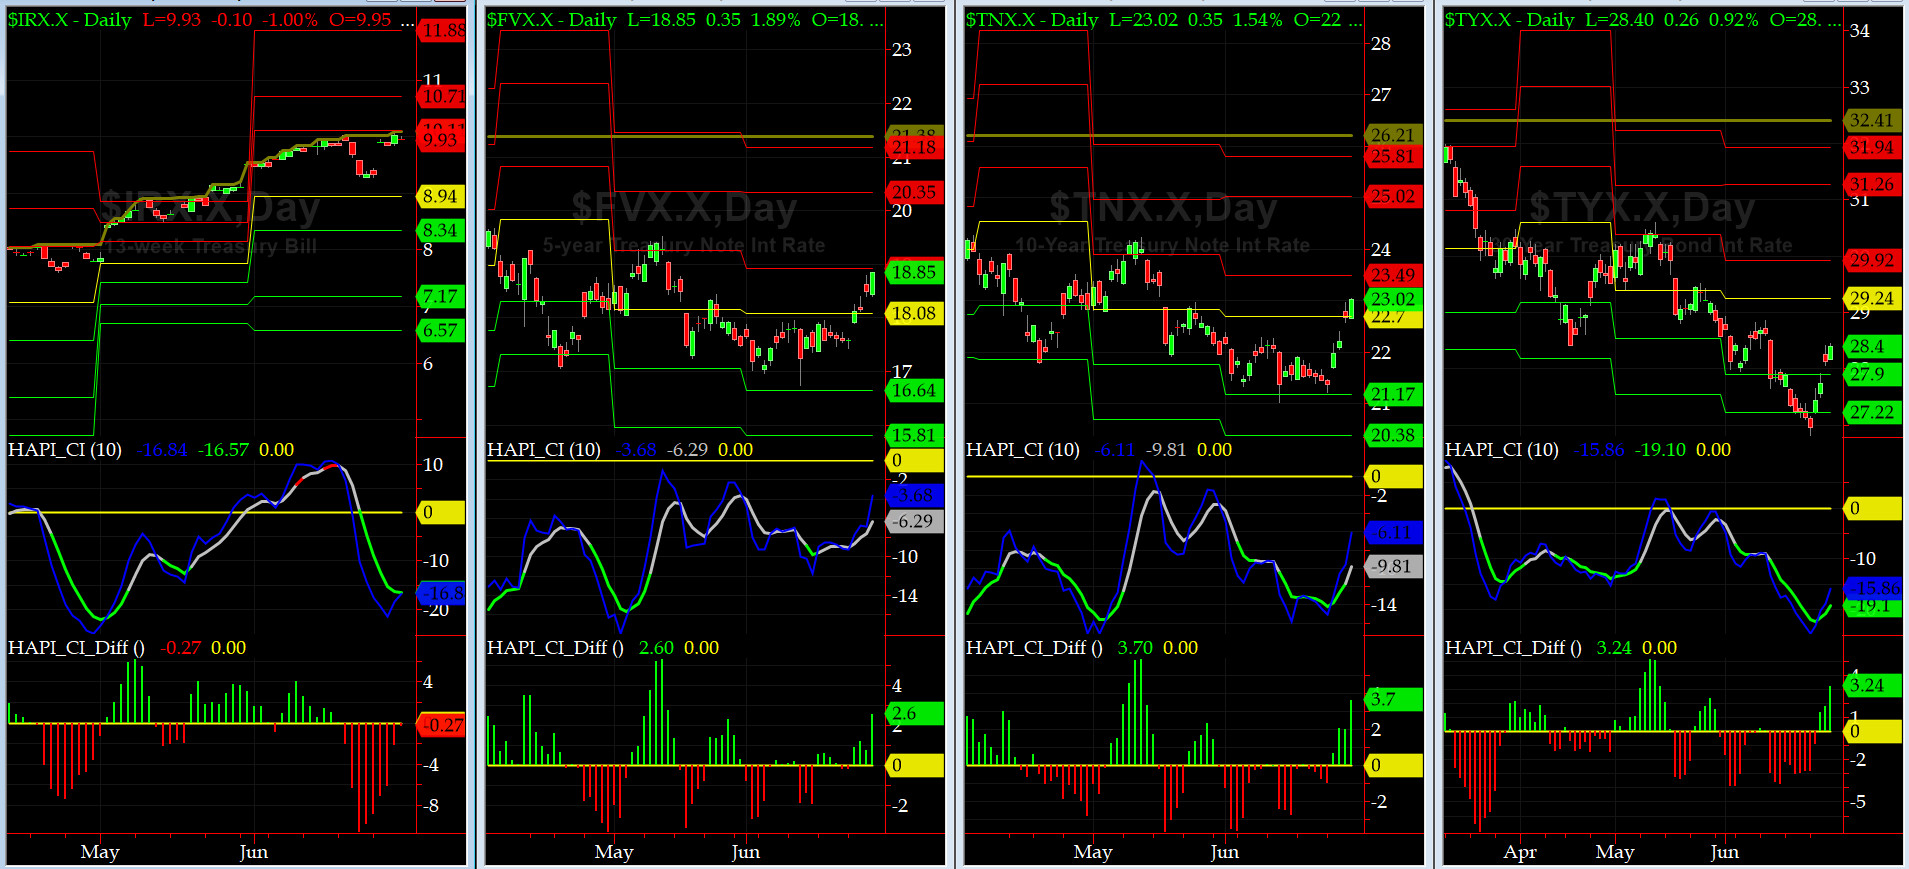
US Treasury T-Notes & T-Bonds Yields Chart
The fast rise in the interest rates should be another alert to all here but the usual suspects (Comedy Central et al) will broom it under the carpet-- at least for now.
Fari Hamzei
|


 Proactive Market Timing