|
Sunday, July 16, 2017, 1930ET
Market Timing Charts, Analysis & Commentary for Issue #201
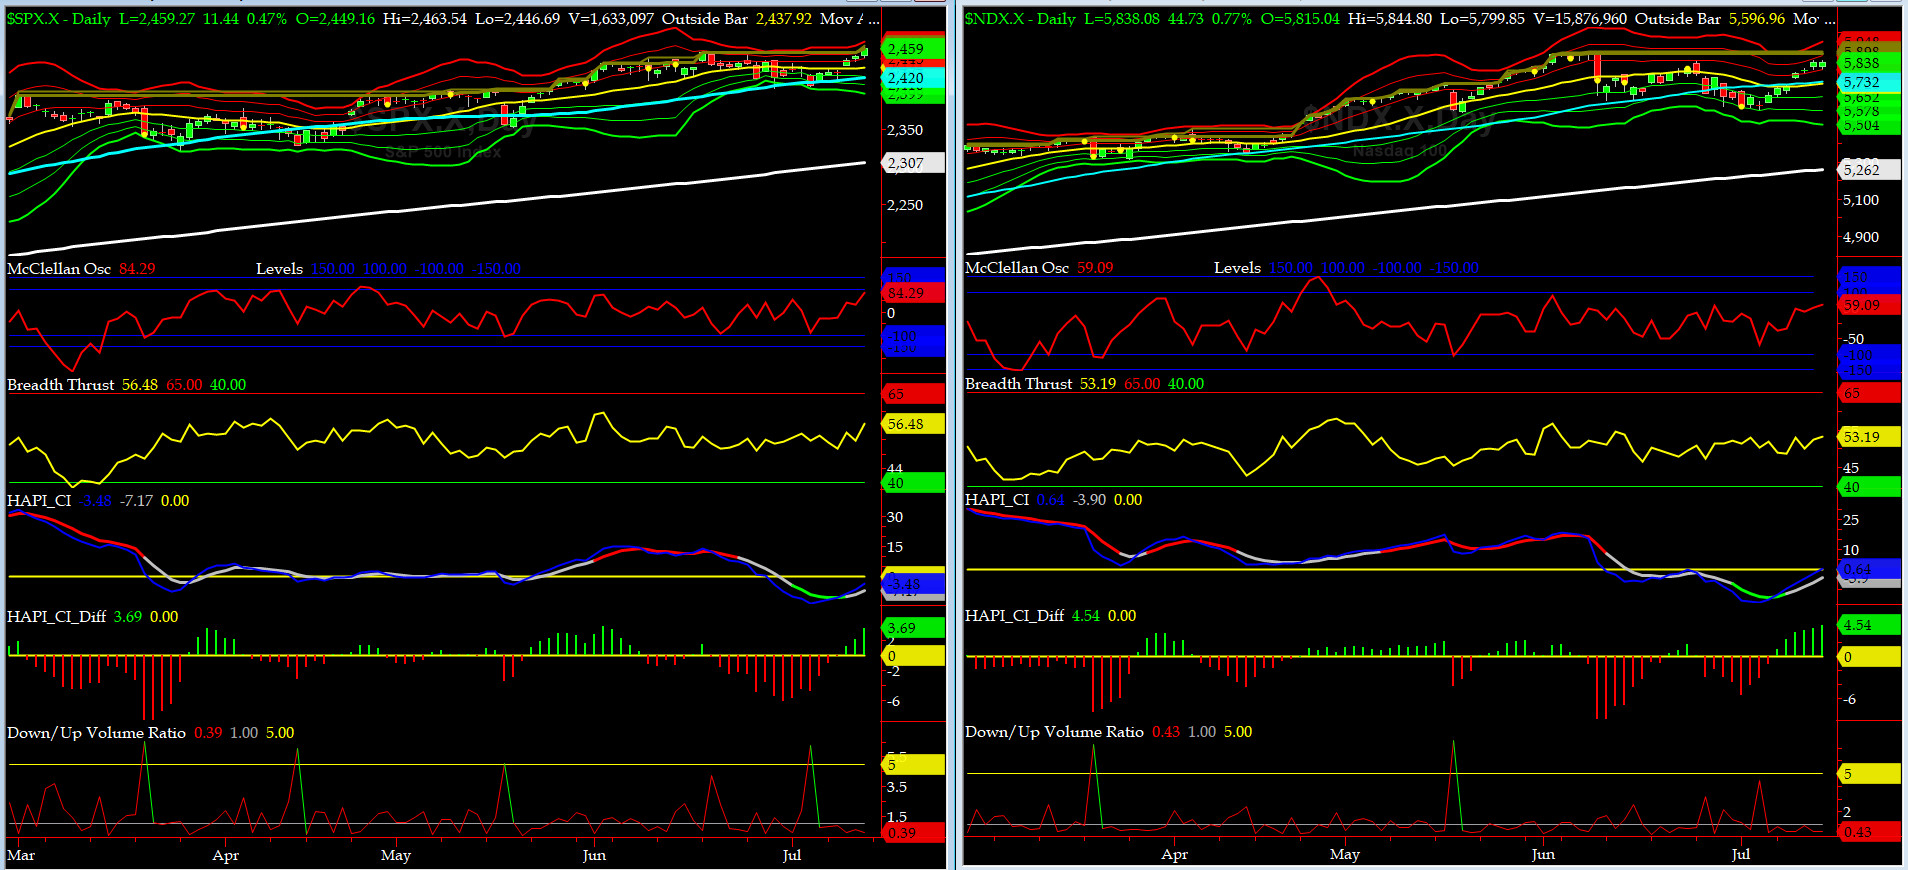
Timer Charts of S&P-500 Cash Index (SPX) + NASDAQ-100 Cash Index (NDX)
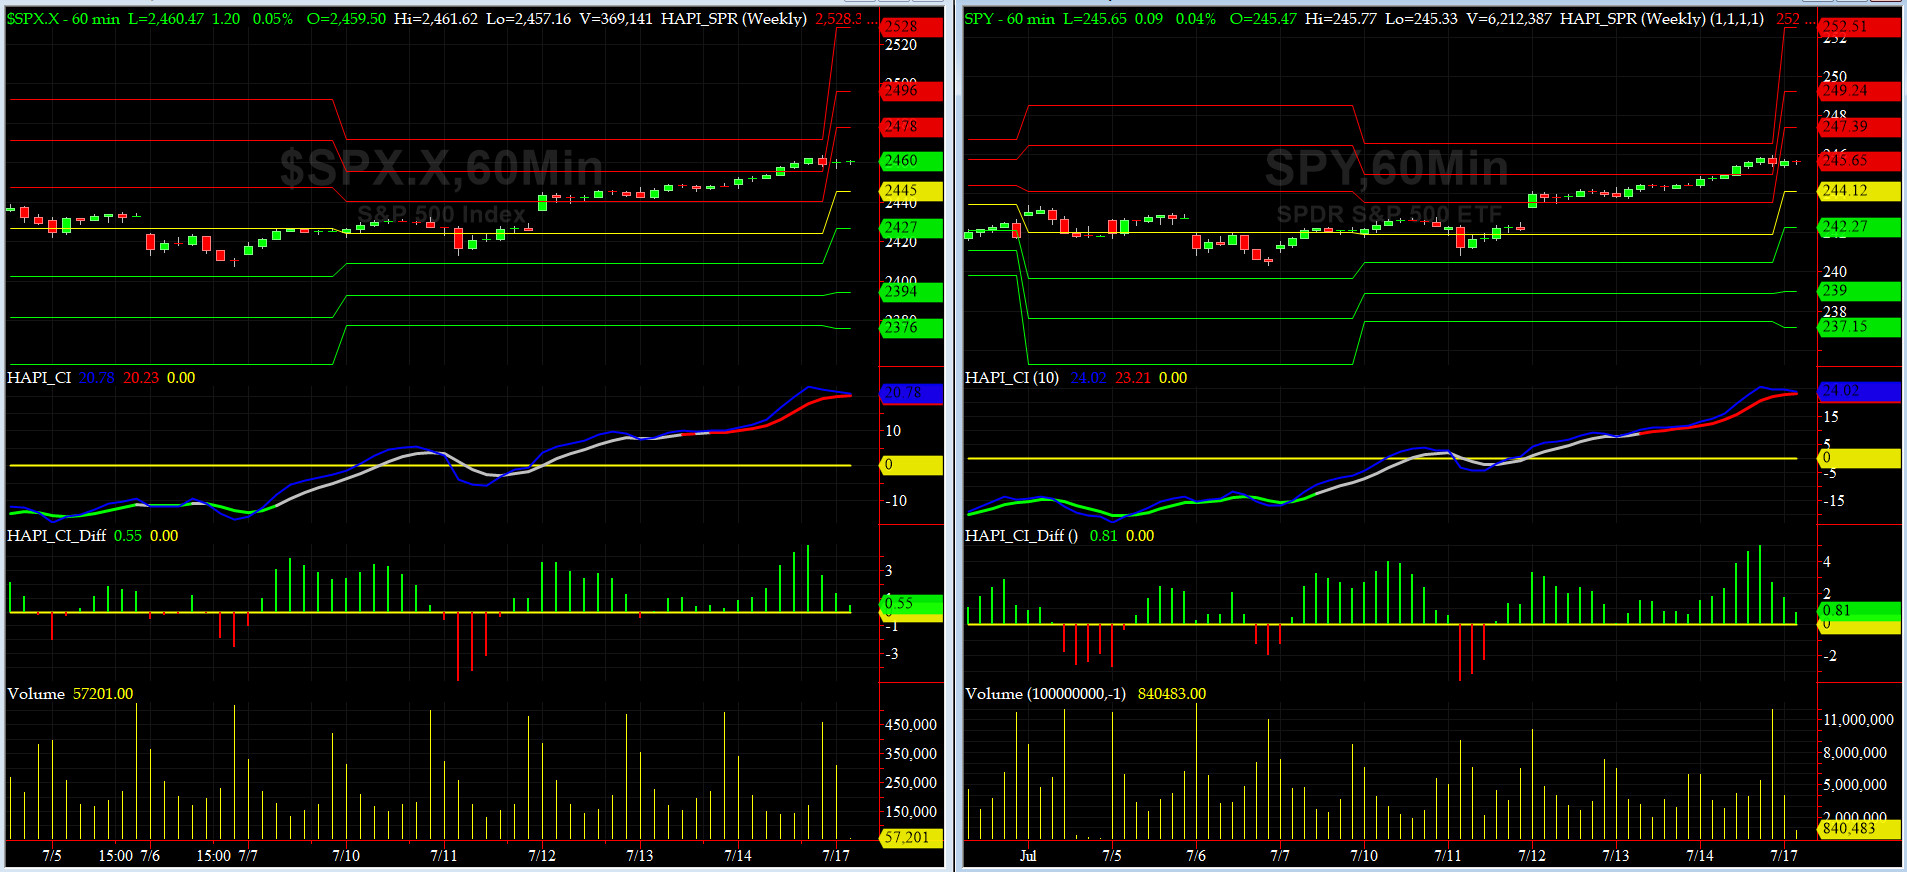
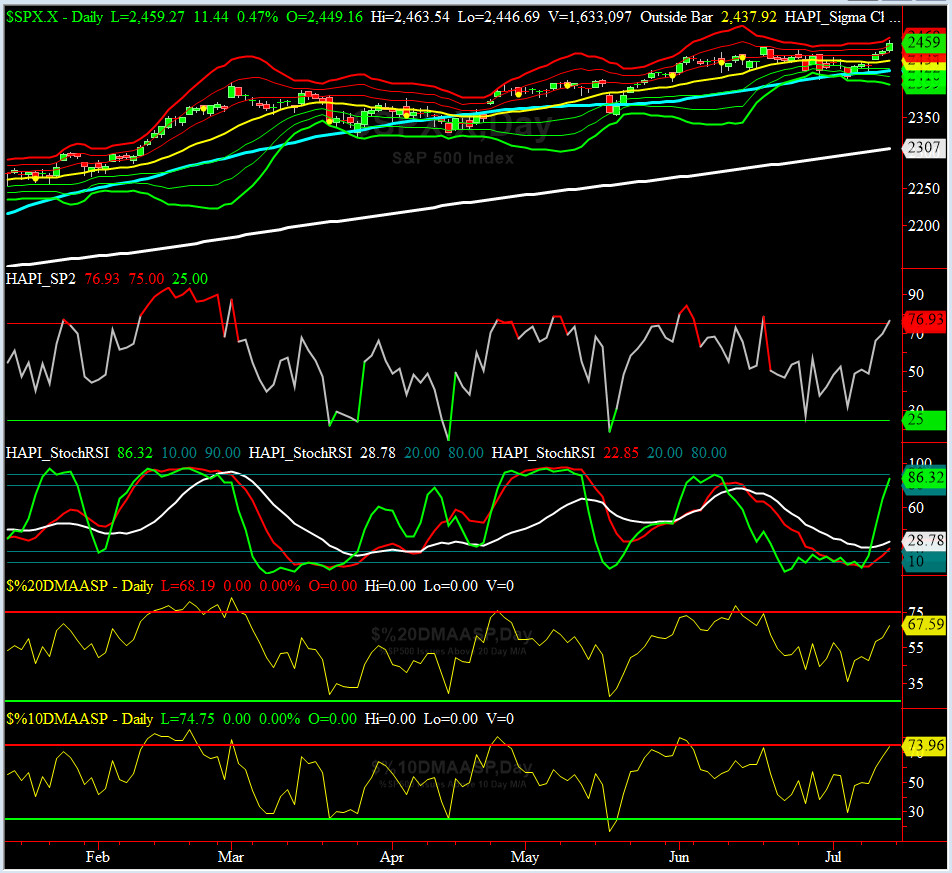
Most recent S&P-500 Cash Index (SPX): 2459.27 up +34.09 (up +1.41%) for the week ending Friday, July 14, 2017, which closed just above its +2 sigma.
SPX ALL TIME INTRADAY HIGH = 2463.54 (reached on Friday, July 14, 2017)
SPX ALL TIME CLOSING HIGH = 2459.27 (reached on Friday, July 14, 2017)
Current DAILY +2 Sigma SPX = 2457 with WEEKLY +2 Sigma = 2467
Current DAILY 0 Sigma (20 day MA) SPX = 2434 with WEEKLY 0 Sigma = 2395
Current DAILY -2 Sigma SPX = 2410 with WEEKLY -2 Sigma = 2323
NYSE McClellan Oscillator = +84.3 (-150 is start of the O/S area; around -275 to -300 area or lower, we go into the �launch-pad� mode, over +150, we are in O/B area)
NYSE Breadth Thrust = 56.5 (40 is considered as oversold and 65 as overbought)
Great run up this week in global indices and we should see some follow thru as we get into Q2 Earnings Season
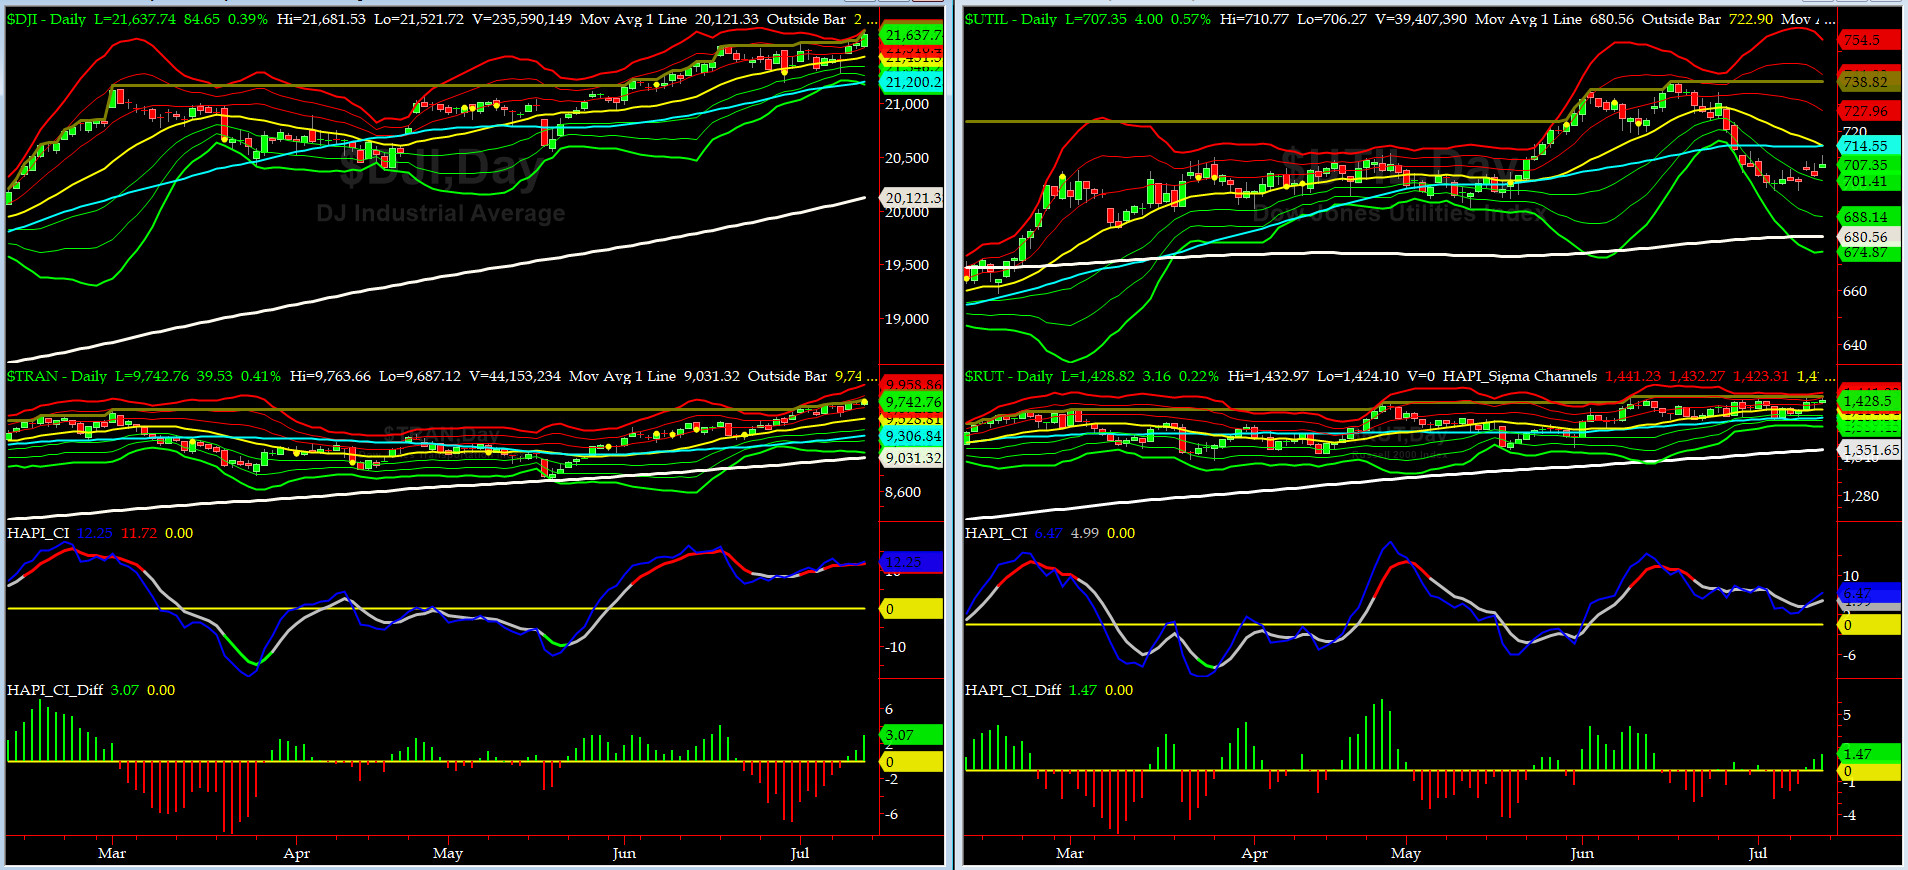
Canaries [in the Coal Mine] Chart for DJ TRAN & RUT Indices
200-Day MA DJ TRAN = 9031 or 7.9% below DJ TRAN (max observed in last 7 yrs = 20.2%, min = -20.3%)
200-Day MA RUT = 1351 or 5.7% below RUT (max observed in last 7 yrs = 21.3%, min = -22.6%)
DJ Transportation Index (proxy for economic conditions 6 to 9 months hence) continued to move higher, and in the process, making a new ATH almost every day this past week.
Russell 2000 Small Caps Index (proxy for Risk ON/OFF) moved higher but it did not break above its ATH "print" on June 9th. Nonetheless, RISK is still ON.
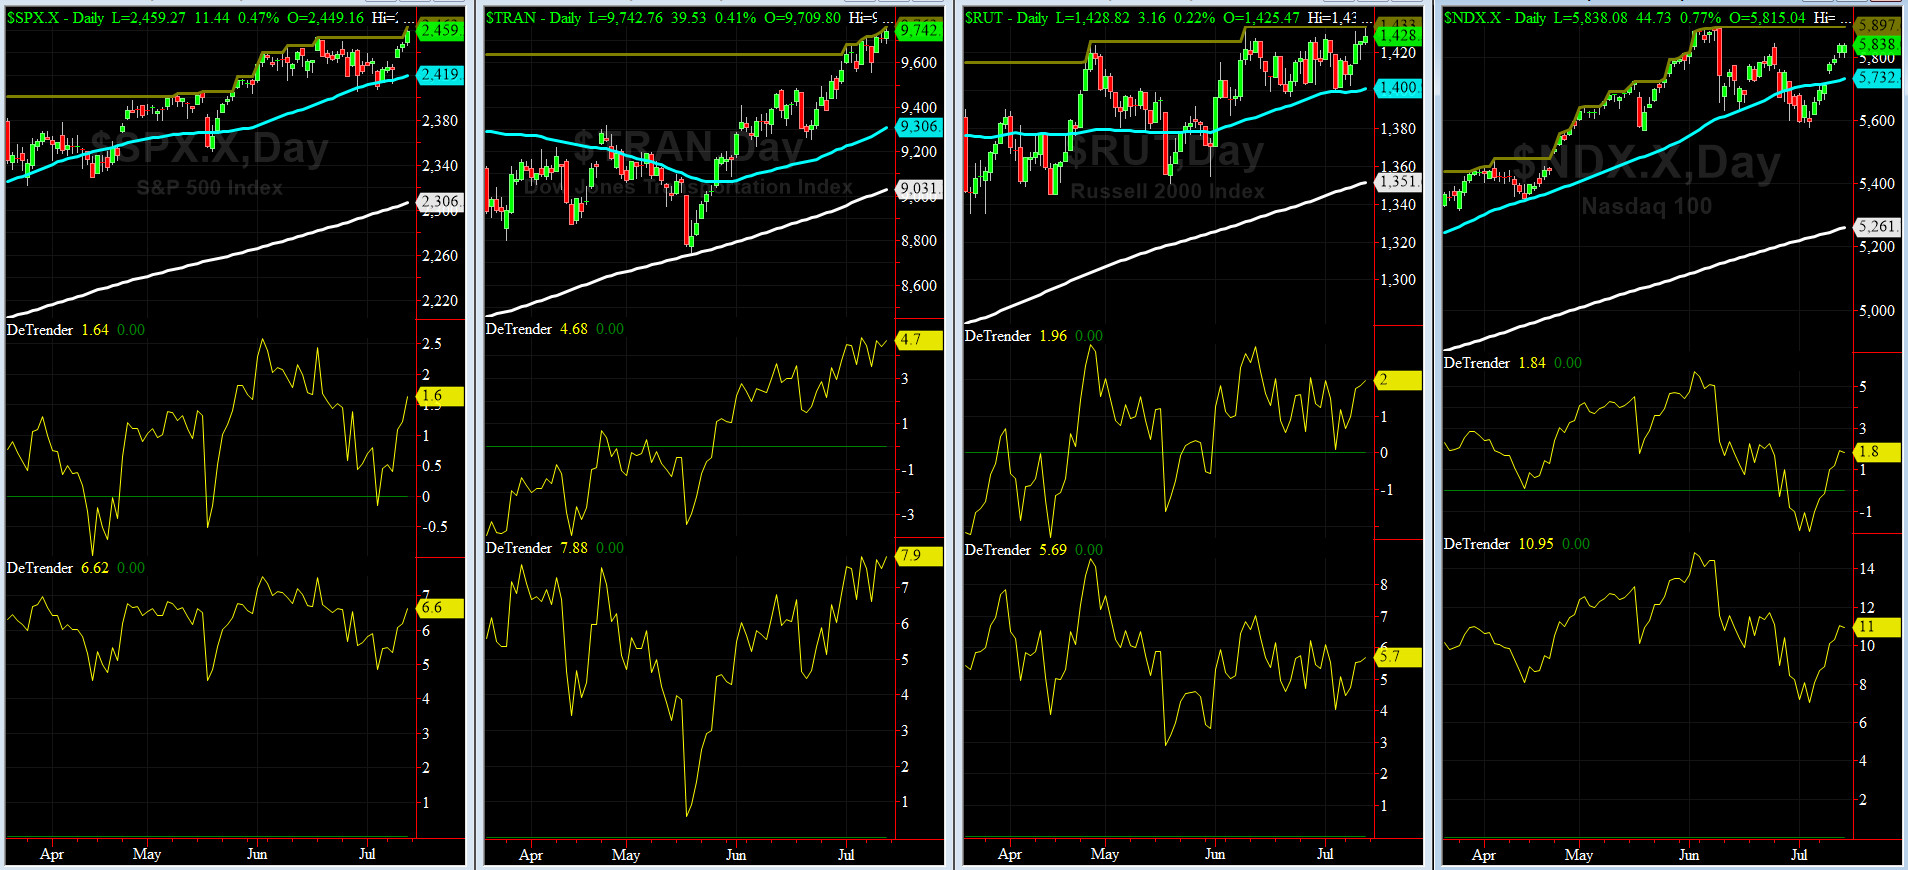
DeTrenders Charts for SPX, NDX, TRAN & RUT Indices
50-Day MA SPX = 2419 or 1.6% below SPX close of Friday (max observed in last 7 yrs = +8.6%, min = -9.3%)
200-Day MA SPX = 2306 or 6.6% below SPX (max observed in last 7 yrs = 15.2%, min = -14%)
Now all of our EIGHT DeTrenders are POSITIVE while the DeTrenders for DJ Tran & RUT will continue to be harbingers of future price behavior in broad indices.
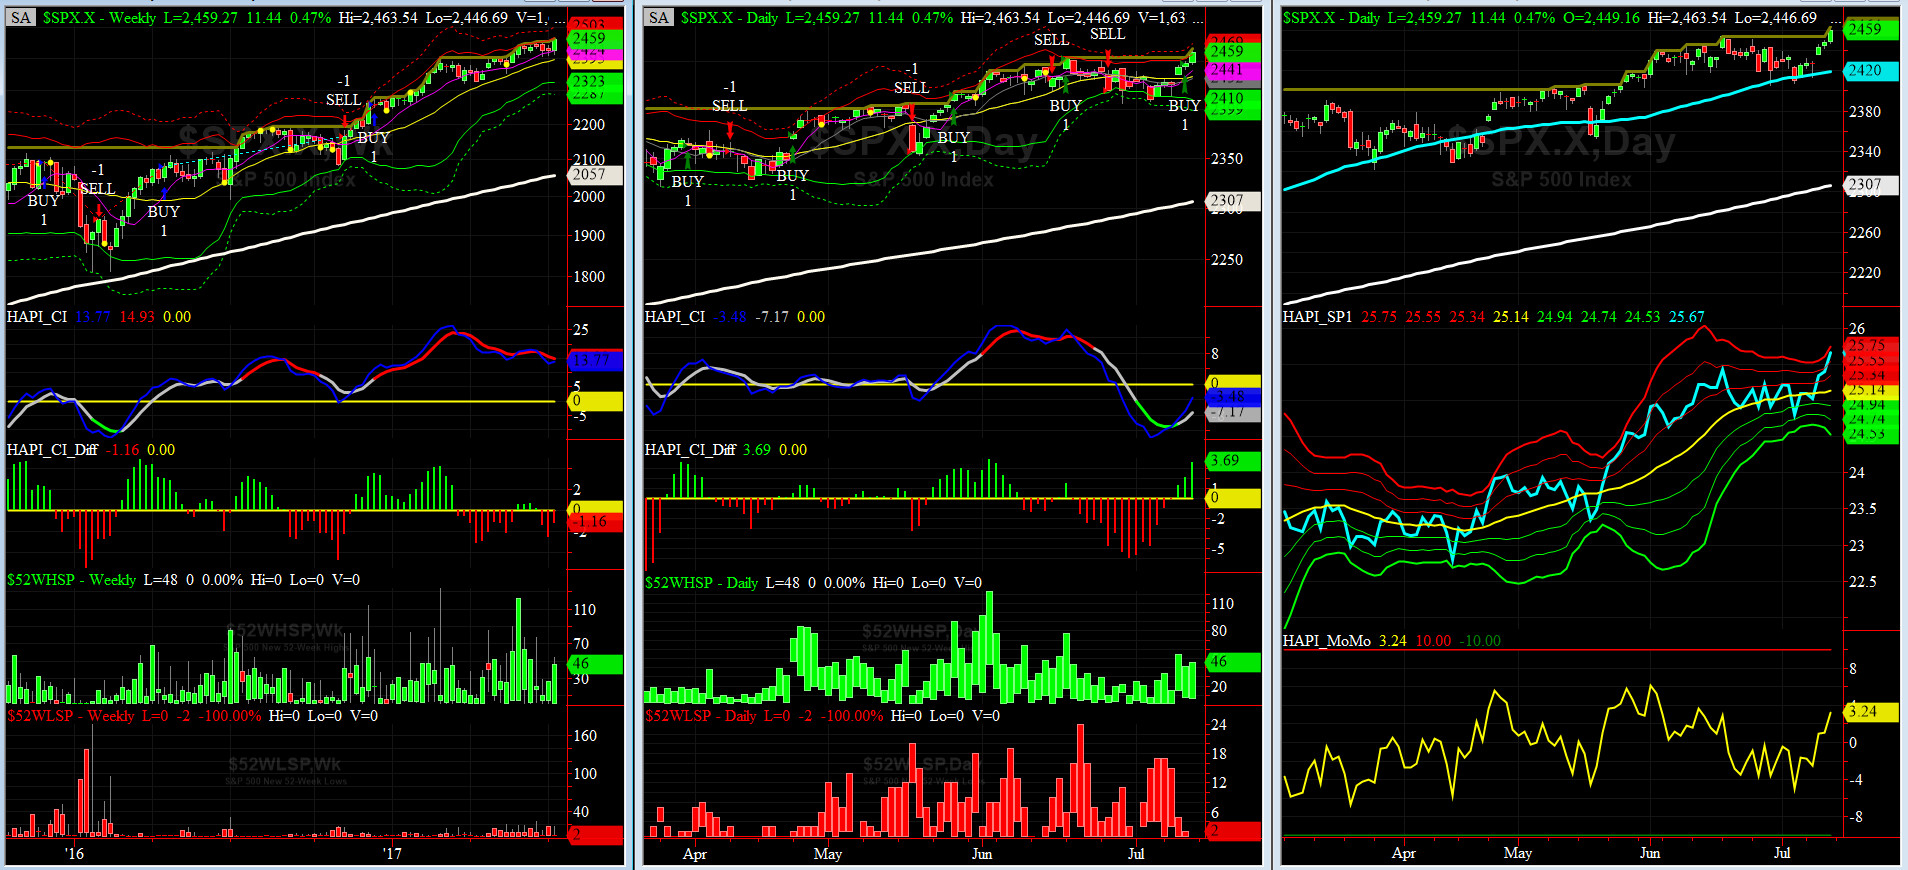
HA_SP1_Momo Chart
WEEKLY Timing Model = on a BUY Signal since Friday 12/16/16 CLOSE at 2258
DAILY Timing Model = on a BUY Signal since Thursday 7/13/17 CLOSE at 2448
Max SPX 52wk-highs reading last week = 54 (over 120-140, the local maxima is in)
Max SPX 52wk-Lows reading last week = 17 (over 40-60, the local minima is in)
HA_SP1 closed at just about its +3 sigma channels
HA_Momo = +3.2 (reversals most likely occur above +10 or below -10)
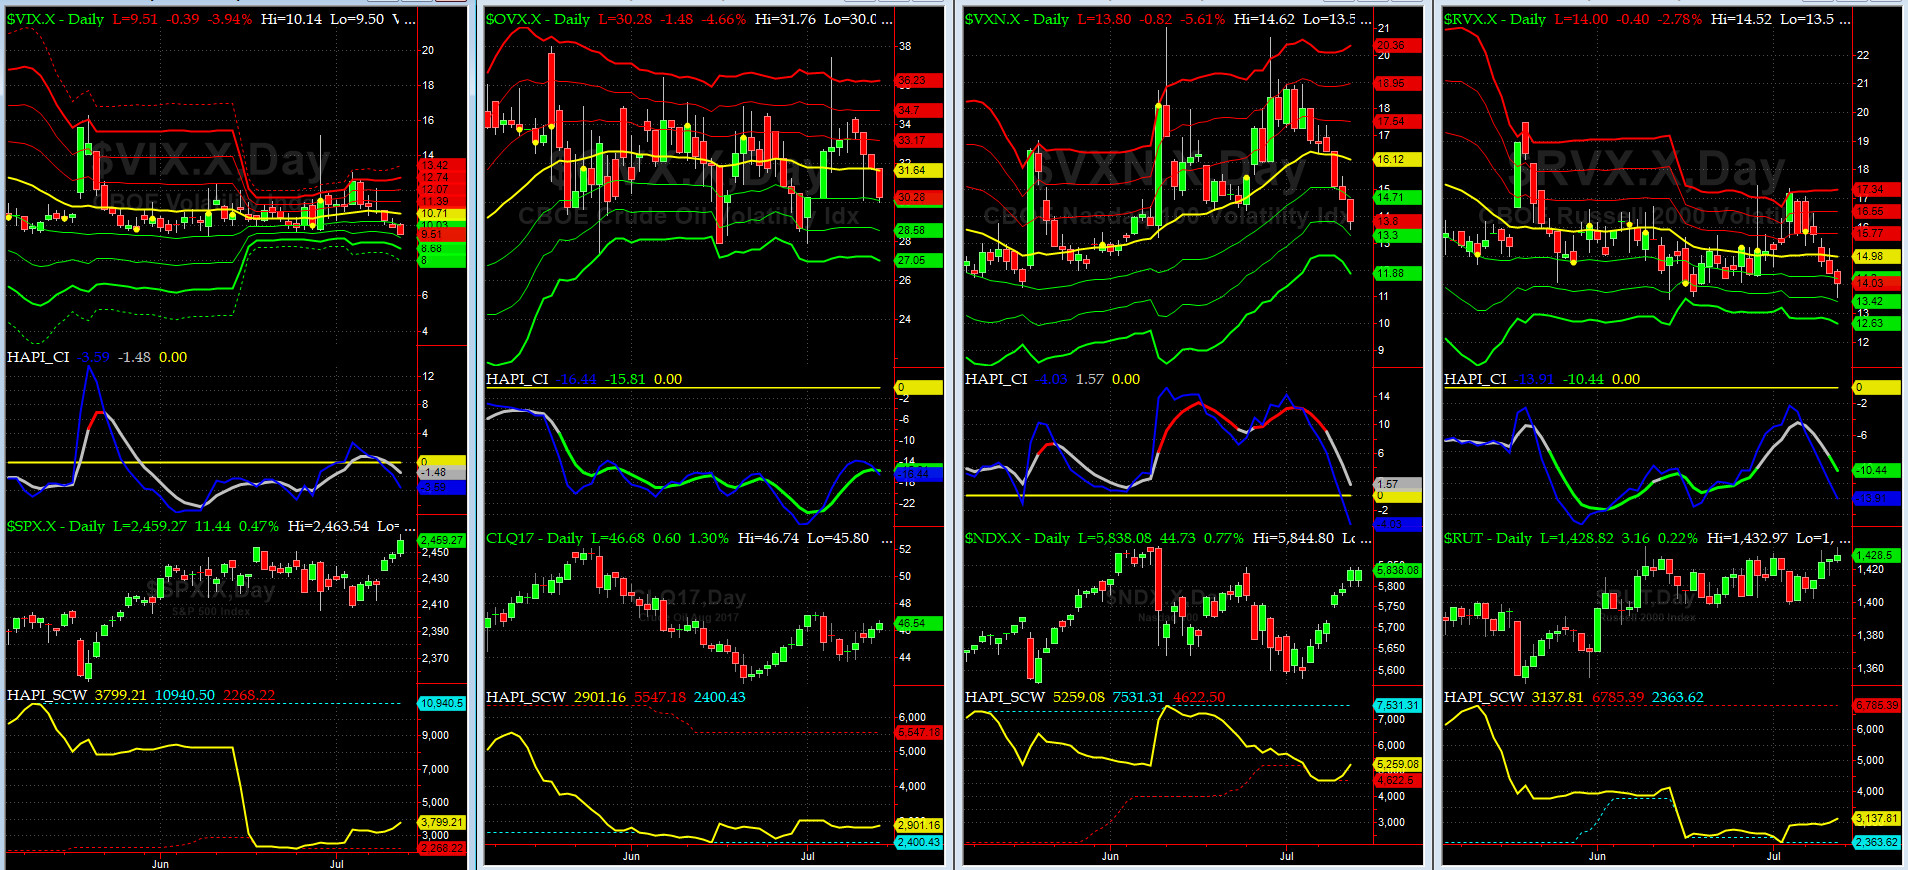
Vol of the Vols Chart
VIX currently stands at 9.5, or just at its -2 sigma (remember it's the VIX volatility pattern ( its sigma channels) that matters, and not the level of VIX itself ( this is per Dr. Robert Whaley, a great mentor and inventor of original VIX, now called VXO ). VIX usually peaks around a test of its +4 sigma).
Vol Indices downshifted this past week, with the exception of WTI crude.
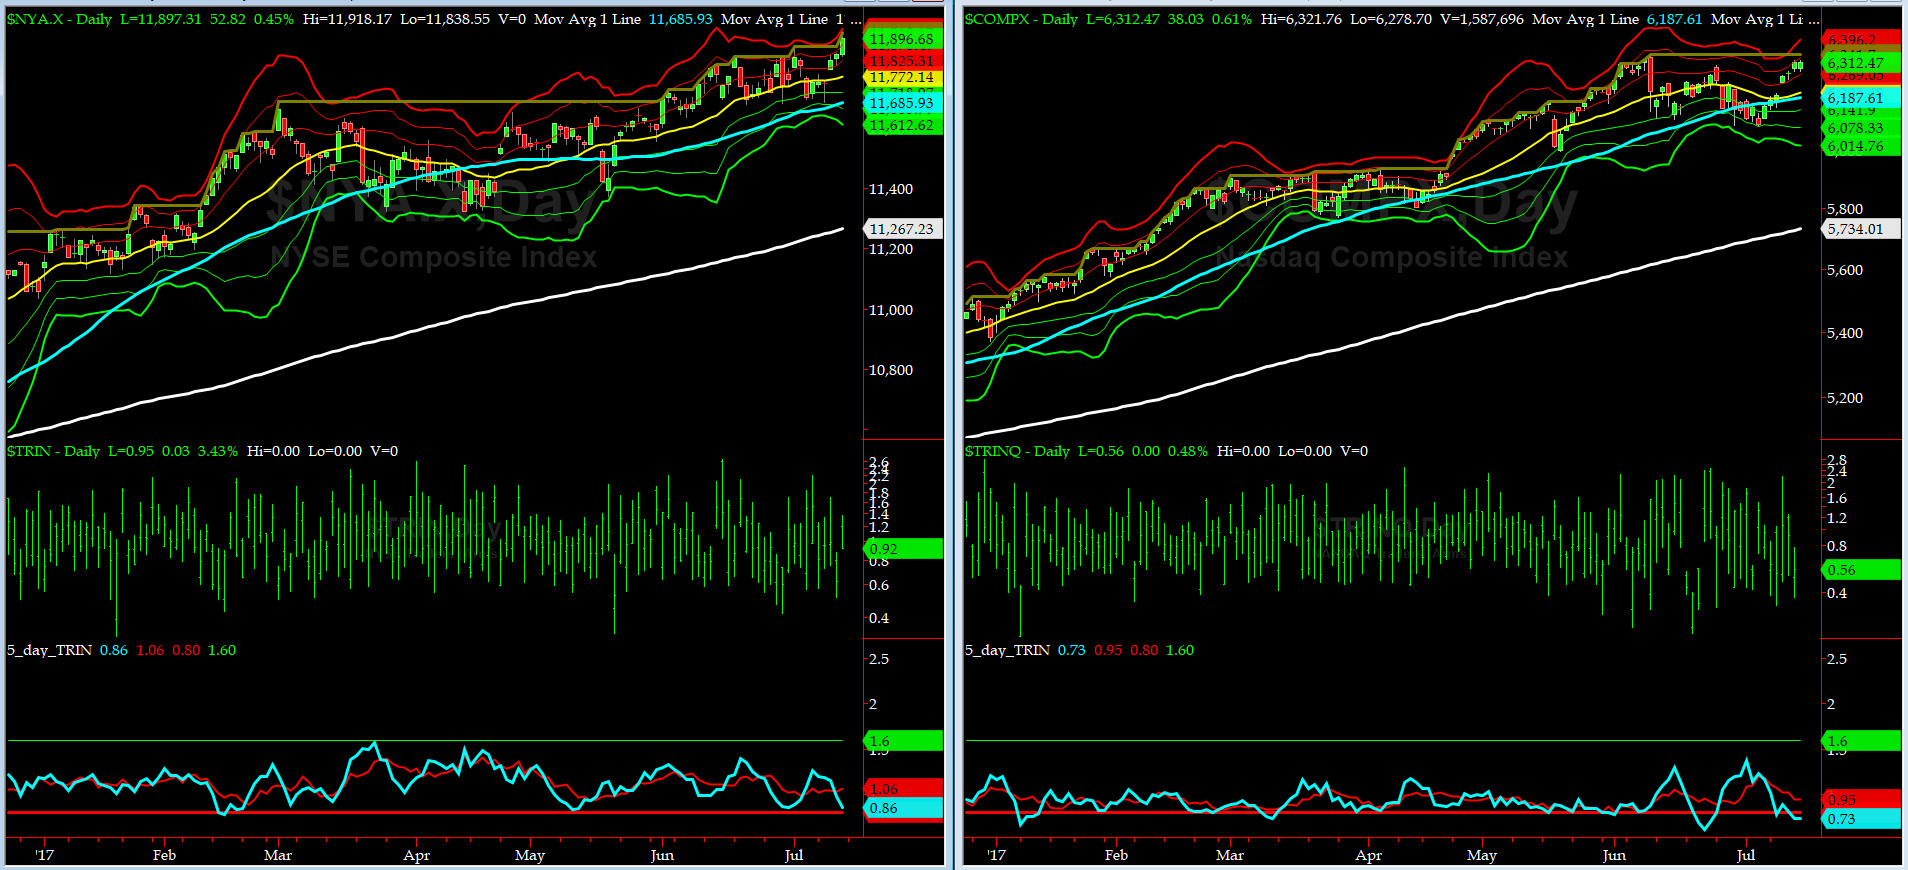
5-day TRIN & TRINQ Charts
The both NYSE & NASDAQ 5-day TRINs are on SELL signals.
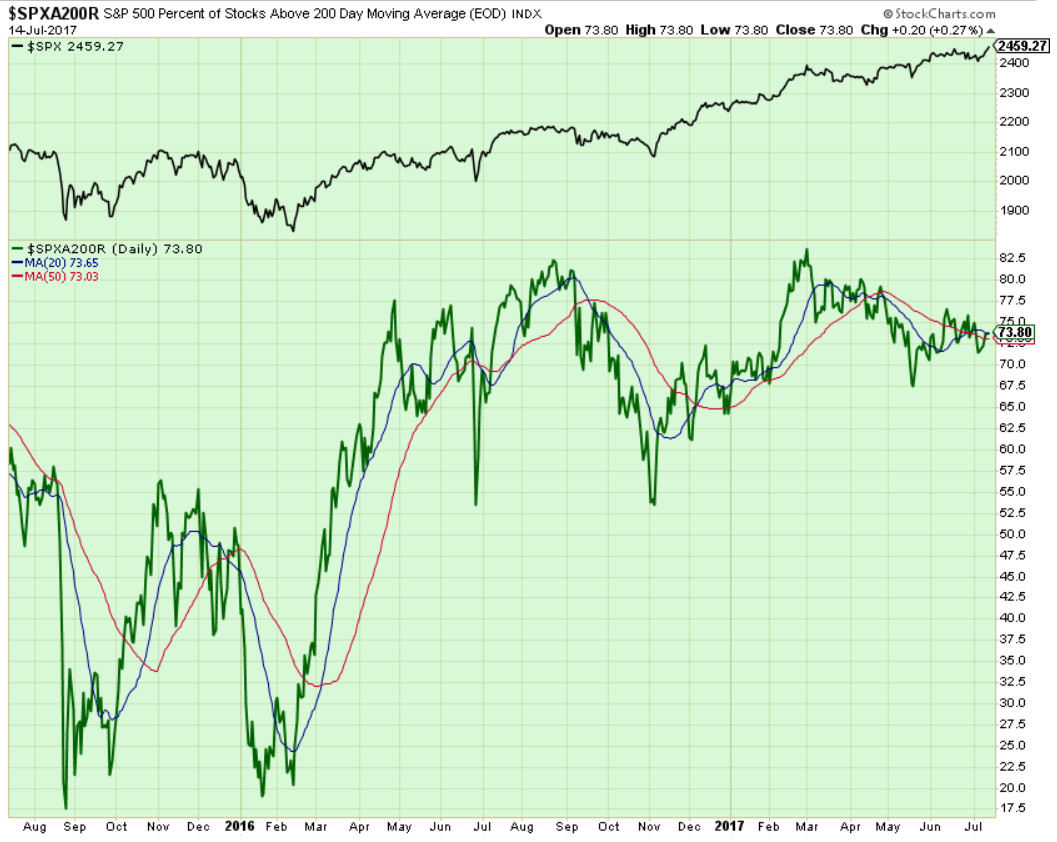
Components of SPX above their respective 200day MA Chart
This scoring indicator continues to exhibit divergences with SPX. Closed at 73.8%. A test of 77% is next.

SPX SKEW (Tail Risk) Chart
Last week SPX SKEW (Tail Risk) rose up this past week to is +2 sigma, or about 138 (normal = 120-125, range 100-150).
Is all quiet on the Eastern & Mid-Western Fronts? Of course NOT. This ain't over till the Fat Lady sings.
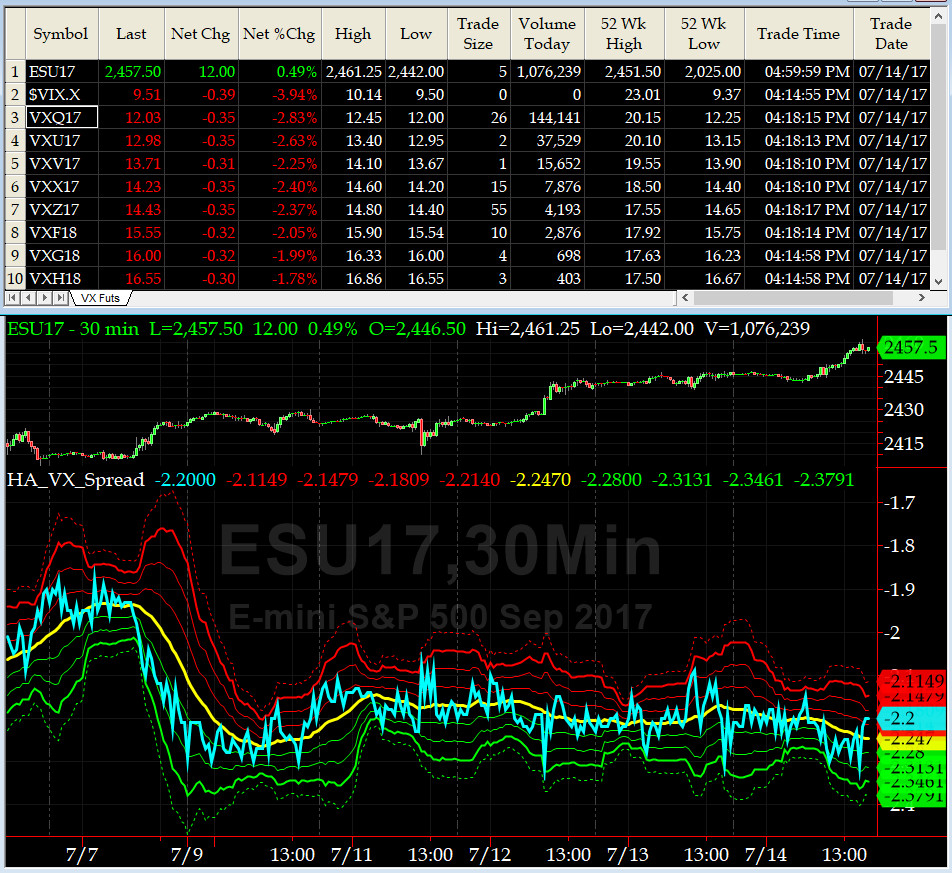
3-month VIX Futures Spread(VX) Chart
We are now tracking AUG minus NOV VX Spread. We again state that this indicator went no nowhere fast during the past week.
HA_SP2 Chart
HA_SP2 = 77 (Buy signal <= 25, Sell Signal >= 75)
Our fav prop indicator had a great run this past week (from 32 to 77). Now we have to watch this indicator carefully for any clues.
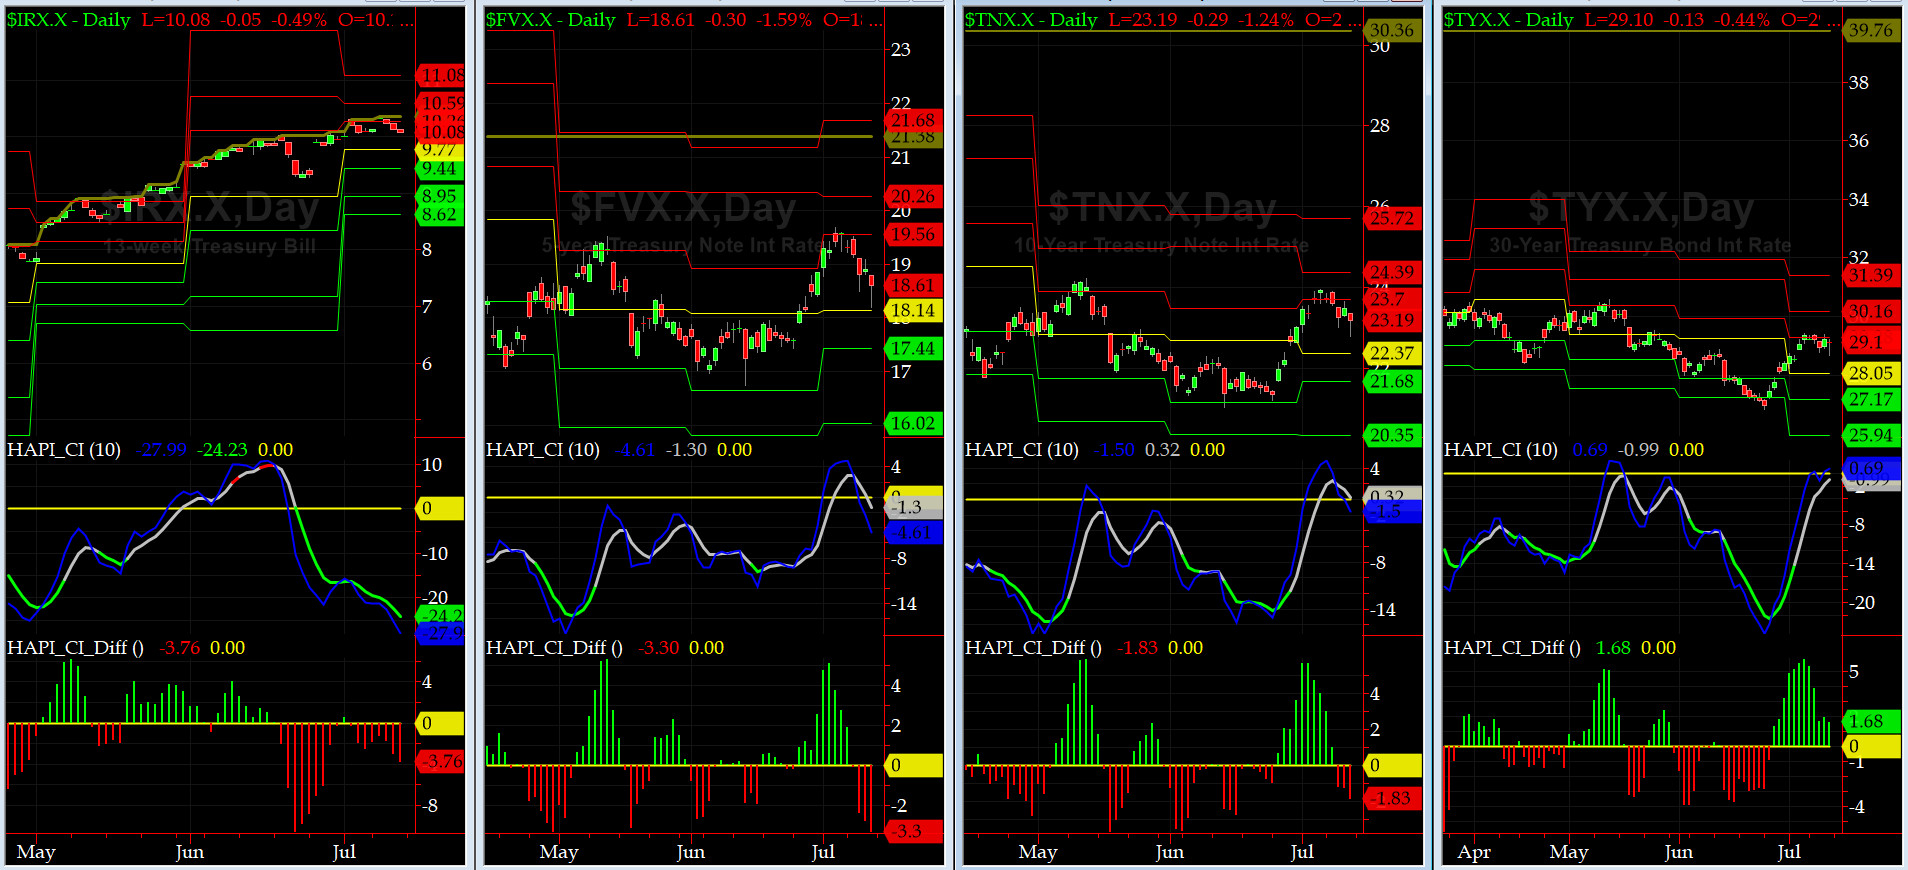
US Treasury T-Notes & T-Bonds Yields Chart
The Treasury Market eased off this past week with the most impact in 5-yr notes.
Fari Hamzei
|


 Proactive Market Timing