|
Sunday, July 23, 2017, 1615ET
Market Timing Charts, Analysis & Commentary for Issue #202
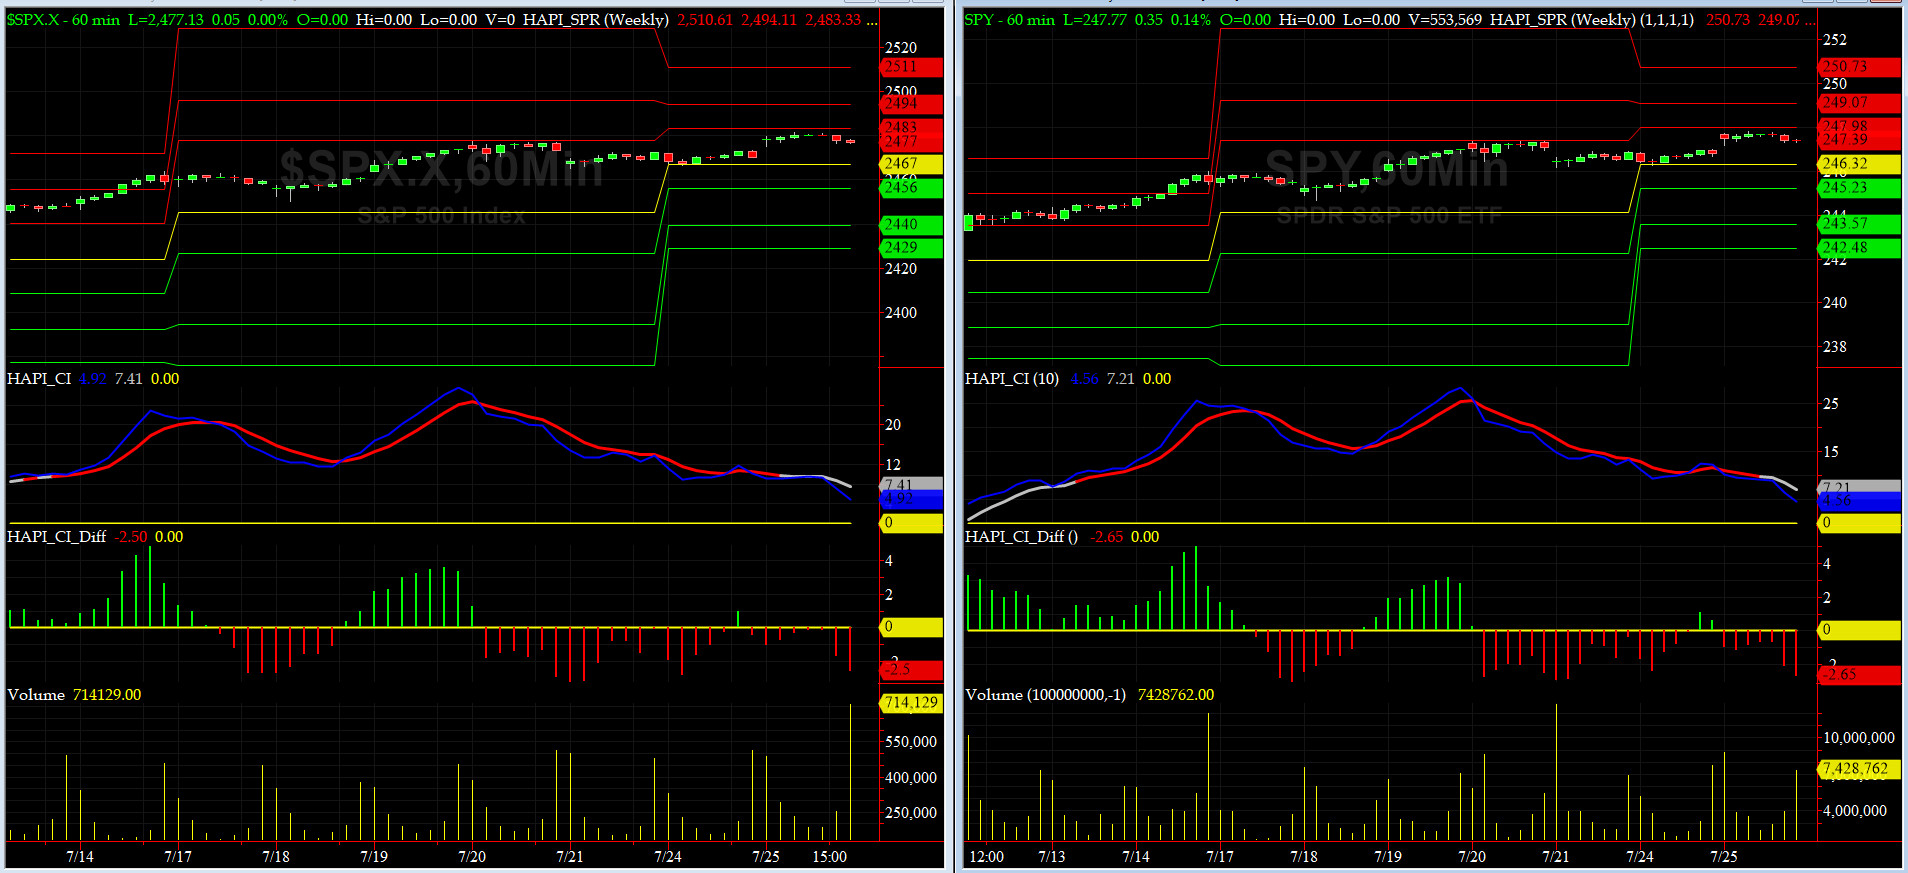
Timer Charts of S&P-500 Cash Index (SPX) + NASDAQ-100 Cash Index (NDX)
Most recent S&P-500 Cash Index (SPX): 2472.54 up +13.27 (up +0.54%) for the week ending Friday, July 21, 2017, which closed just above its +1 sigma.
SPX ALL TIME INTRADAY HIGH = 2477.62 (reached on Thursday, July 20, 2017)
SPX ALL TIME CLOSING HIGH = 2473.83 (reached on Wednesday, July 19, 2017)
Current DAILY +2 Sigma SPX = 2479 with WEEKLY +2 Sigma = 2478
Current DAILY 0 Sigma (20 day MA) SPX = 2441 with WEEKLY 0 Sigma = 2399
Current DAILY -2 Sigma SPX = 2403 with WEEKLY -2 Sigma = 2320
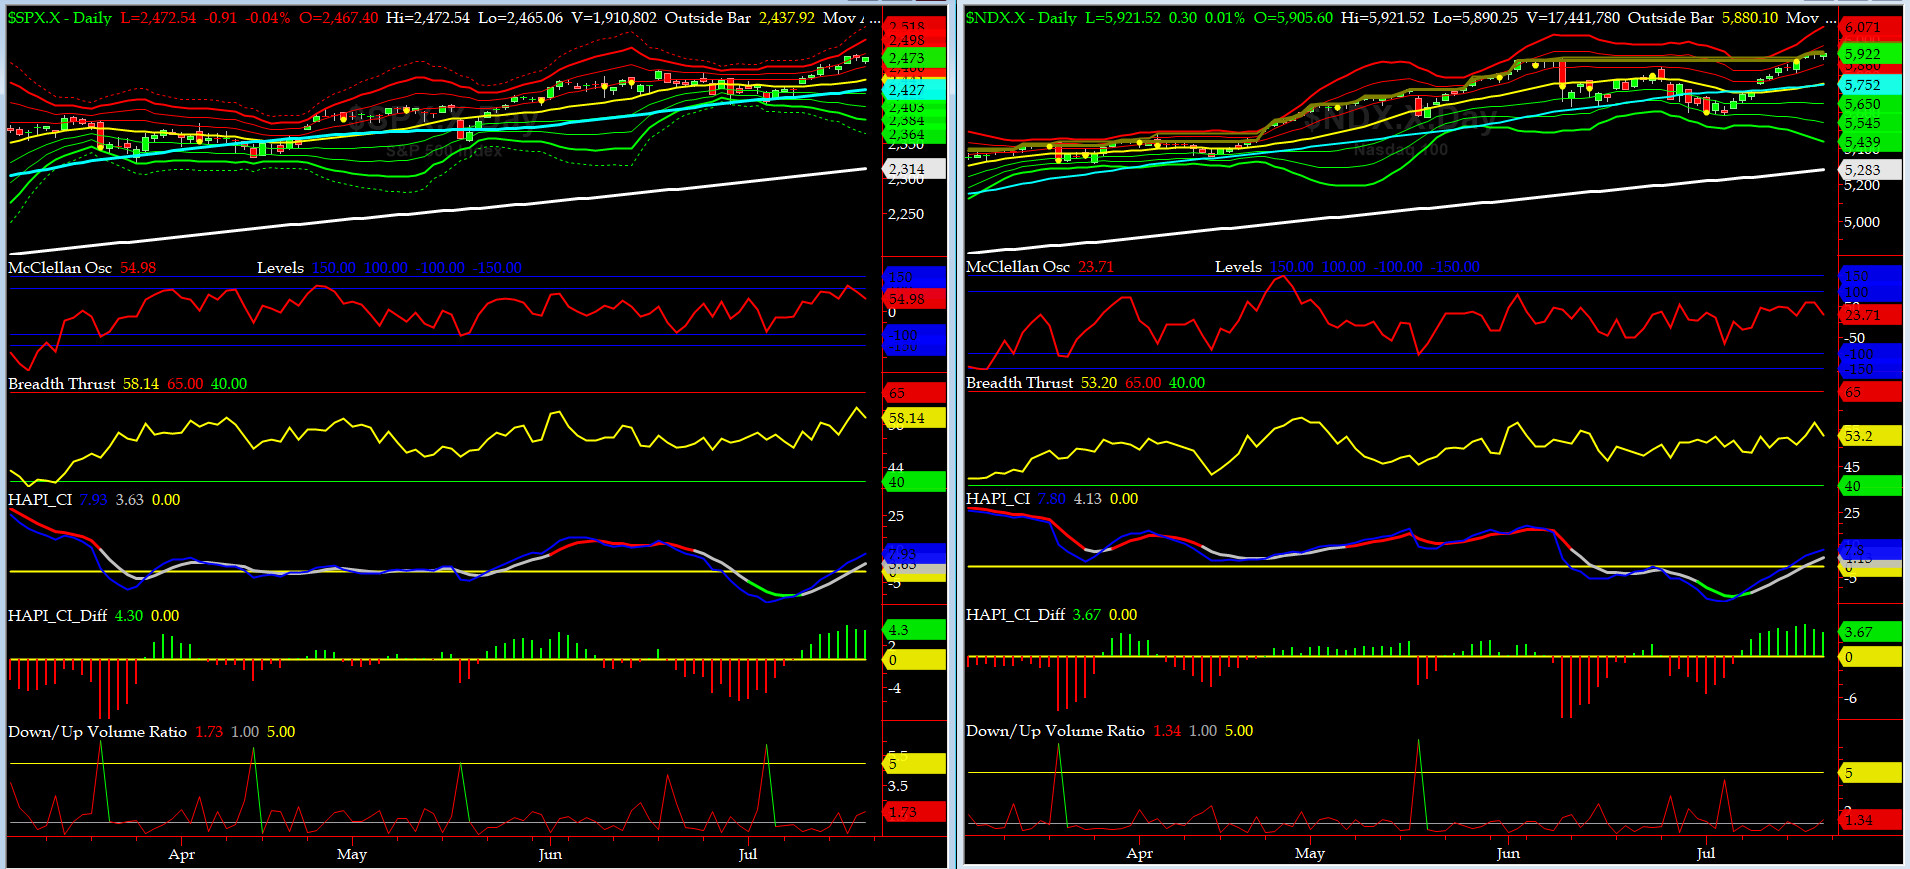
NYSE McClellan Oscillator = +55 (-150 is start of the O/S area; around -275 to -300 area or lower, we go into the �launch-pad� mode, over +150, we are in O/B area)
NYSE Breadth Thrust = 58.1 (40 is considered as oversold and 65 as overbought)
Another great run-up due mainly to an over all solid earnng season but SPX did not reach 2500 (major price octave).
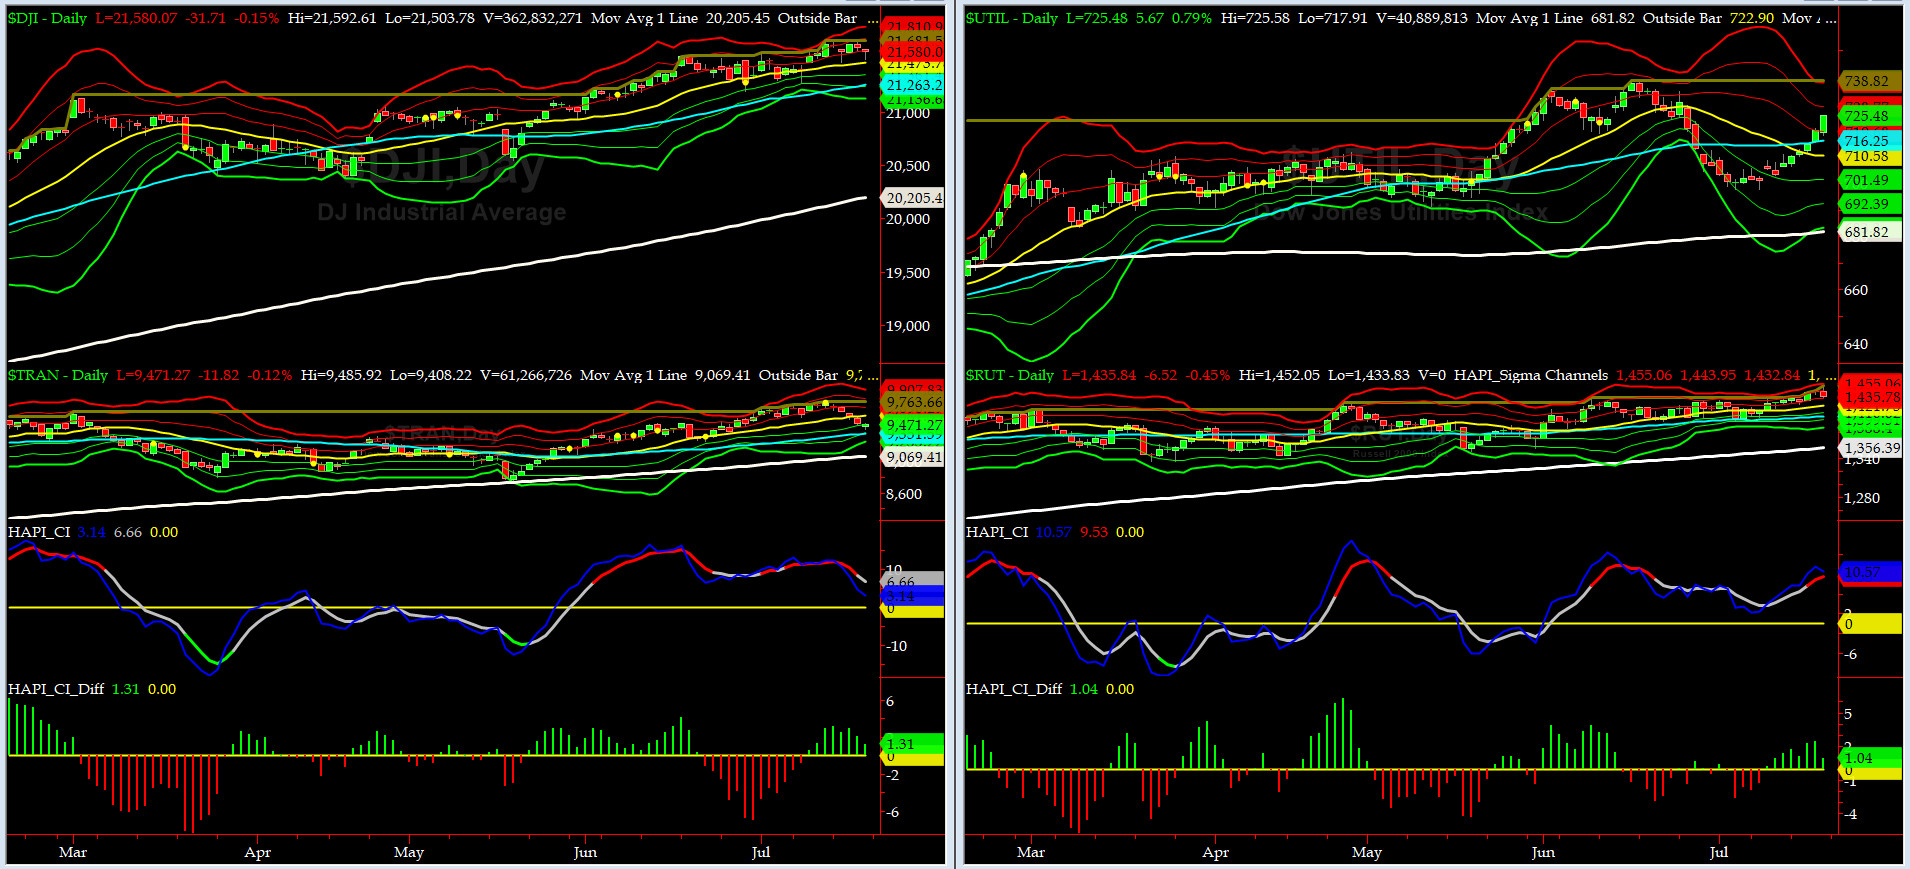
Canaries [in the Coal Mine] Chart for DJ TRAN & RUT Indices
200-Day MA DJ TRAN = 9069 or 4.4% below DJ TRAN (max observed in last 7 yrs = 20.2%, min = -20.3%)
200-Day MA RUT = 1356 or 5.9% below RUT (max observed in last 7 yrs = 21.3%, min = -22.6%)
DJ Transportation Index (proxy for economic conditions 6 to 9 months hence) SOLD OFF pretty hard this past week. This is not a good omen, specially in a week that most other indices made new ATHs.
Russell 2000 Small Caps Index (proxy for Risk ON/OFF) has made four new ATHs out of last five trading sessions.... meaning, RISK is ON big time.
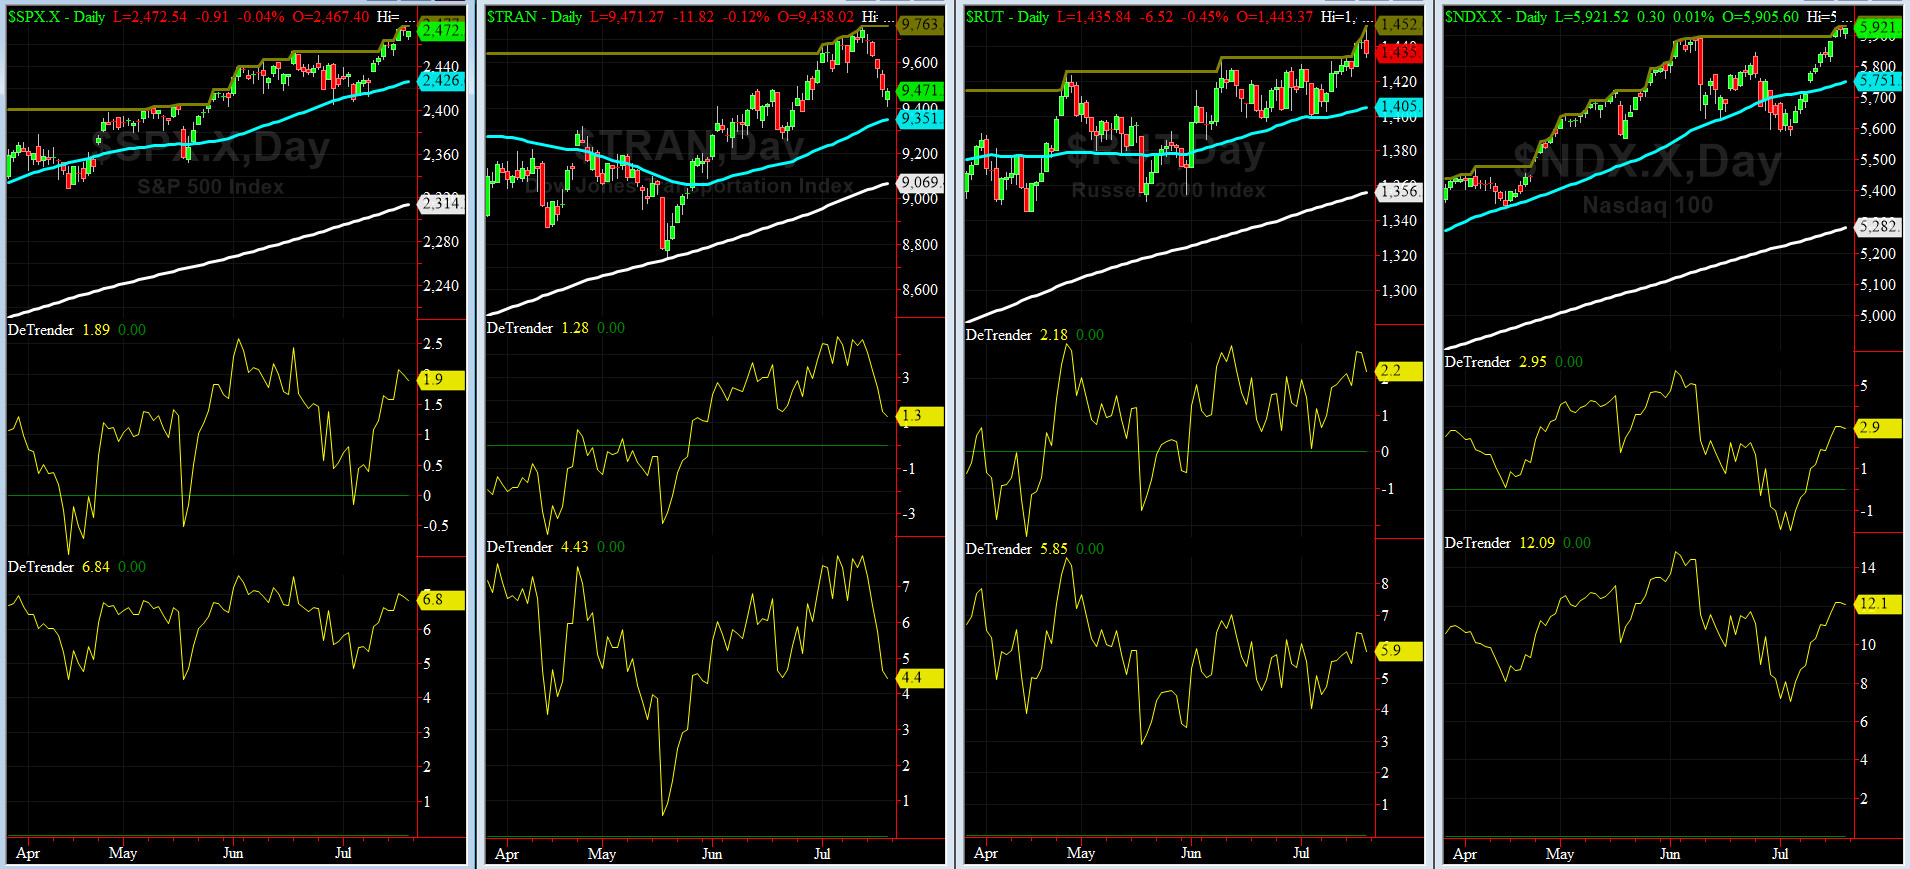
DeTrenders Charts for SPX, NDX, TRAN & RUT Indices
50-Day MA SPX = 2426 or 1.9% below SPX close of Friday (max observed in last 7 yrs = +8.6%, min = -9.3%)
200-Day MA SPX = 2314 or 6.8% below SPX (max observed in last 7 yrs = 15.2%, min = -14%)
Again this week, all of our EIGHT DeTrenders are POSITIVE while the DeTrenders for DJ Tran & RUT will continue to be harbingers of future price behavior in broad indices.
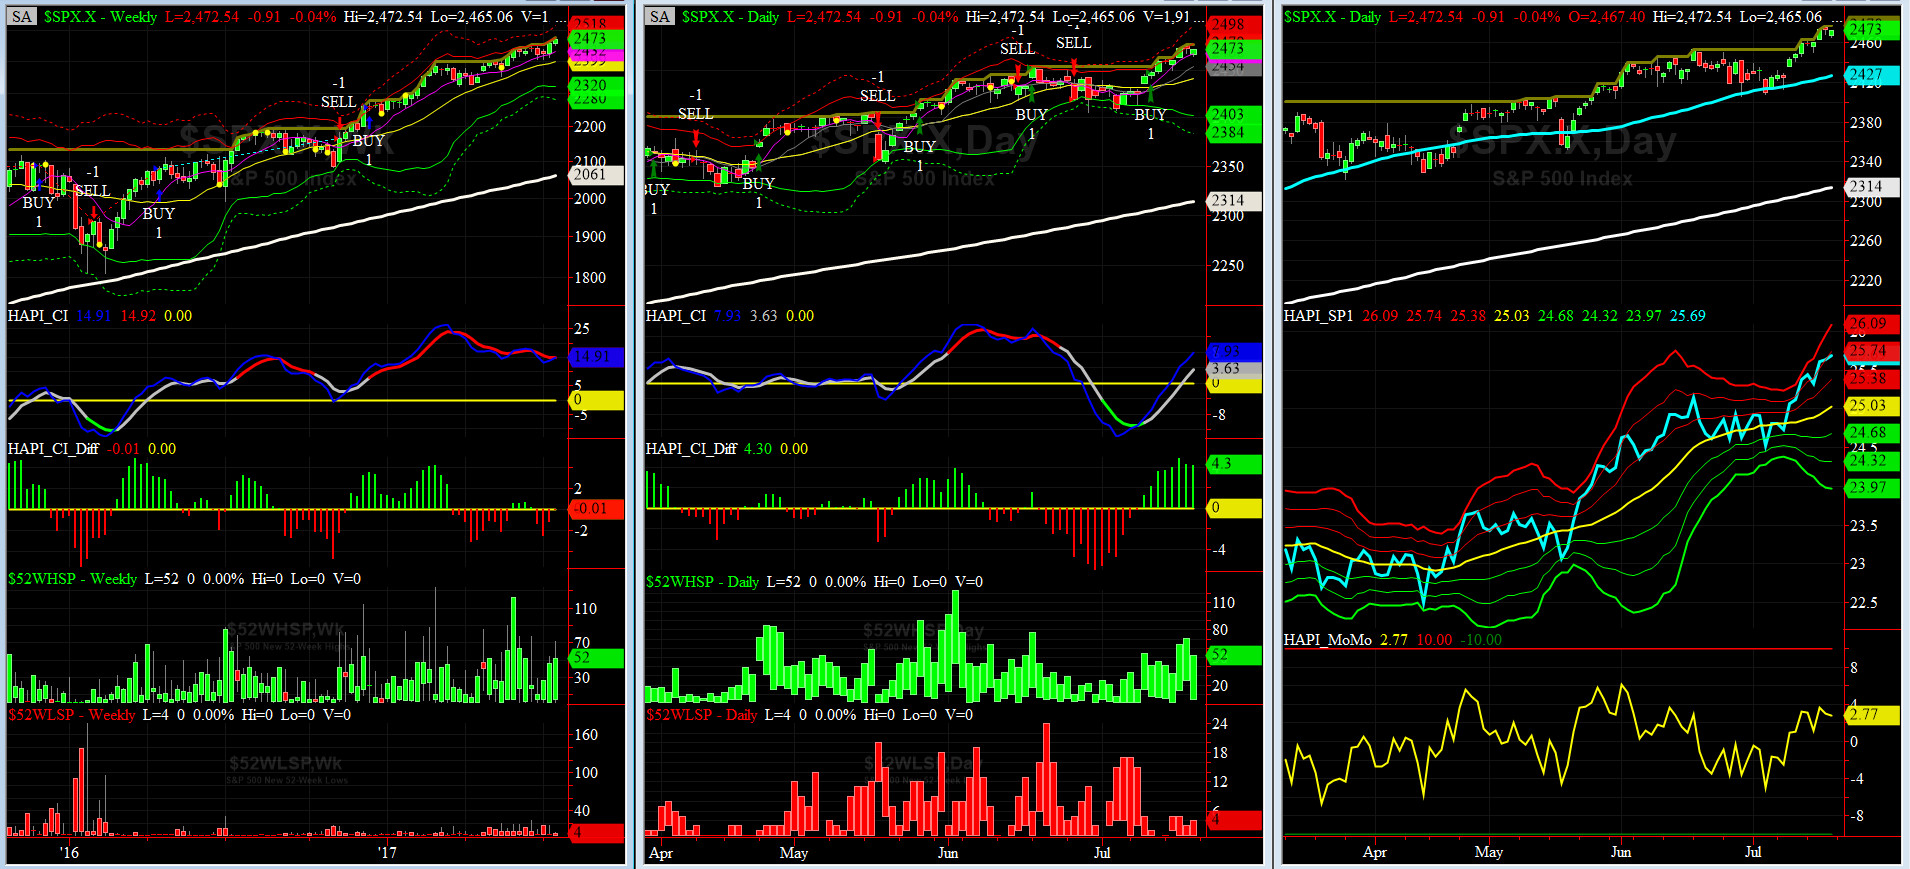
HA_SP1_Momo Chart
WEEKLY Timing Model = on a BUY Signal since Friday 12/16/16 CLOSE at 2258
DAILY Timing Model = on a BUY Signal since Thursday 7/13/17 CLOSE at 2448
Max SPX 52wk-highs reading last week = 71 (over 120-140, the local maxima is in)
Max SPX 52wk-Lows reading last week = 5 (over 40-60, the local minima is in)
HA_SP1 closed at just about its +2 sigma channels
HA_Momo = +2.8 (reversals most likely occur above +10 or below -10)
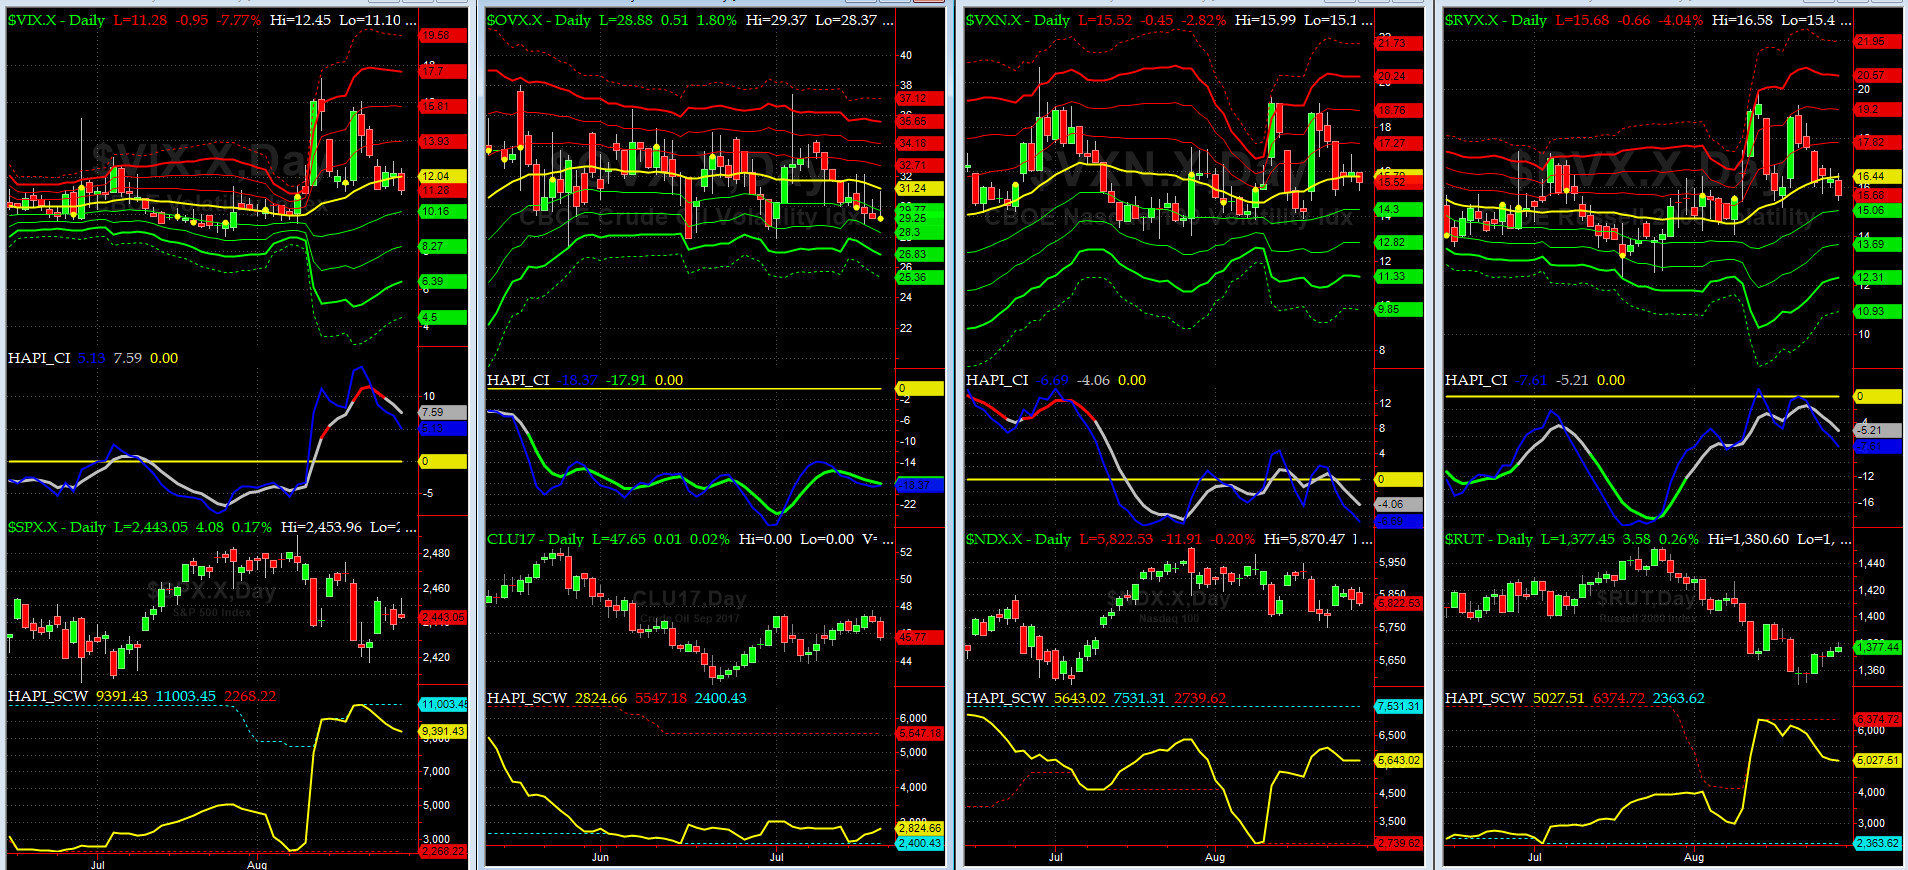
Vol of the Vols Chart
VIX currently stands at 9.36, or just at its -2 sigma (remember it's the VIX volatility pattern ( its sigma channels) that matters, and not the level of VIX itself ( this is per Dr. Robert Whaley, a great mentor and inventor of original VIX, now called VXO ). VIX usually peaks around a test of its +4 sigma).
Bye Bye Vols? not so fast sailors -- we still think we are on a path to a blow off event.

5-day TRIN & TRINQ Charts
NYSE 5-day TRIN is on NEUTRAL while NASDAQ 5-day TRIN still flirting with a SELL Signal.
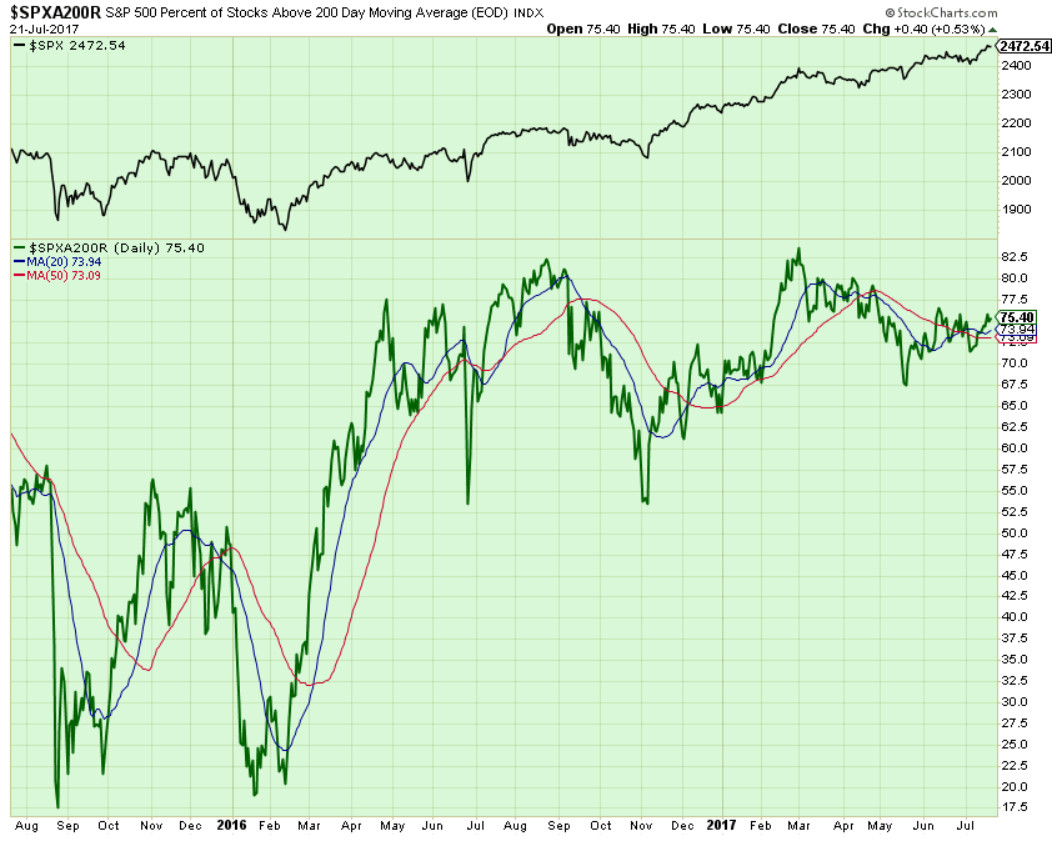
Components of SPX above their respective 200day MA Chart
This scoring indicator close at 75.4%. If you look carefully, you will note that its two MAs are rotating up very gradually. We think we are in the path to test 77-78% before next market hiccup.
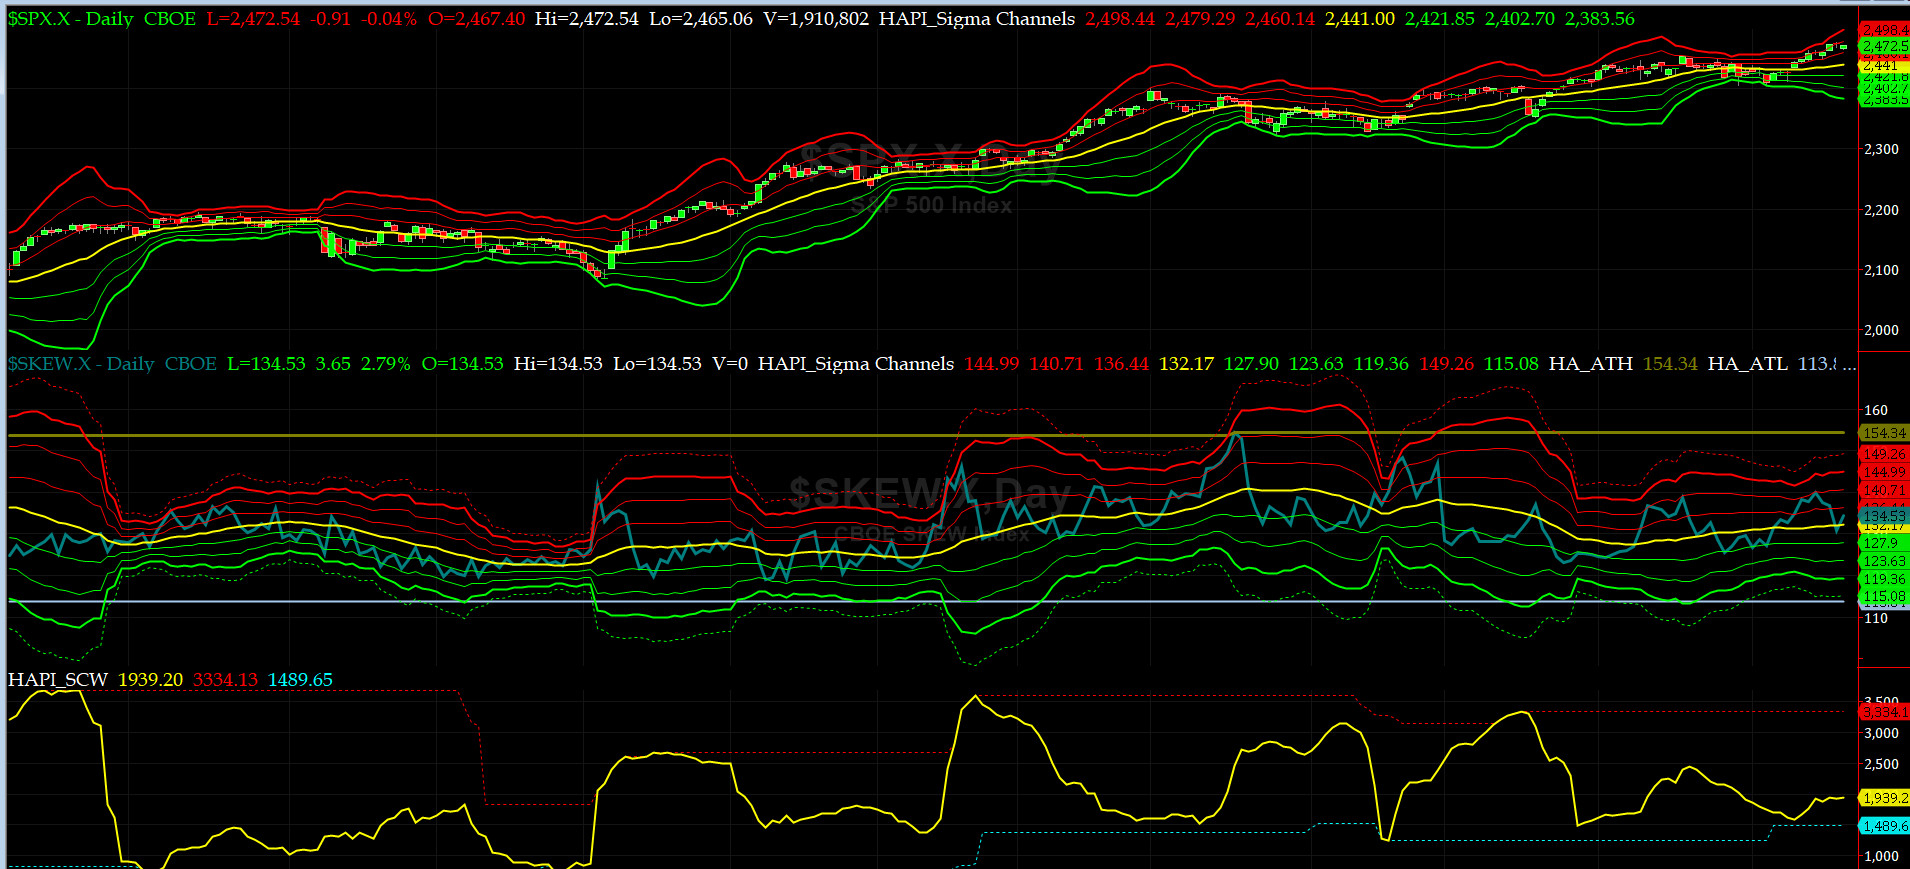
SPX SKEW (Tail Risk) Chart
Last week SPX SKEW (Tail Risk) came down this past week, and tested its zero sigma before closing at 135.6 (normal = 120-125, range 100-150).
Is all quiet on the Eastern & Mid-Western Fronts? Of course NOT. But no one can locate the Fat Lady signer either. Could be playing golf with Don Grumpino and the "Italian Kid" in Nu Joizi.
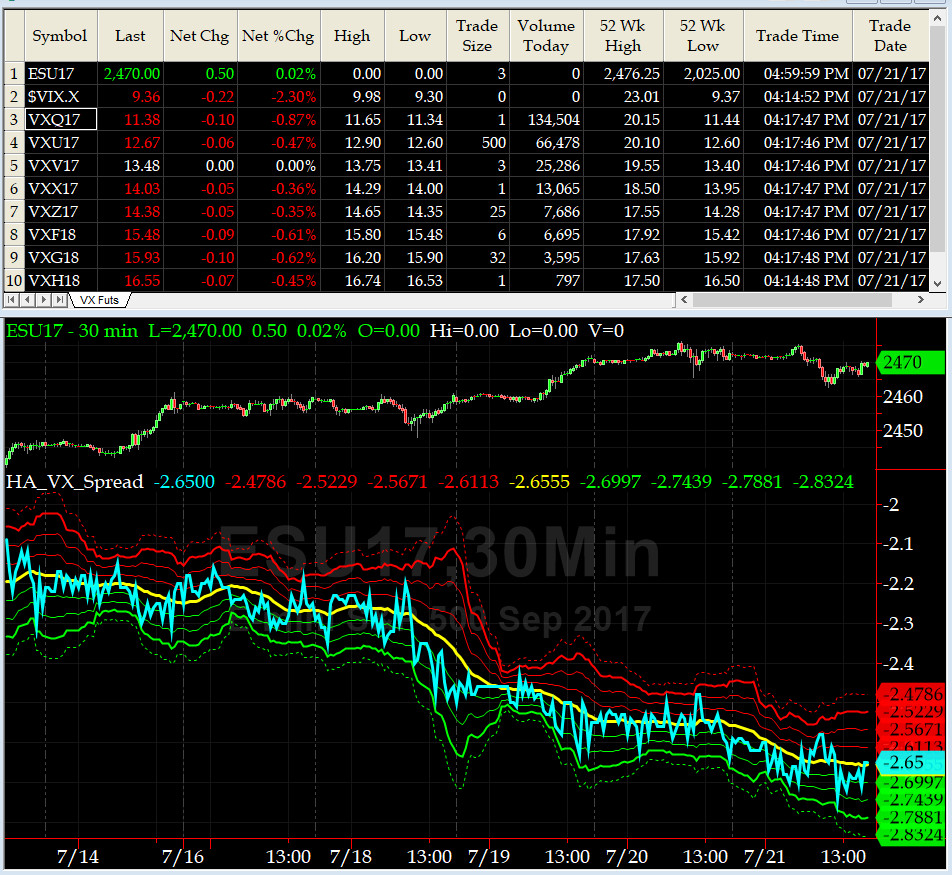
3-month VIX Futures Spread(VX) Chart
This indicator slowly receded at futures rallied to contract all time highs this past week. Now watching for -3 or lower.
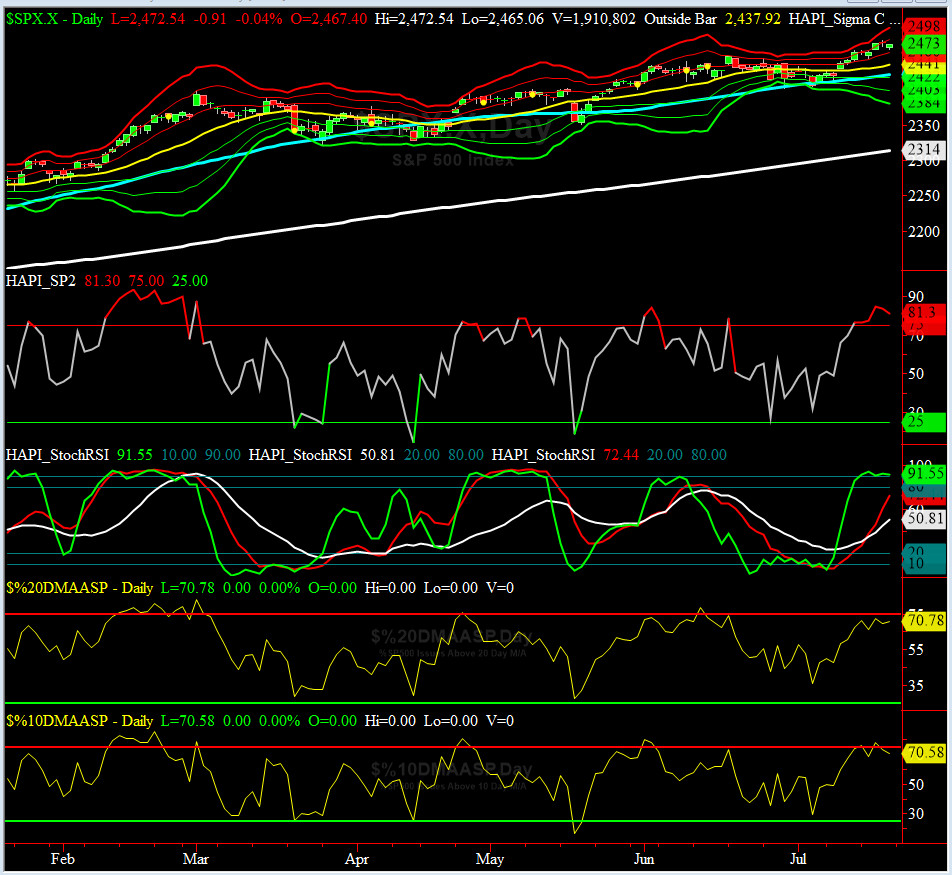
HA_SP2 Chart
HA_SP2 = 81 (Buy signal <= 25, Sell Signal >= 75)
Our fav prop indicator had another great week till Wednesday when it closed 10 points above its overbought line in the sand. We went flat SPX that day with Timer Digest. We shall continue to watch this amazing indicator for further clues.
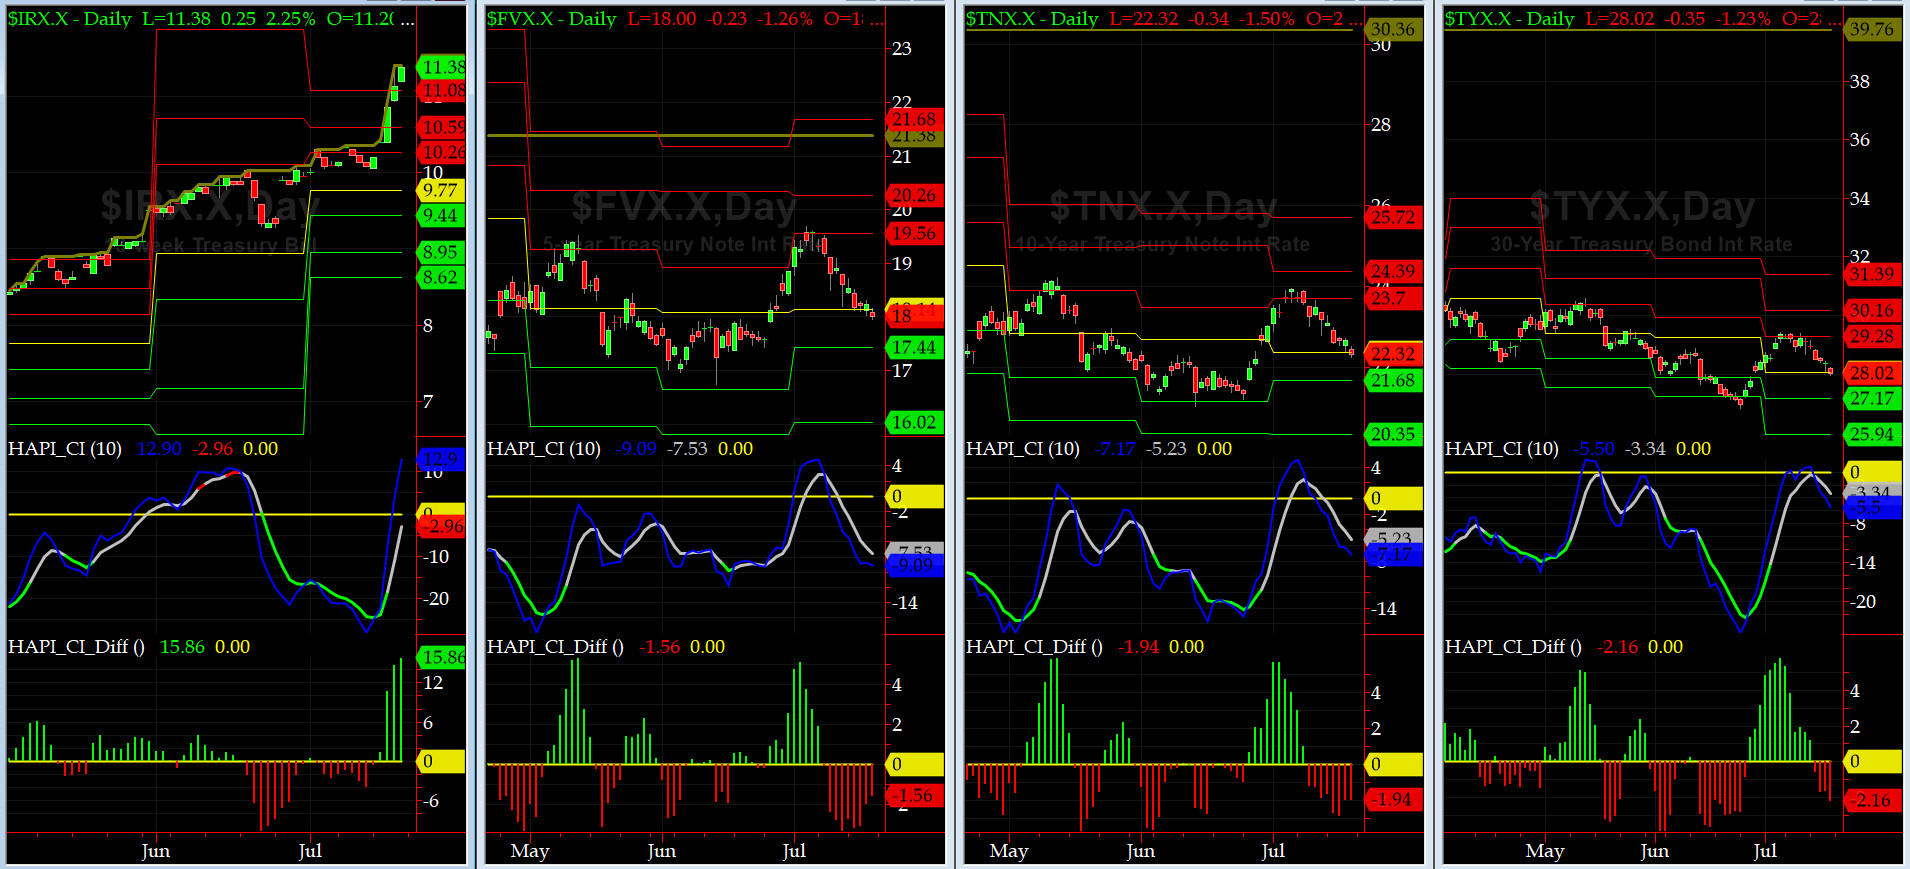
US Treasury T-Notes & T-Bonds Yields Chart
The Treasury Market eased off in the mid to the long end of the Yield Curve while the front end ratcheted up ahead of FOMC Meeting (no presser) Tuesday & Wednesday of this week, thus rendering the Yield Curve uber flat for now.
Fari Hamzei
|


 Proactive Market Timing