|
Sunday, July 30, 2017, 2355ET
Market Timing Charts, Analysis & Commentary for Issue #203
Timer Charts of S&P-500 Cash Index (SPX) + NASDAQ-100 Cash Index (NDX)
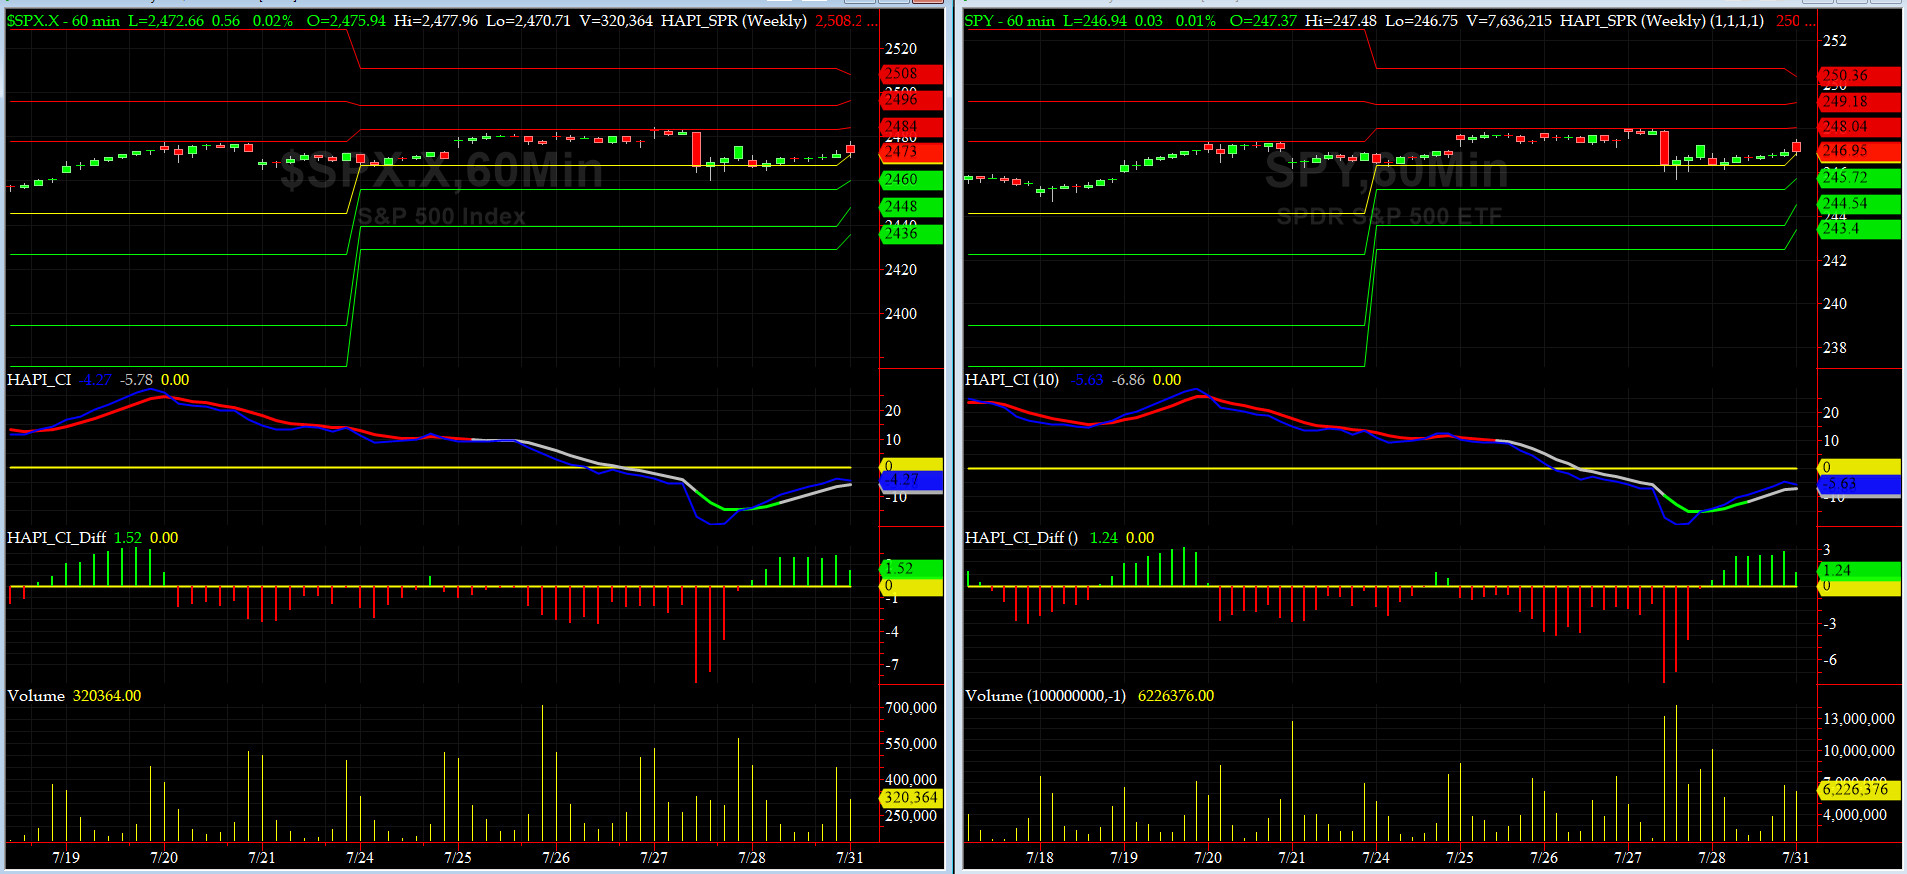
Most recent S&P-500 Cash Index (SPX): 2472.10 down -0.44 (down 0%) for the week ending Friday, July 28, 2017, which closed just below its +1 sigma.
SPX ALL TIME INTRADAY HIGH = 2484.04 (reached on Thursday, July 27, 2017)
SPX ALL TIME CLOSING HIGH = 2477.83 (reached on Tuesday, July 25, 2017)
Current DAILY +2 Sigma SPX = 2496 with WEEKLY +2 Sigma = 2488
Current DAILY 0 Sigma (20 day MA) SPX = 2452 with WEEKLY 0 Sigma = 2404
Current DAILY -2 Sigma SPX = 2408 with WEEKLY -2 Sigma = 2320
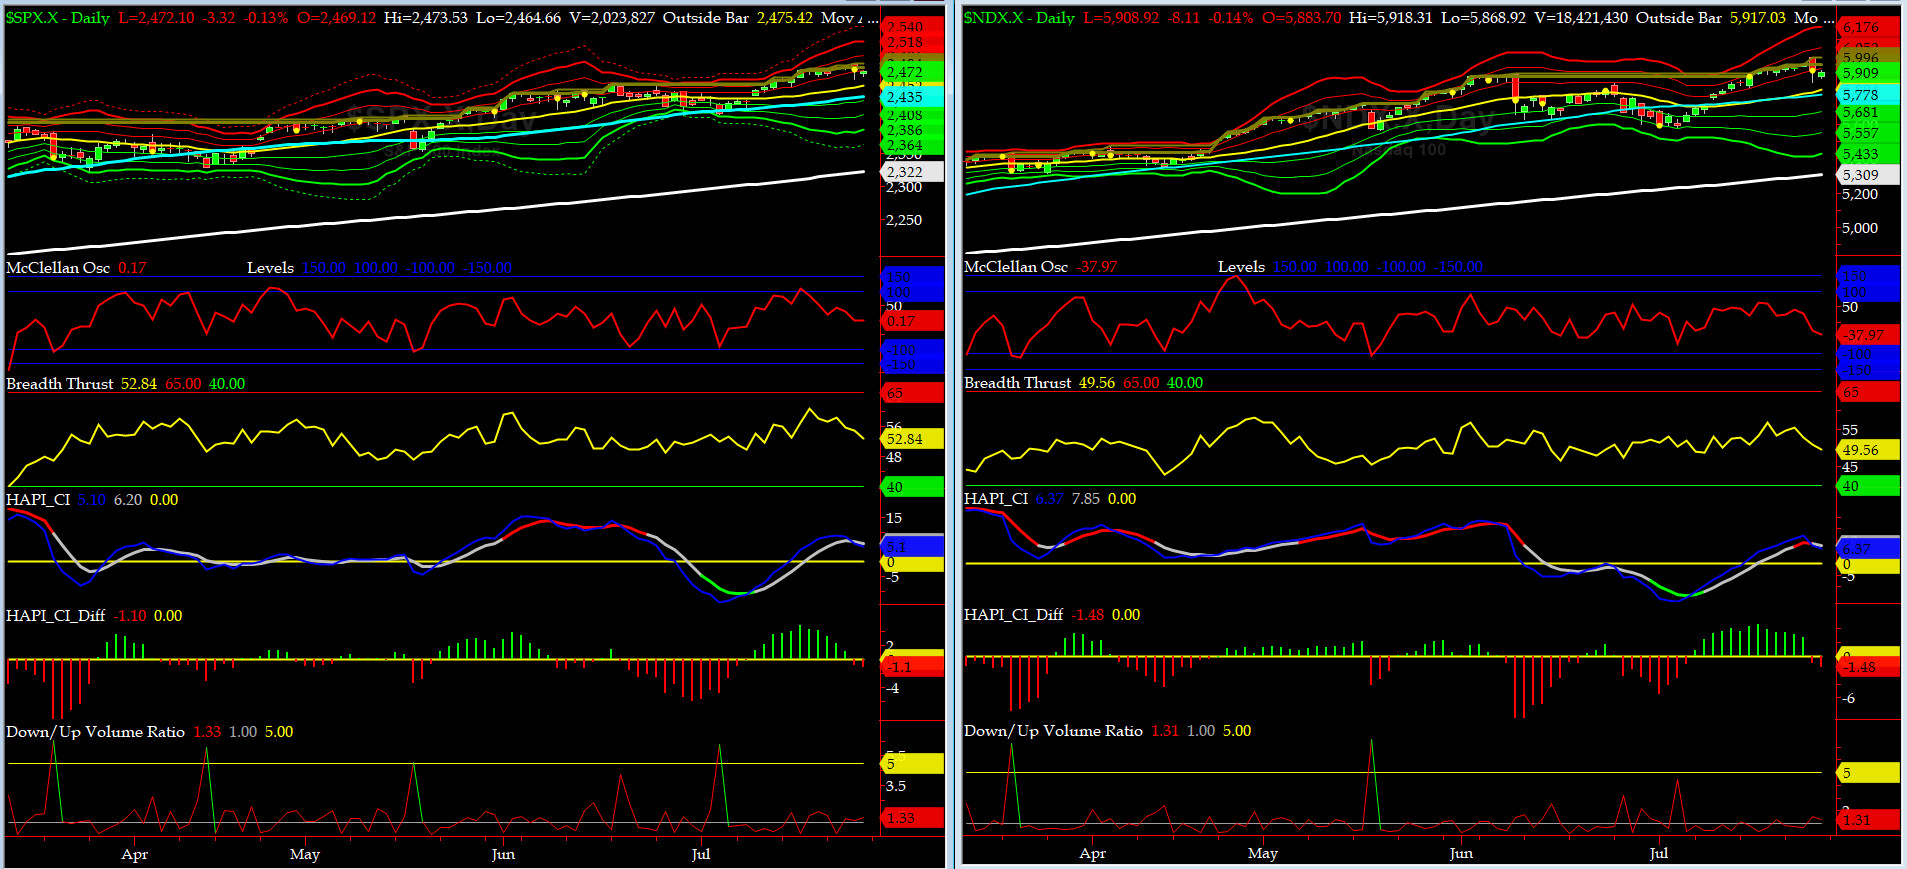
NYSE McClellan Oscillator = 0 (-150 is start of the O/S area; around -275 to -300 area or lower, we go into the �launch-pad� mode, over +150, we are in O/B area)
NYSE Breadth Thrust = 52.8(40 is considered as oversold and 65 as overbought)
We had another eventful week with a non-event outcome for SPX.
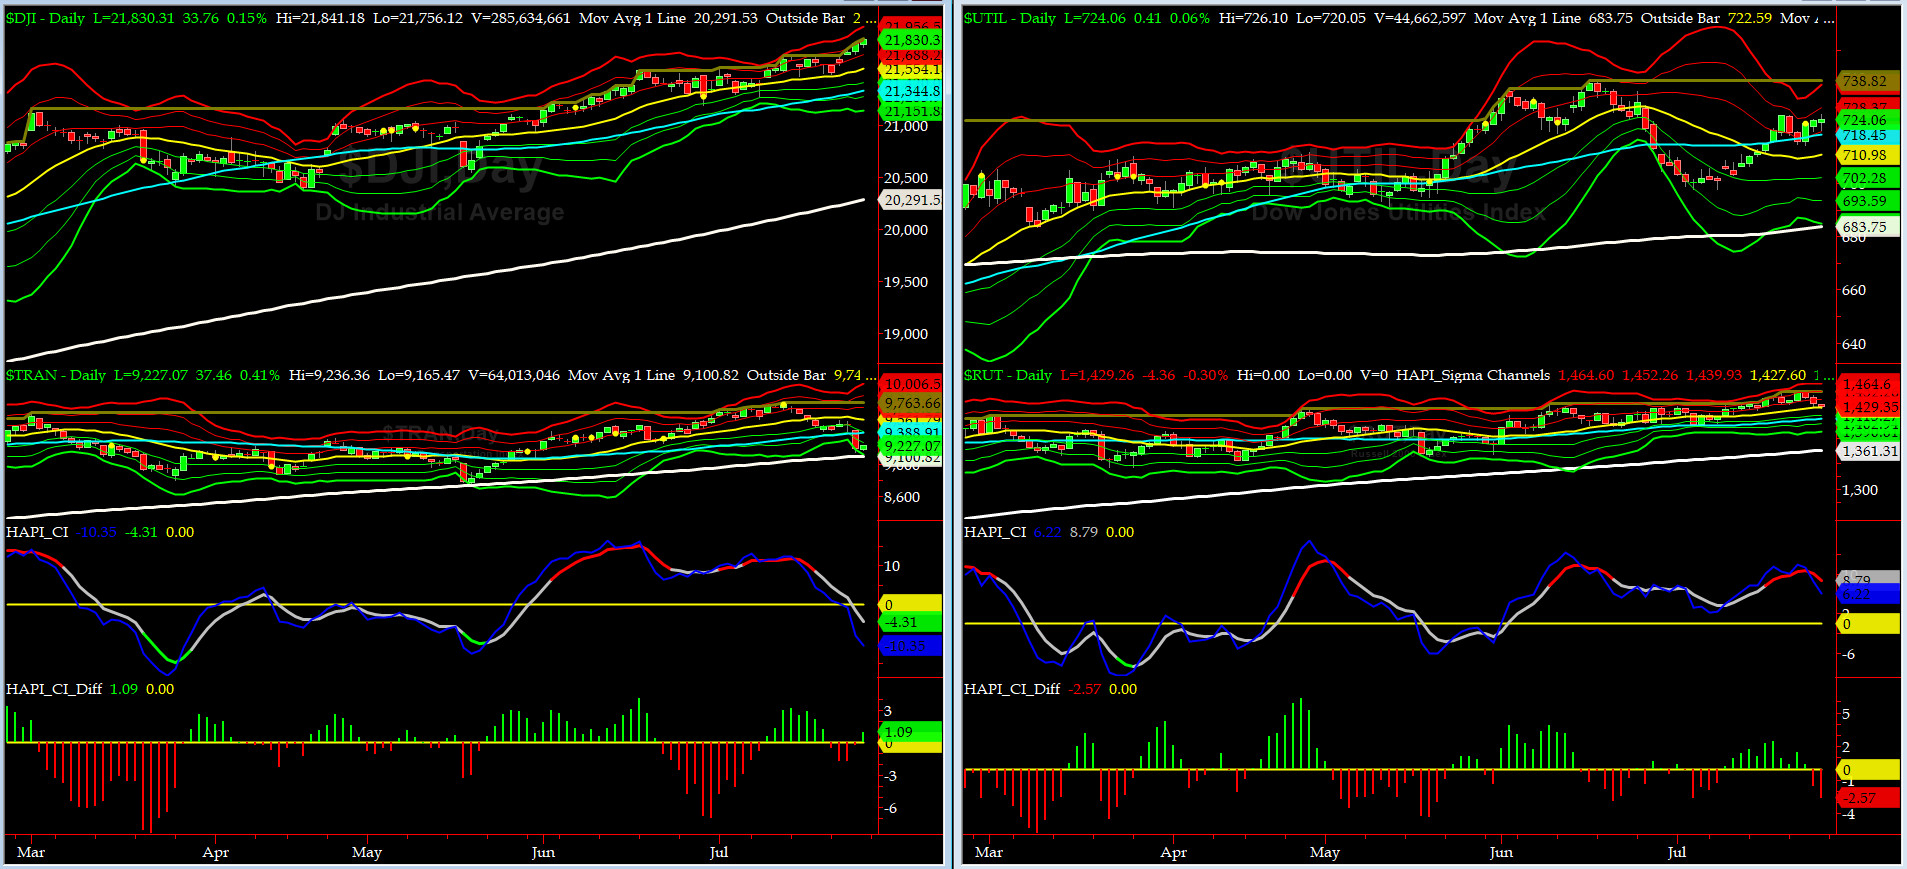
Canaries [in the Coal Mine] Chart for DJ TRAN & RUT Indices
200-Day MA DJ TRAN = 9100 or 1.4% below DJ TRAN (max observed in last 7 yrs = 20.2%, min = -20.3%)
200-Day MA RUT = 1360 or 5.4% below RUT (max observed in last 7 yrs = 21.3%, min = -22.6%)
DJ Transportation Index (proxy for economic conditions 6 to 9 months hence) had another bad week and most of it just in Thursday.
Russell 2000 Small Caps Index (proxy for Risk ON/OFF) on Tuesday rallied up hard but could only beat the most recent ATH by only 4 cents, and, then starting Wednesday, sold every single day.... RISK is still ON .
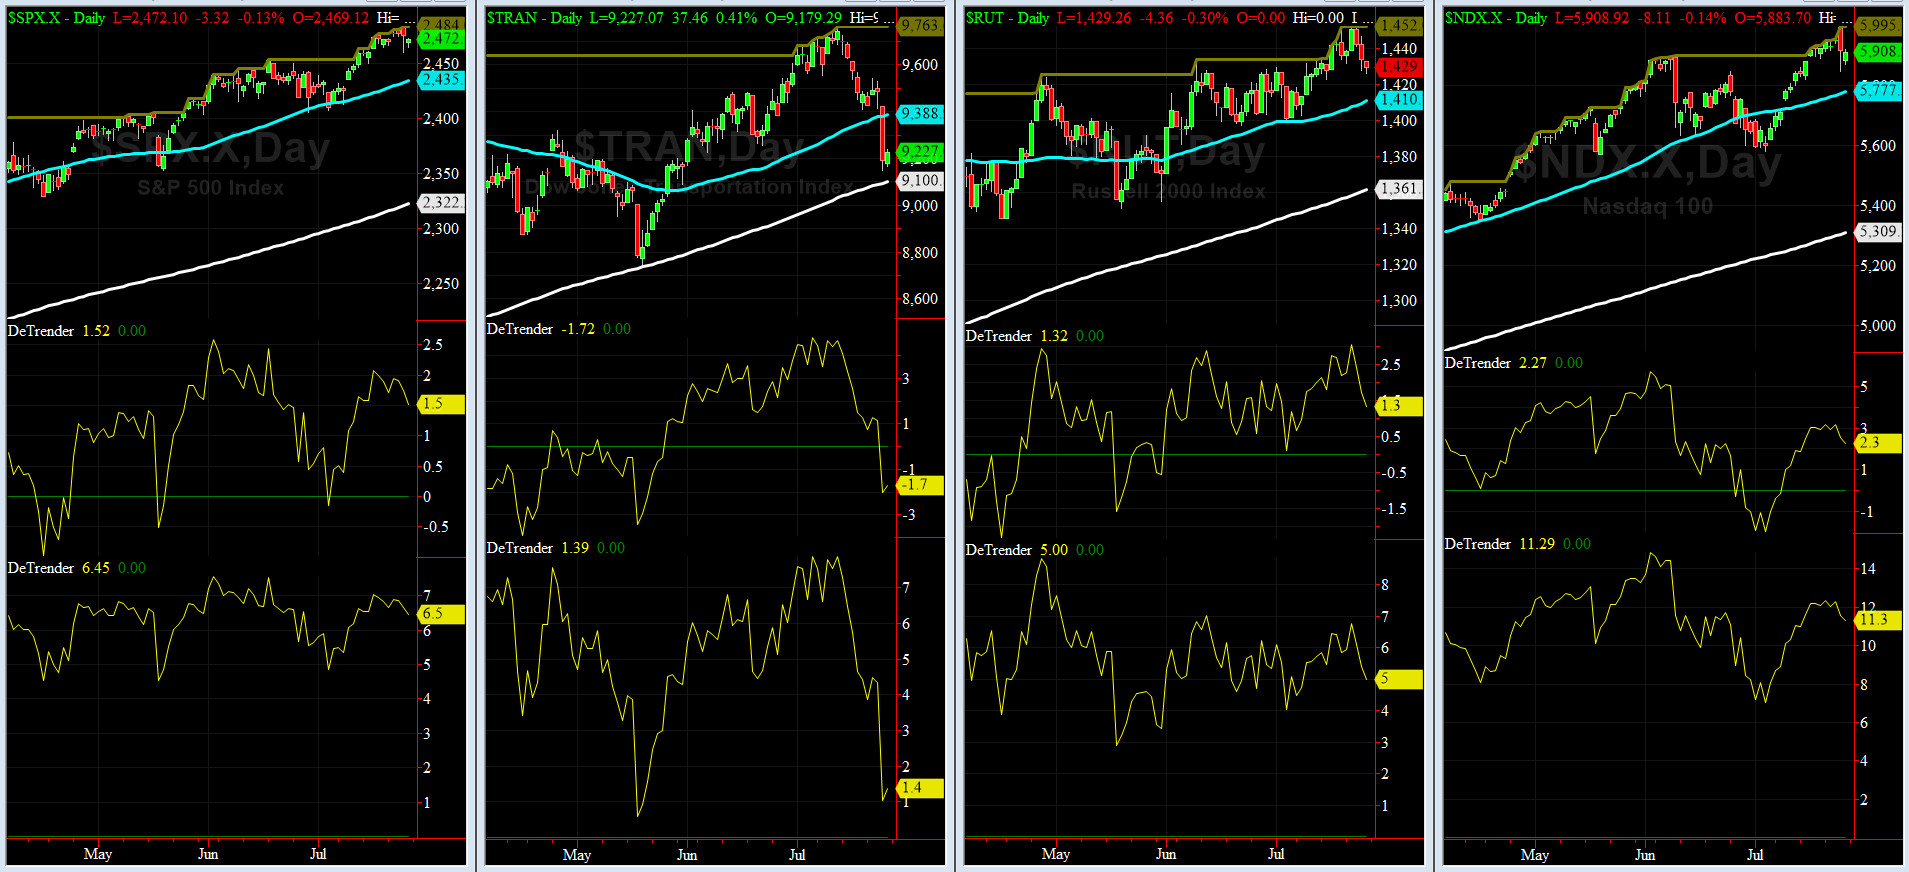
DeTrenders Charts for SPX, NDX, TRAN & RUT Indices
50-Day MA SPX = 2435 or 1.5% below SPX close of Friday (max observed in last 7 yrs = +8.6%, min = -9.3%)
200-Day MA SPX = 2322 or 6.5% below SPX (max observed in last 7 yrs = 15.2%, min = -14%)
Again this week, all of our EIGHT DeTrenders are POSITIVE while the DeTrenders for DJ Tran & RUT will continue to be harbingers of future price behavior in broad indices.
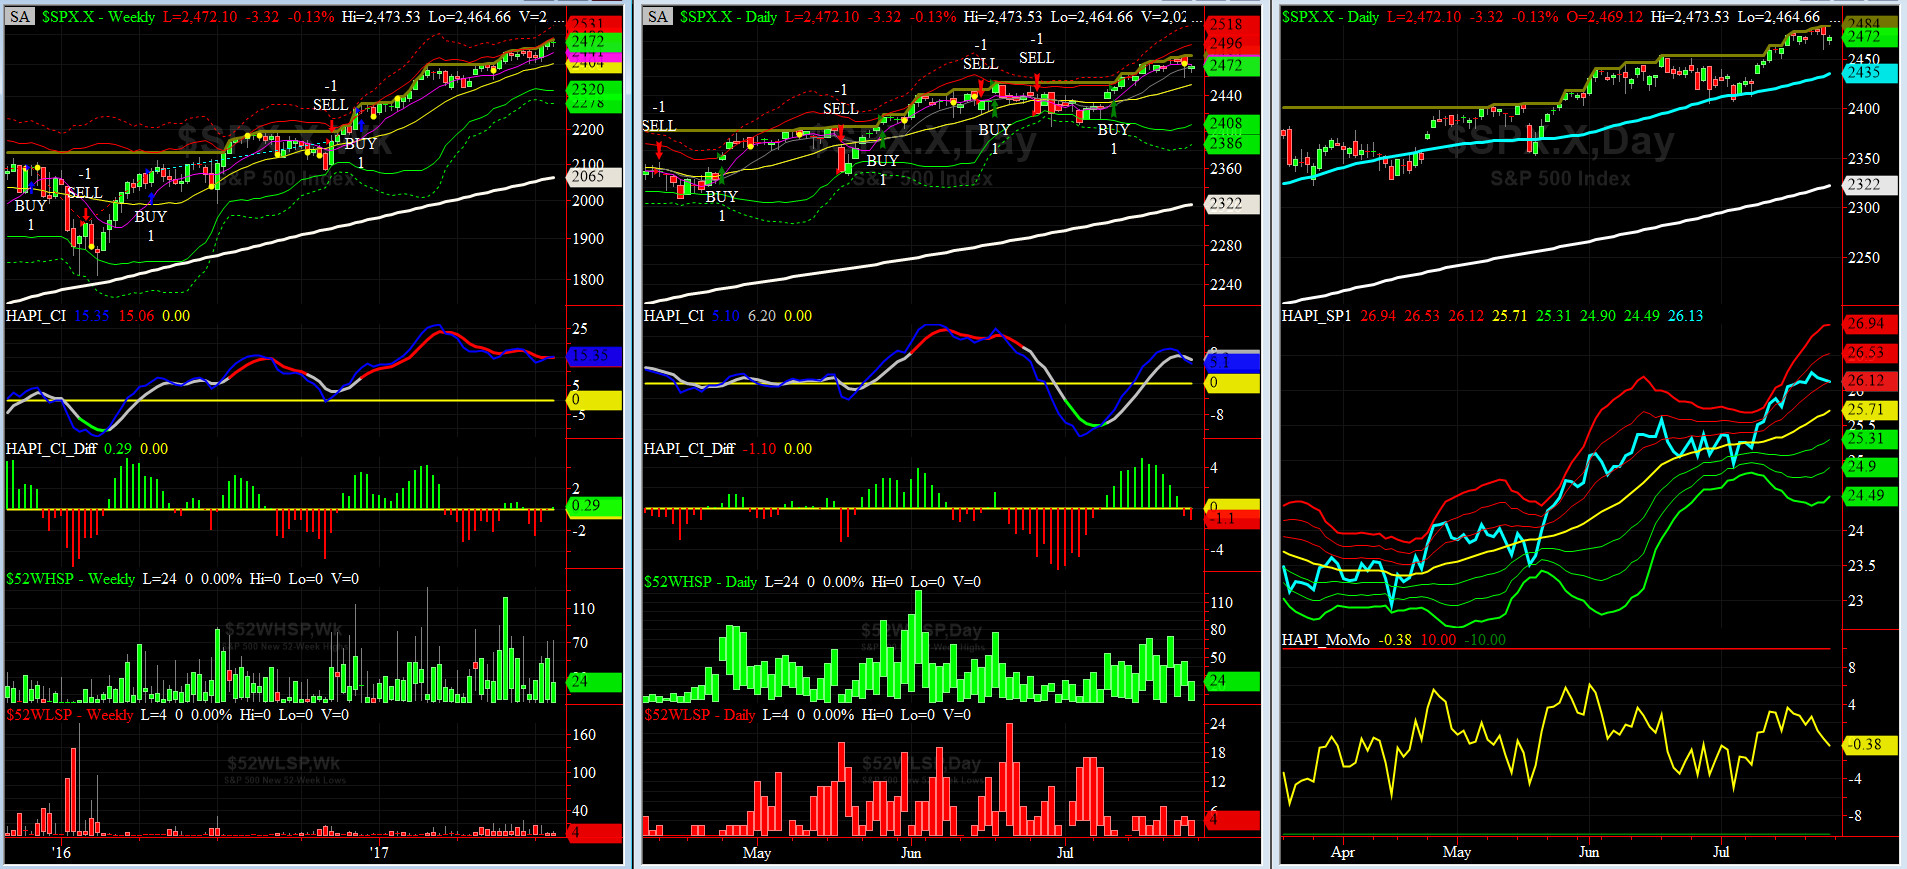
HA_SP1_Momo Chart
WEEKLY Timing Model = on a BUY Signal since Friday 12/16/16 CLOSE at 2258
DAILY Timing Model = on a BUY Signal since Thursday 7/13/17 CLOSE at 2448
Max SPX 52wk-highs reading last week = 73 (over 120-140, the local maxima is in)
Max SPX 52wk-Lows reading last week = 7 (over 40-60, the local minima is in)
HA_SP1 closed at just about its +2 sigma channels
HA_Momo = -4 (reversals most likely occur above +10 or below -10)
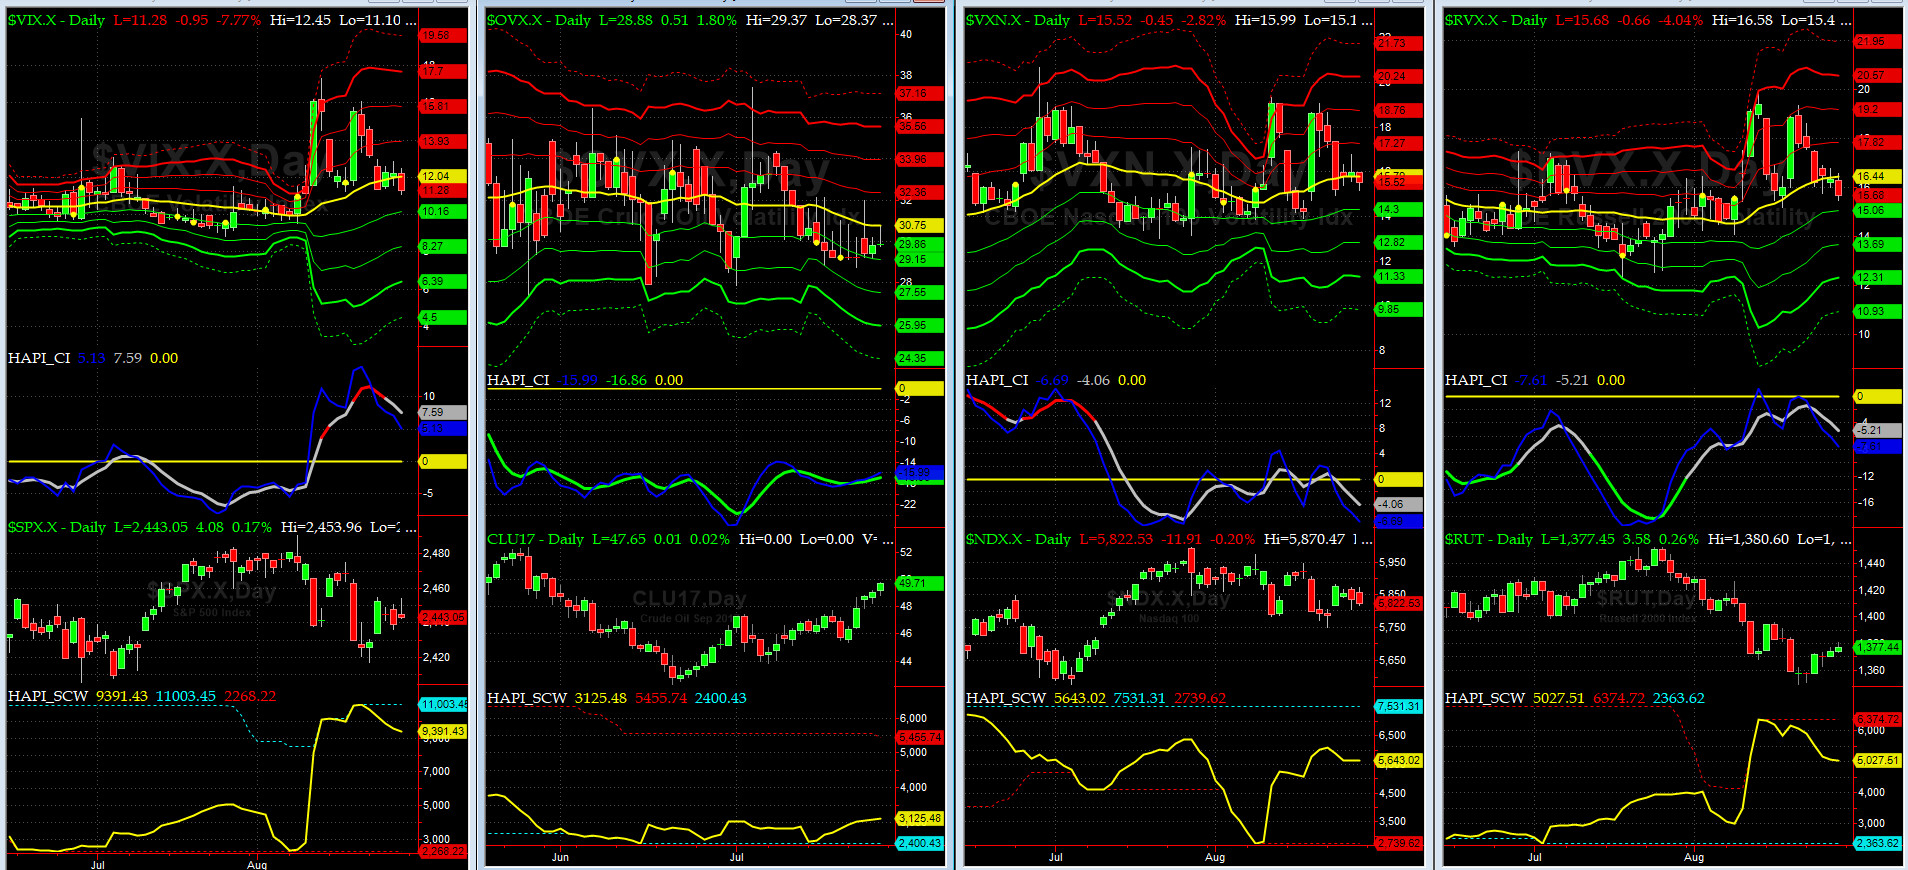
Vol of the Vols Chart
VIX currently stands at 10.3, or just at its zero sigma (remember it's the VIX volatility pattern ( its sigma channels) that matters, and not the level of VIX itself ( this is per Dr. Robert Whaley, a great mentor and inventor of original VIX, now called VXO ). VIX usually peaks around a test of its +4 sigma).
On Thursday, we saw spot VIX jump by 20% or 2 sigma levels intraday. VXN jumped also 2 sigma levels for 23% (after AMZN liquidation ahead of its EPS began). Would someone please go after the leaker otherwise we have to ask The Mooch to help us out. LOL.

5-day TRIN & TRINQ Charts
Last week's 5-day TRINQ SELL Signal for NASDAQ was spot on. But now, both NYSE & NASDAQ 5-day TRINs are NEUTRAL again.

Components of SPX above their respective 200day MA Chart
As mentioned here before, this scoring indicator tested 77% mid-week but closed a tad lower on Friday. No signal here.
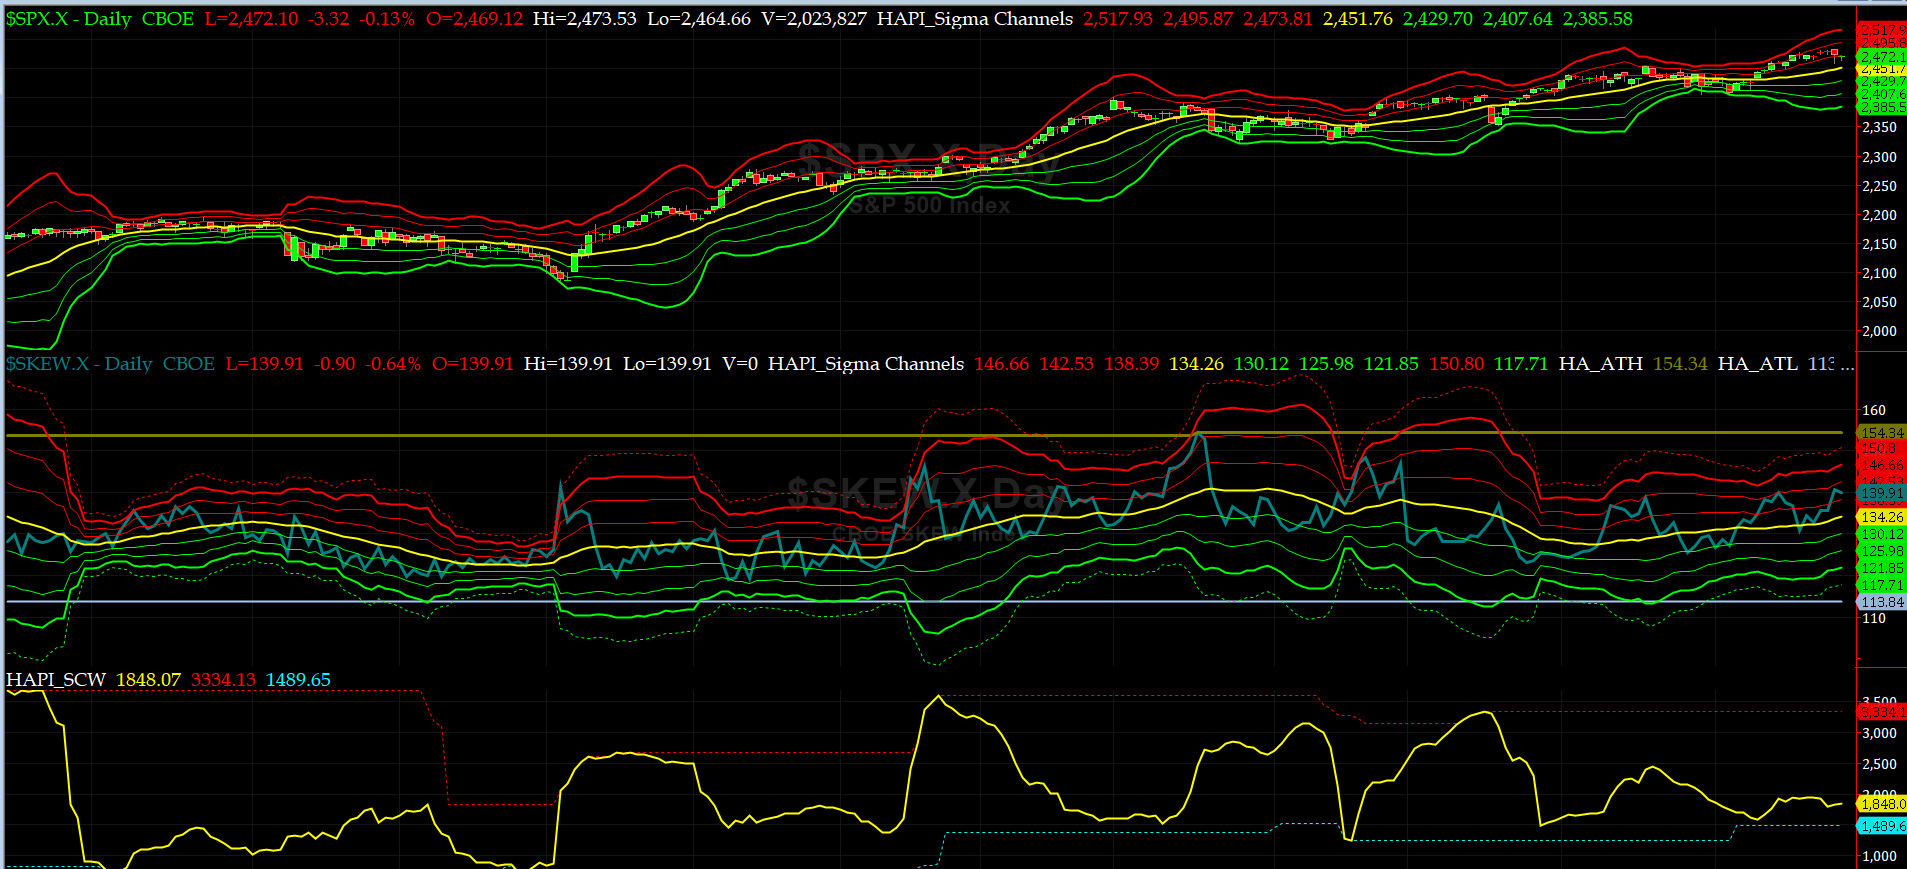
SPX SKEW (Tail Risk) Chart
Last week SPX SKEW (Tail Risk) rose up to about its +2 sigma & closed at 139.91 (normal = 120-125, range 100-150).
Is all quiet on the Eastern & Mid-Western Fronts? Of course NOT -- just look at this new soap opera called "Don Grumpino's White House." All we know, the second law of thermodynamics prevailed again ("the entropy of the system is ever-increasing"). As in the Navy, at this juncture, we advise that you fasten your harness, even though exact timing is never clear.
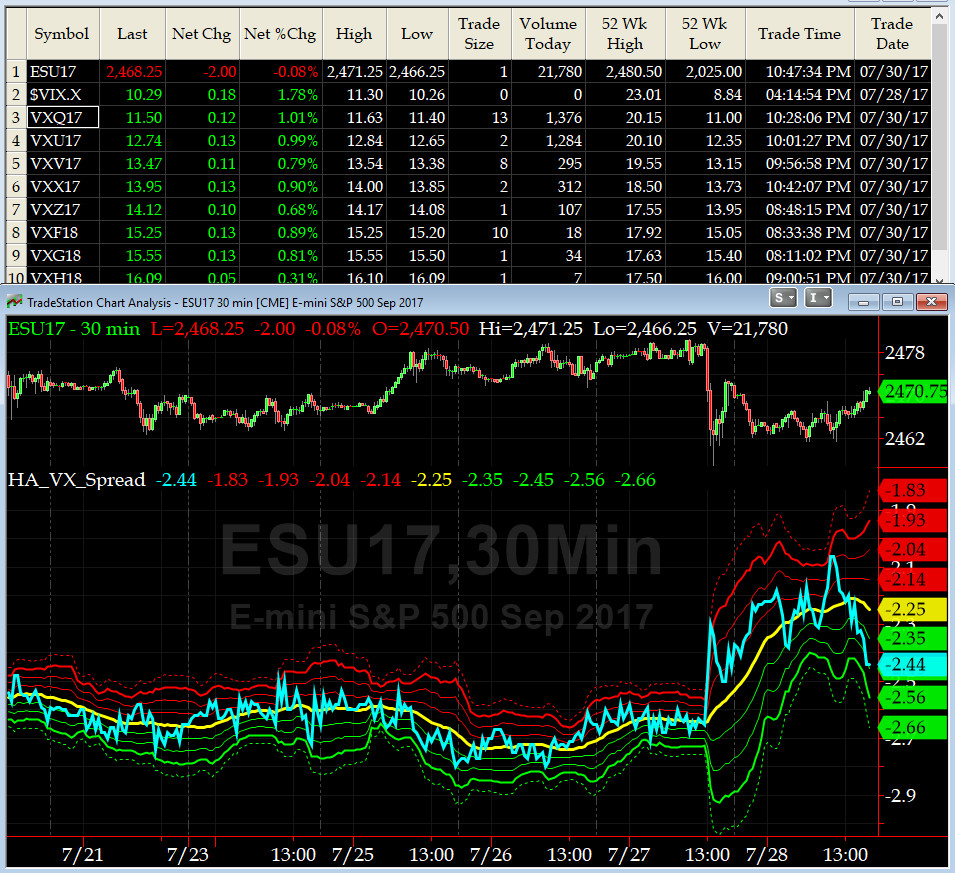
3-month VIX Futures Spread(VX) Chart
No signal here as we are in semi-neutral zone here.

HA_SP2 Chart
HA_SP2 = 58.4 (Buy signal <= 25, Sell Signal >= 75)
Our fav prop indicator is no longer in the overbought zone.

US Treasury T-Notes & T-Bonds Yields Chart
The Treasury Market was fairly quiet in the mid to the long end of the Yield Curve while the front end sank pretty hard, again rendering the Yield Curve uber flat for now.
Fari Hamzei
|


 Proactive Market Timing