|
Sunday, August 6, 2017, 2130ET
Market Timing Charts, Analysis & Commentary for Issue #204
Timer Charts of S&P-500 Cash Index (SPX) + NASDAQ-100 Cash Index (NDX)
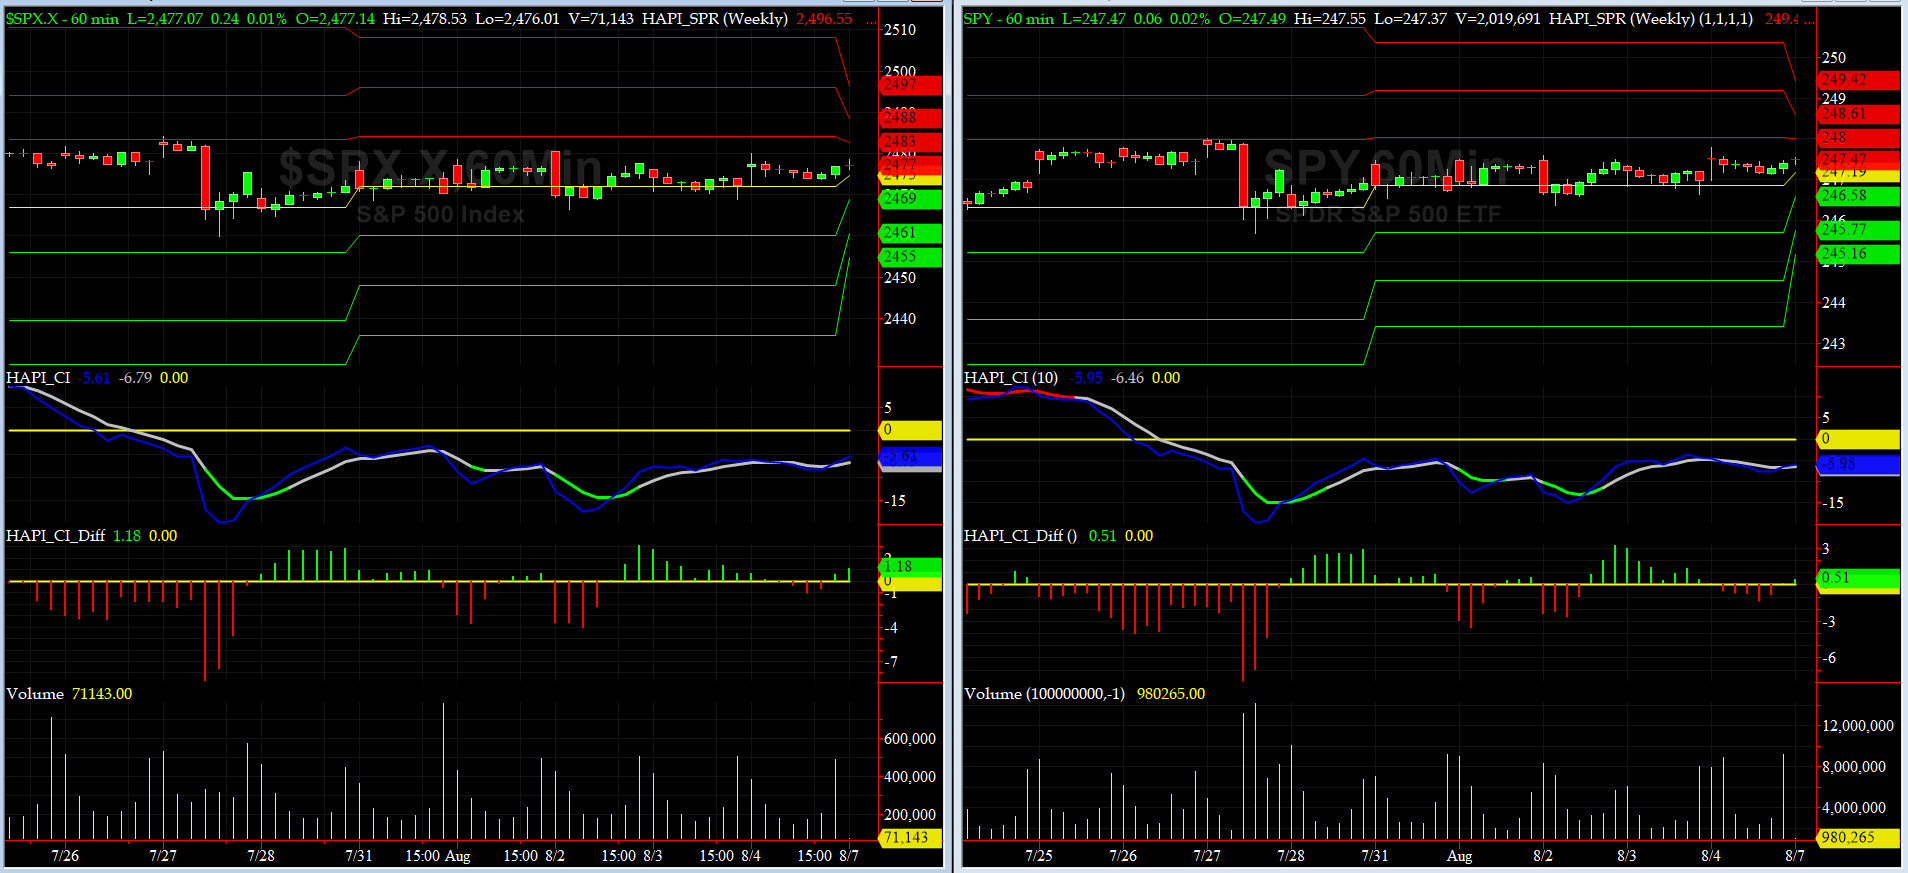
Most recent S&P-500 Cash Index (SPX): 2476.93 up +4.83 (up 0.2%) for the week ending Friday, August 4, 2017, which closed just below its +1 sigma.
SPX ALL TIME INTRADAY HIGH = 2484.04 (reached on Thursday, July 27, 2017)
SPX ALL TIME CLOSING HIGH = 2477.83 (reached on Tuesday, July 25, 2017)
Current DAILY +2 Sigma SPX = 2496 with WEEKLY +2 Sigma = 2498
Current DAILY 0 Sigma (20 day MA) SPX = 2464 with WEEKLY 0 Sigma = 2409
Current DAILY -2 Sigma SPX = 2433 with WEEKLY -2 Sigma = 2320
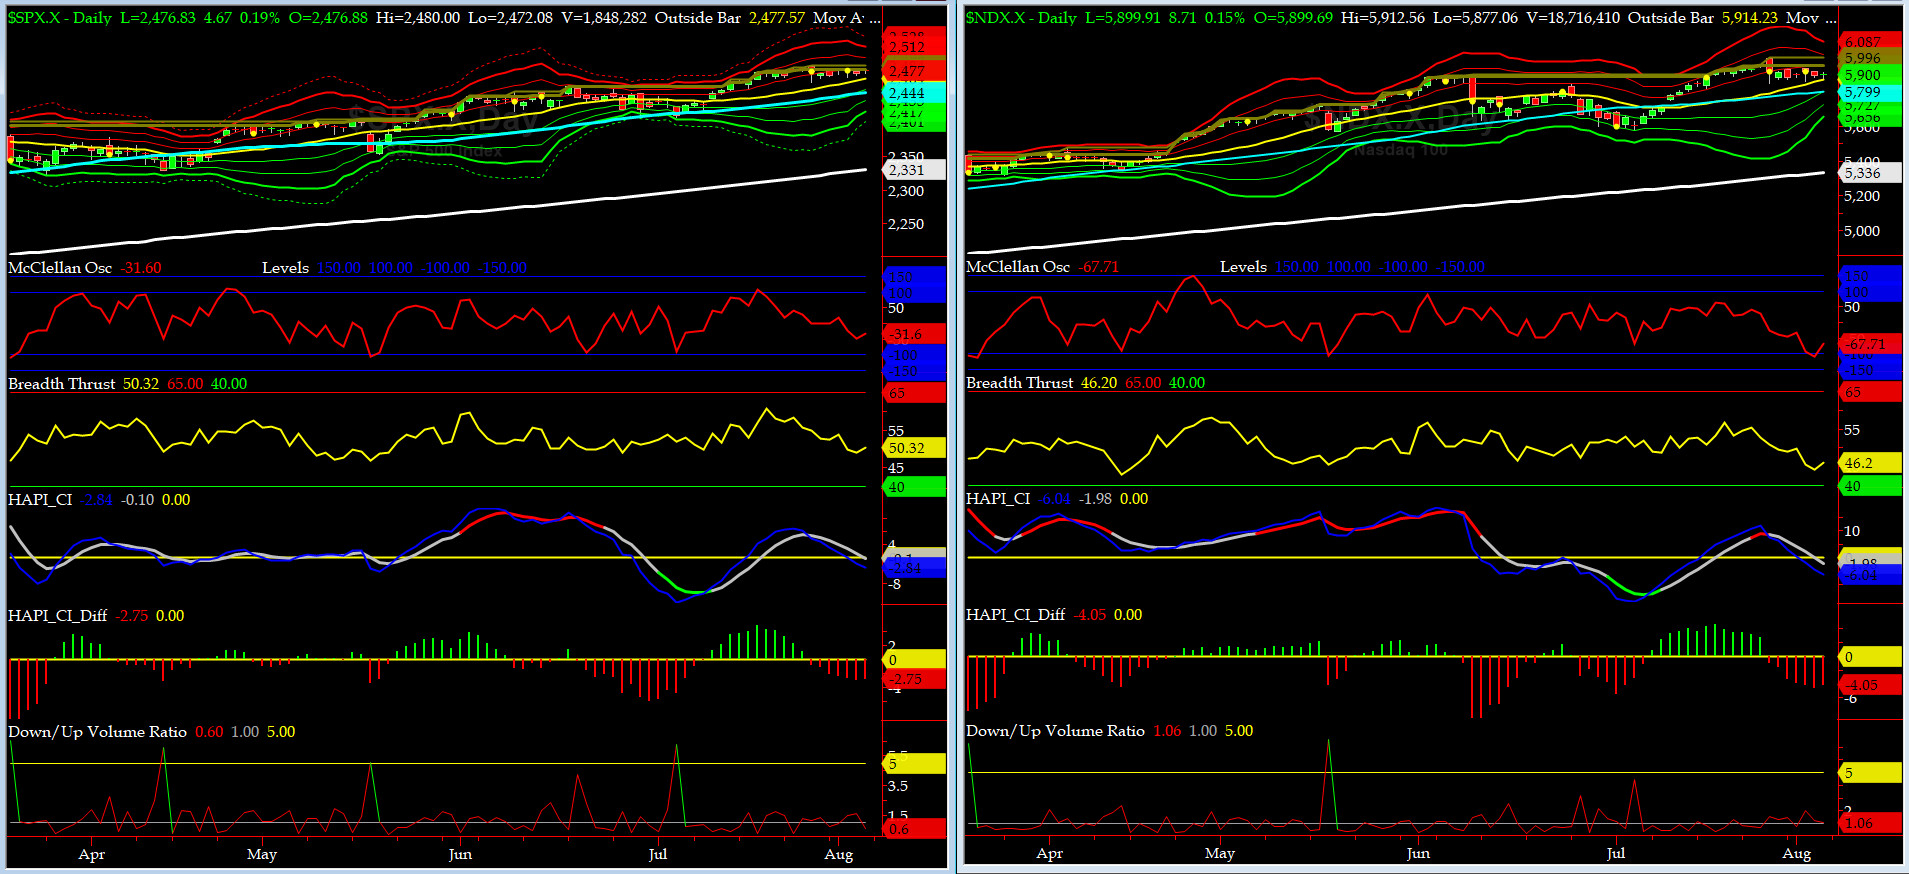
NYSE McClellan Oscillator = -31 (-150 is start of the O/S area; around -275 to -300 area or lower, we go into the �launch-pad� mode, over +150, we are in O/B area)
NYSE Breadth Thrust = 50.3 (40 is considered as oversold and 65 as overbought)
We saw a ton of intraday vol in NDX but SPX went nowhere fast. July NFP came in better than expected, accompanied with positive revisions for June NFP Report, notably in Manufacturing. If only Don Grumpino keeps his mouth shut and his fingers off of his twitter account......

Canaries [in the Coal Mine] Chart for DJ TRAN & RUT Indices
200-Day MA DJ TRAN = 9129 or 1.6% below DJ TRAN (max observed in last 7 yrs = 20.2%, min = -20.3%)
200-Day MA RUT = 1366 or 3.4% below RUT (max observed in last 7 yrs = 21.3%, min = -22.6%)
DJ Transportation Index (proxy for economic conditions 6 to 9 months hence) sold further till it hit 200 Day MA and then reversed up.
Russell 2000 Small Caps Index (proxy for Risk ON/OFF) sold off past its 50 Day MA but then on Friday after July NFP Report, reversed slightly back up. We still need to see a retest of its 50 Day MA otherwise, the next stop could be its 200 Day MA at 1366. So, for now, RISK is ON.
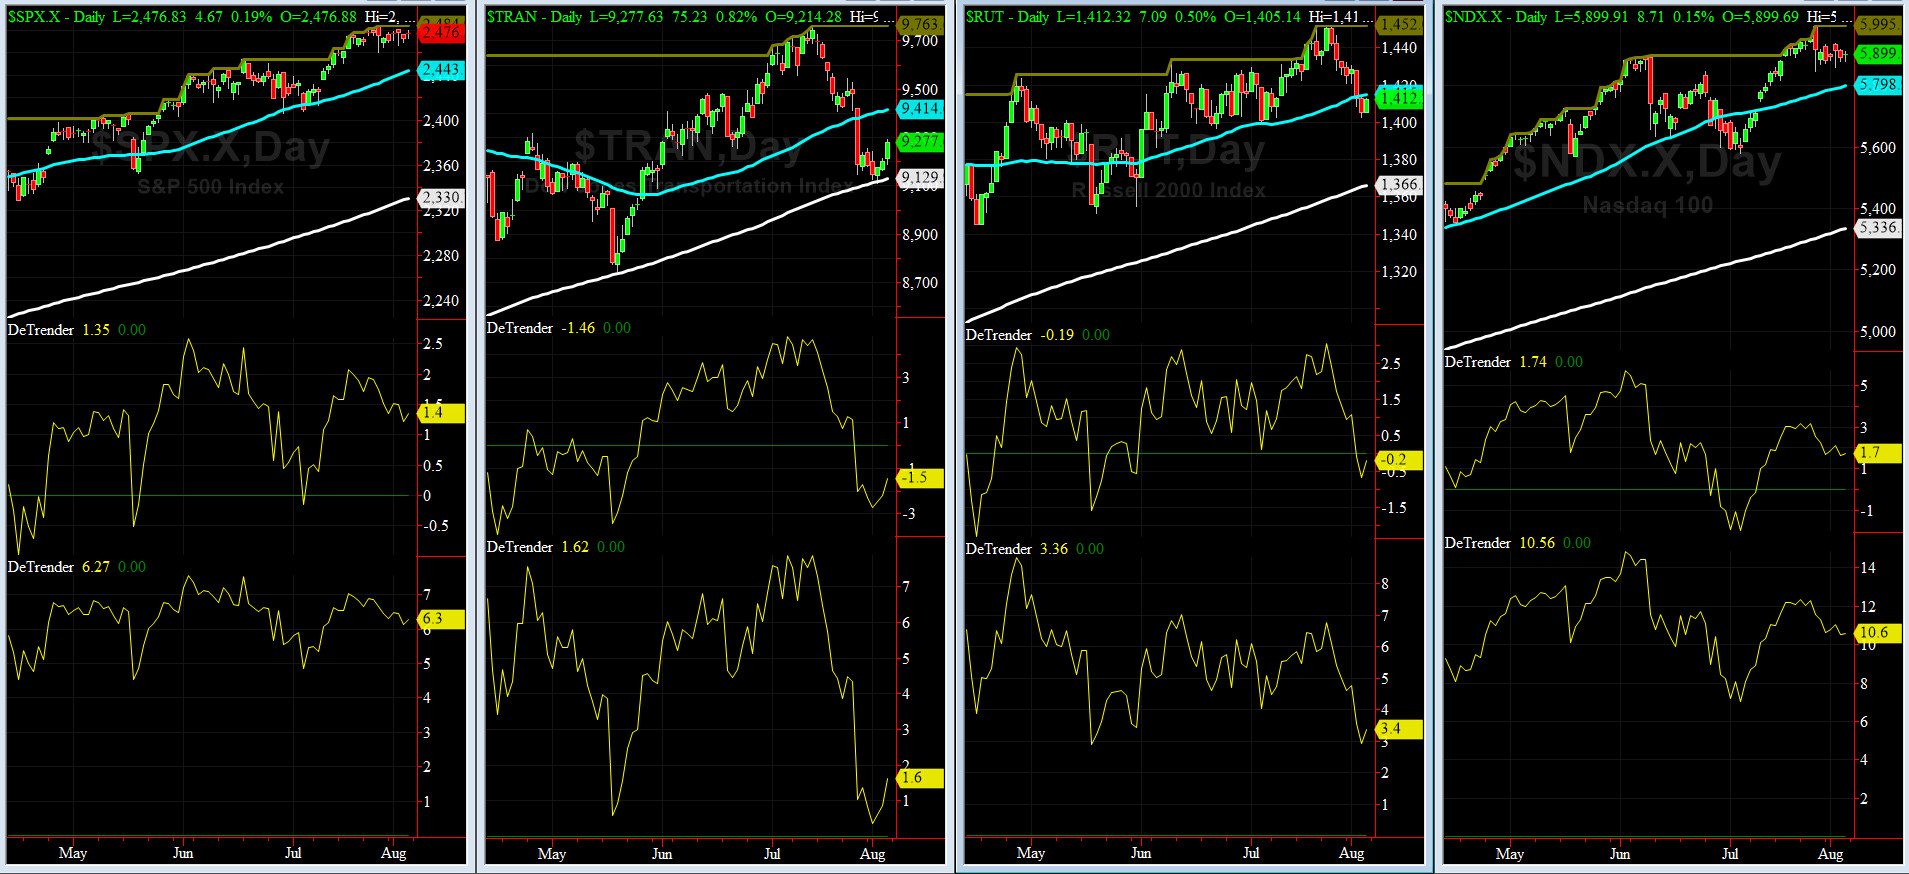
DeTrenders Charts for SPX, NDX, TRAN & RUT Indices
50-Day MA SPX = 2443 or 1.4% below SPX close of Friday (max observed in last 7 yrs = +8.6%, min = -9.3%)
200-Day MA SPX = 2330 or 6.3% below SPX (max observed in last 7 yrs = 15.2%, min = -14%)
Now, SIX of our EIGHT DeTrenders are POSITIVE while the DeTrenders for DJ Tran & RUT will continue to be harbingers of future price behavior in broad indices.
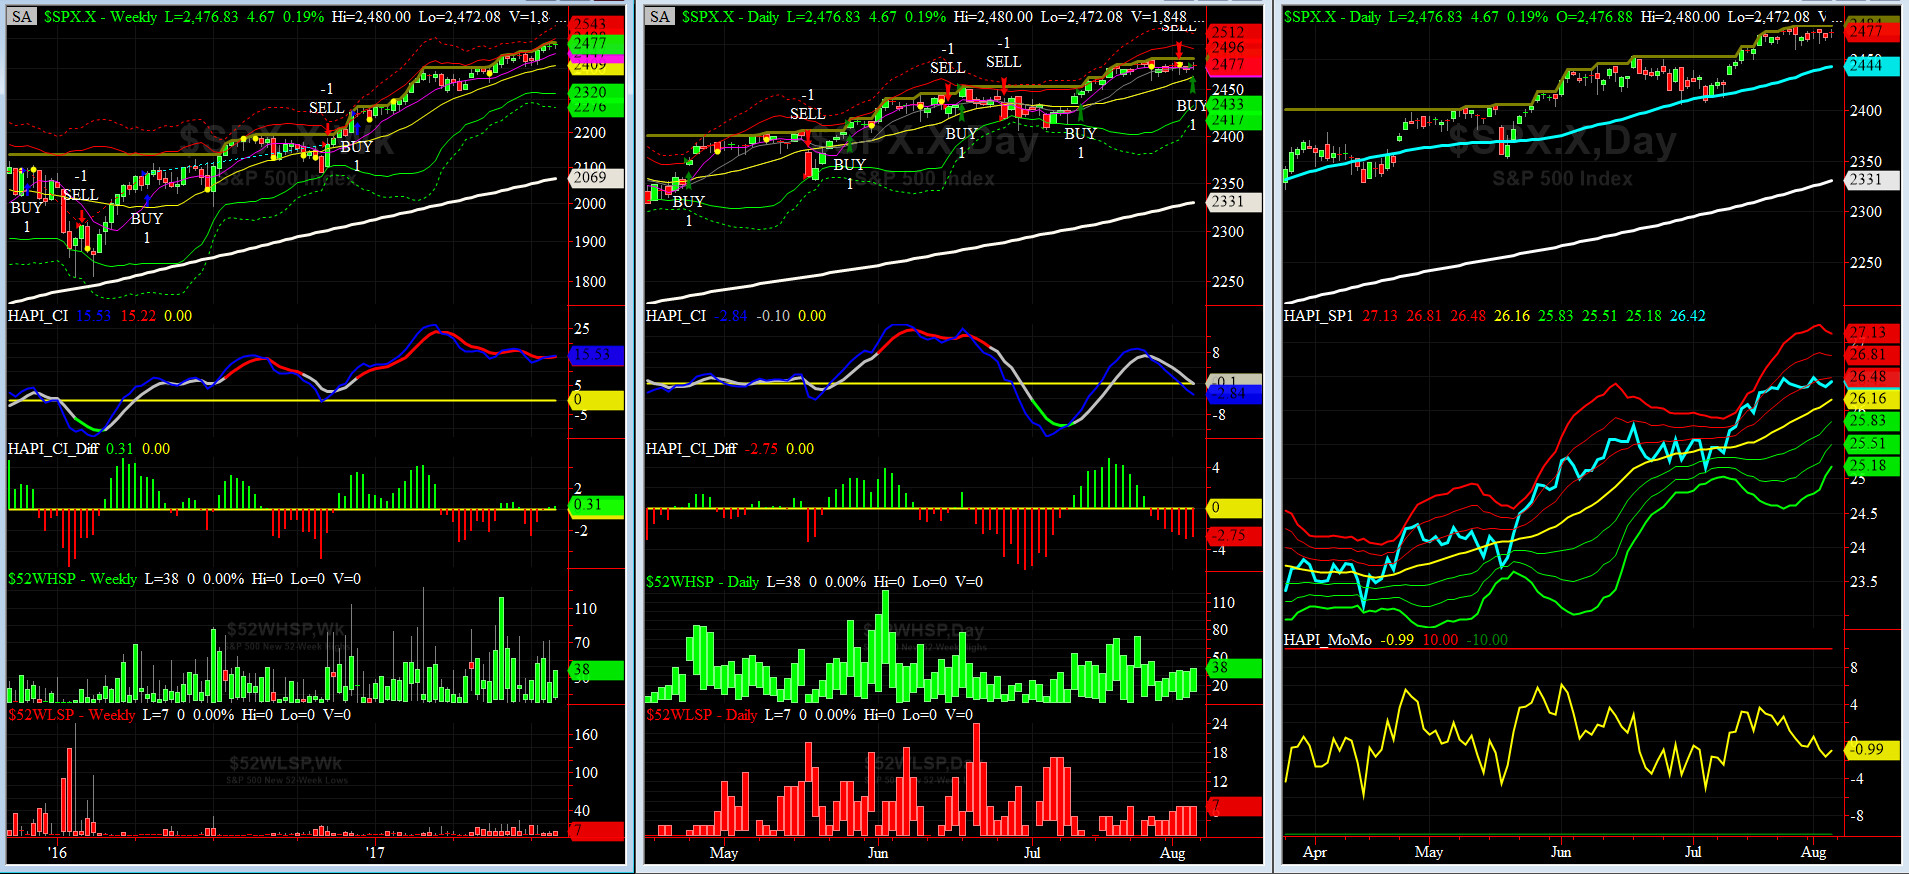
HA_SP1_Momo Chart
WEEKLY Timing Model = on a BUY Signal since Friday 12/16/16 CLOSE at 2258
DAILY Timing Model = on a BUY Signal since Friday 8/4/17 CLOSE at 2476
Max SPX 52wk-highs reading last week = 38 (over 120-140, the local maxima is in)
Max SPX 52wk-Lows reading last week = 7 (over 40-60, the local minima is in)
HA_SP1 closed at just about its +1 sigma channels
HA_Momo = -1 (reversals most likely occur above +10 or below -10)
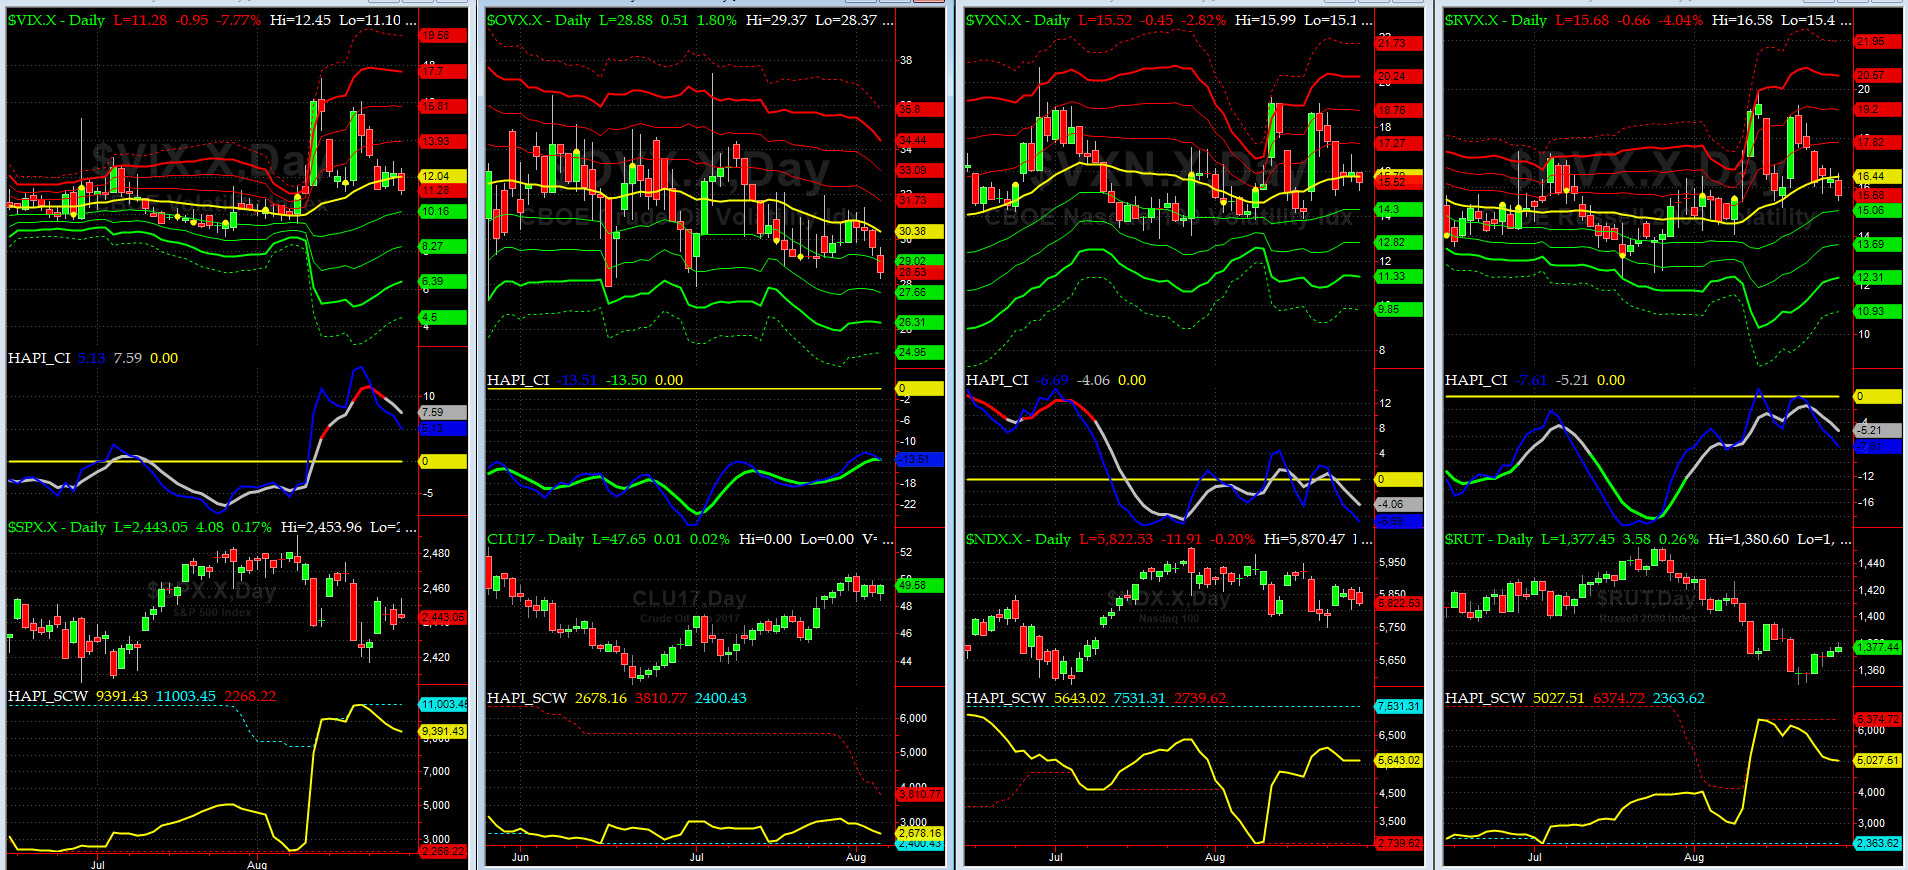
Vol of the Vols Chart
VIX currently stands at 10.03, or just at its zero sigma (remember it's the VIX volatility pattern ( its sigma channels) that matters, and not the level of VIX itself ( this is per Dr. Robert Whaley, a great mentor and inventor of original VIX, now called VXO ). VIX usually peaks around a test of its +4 sigma).
We witnessed yet another very quiet week in the Vol Complex.
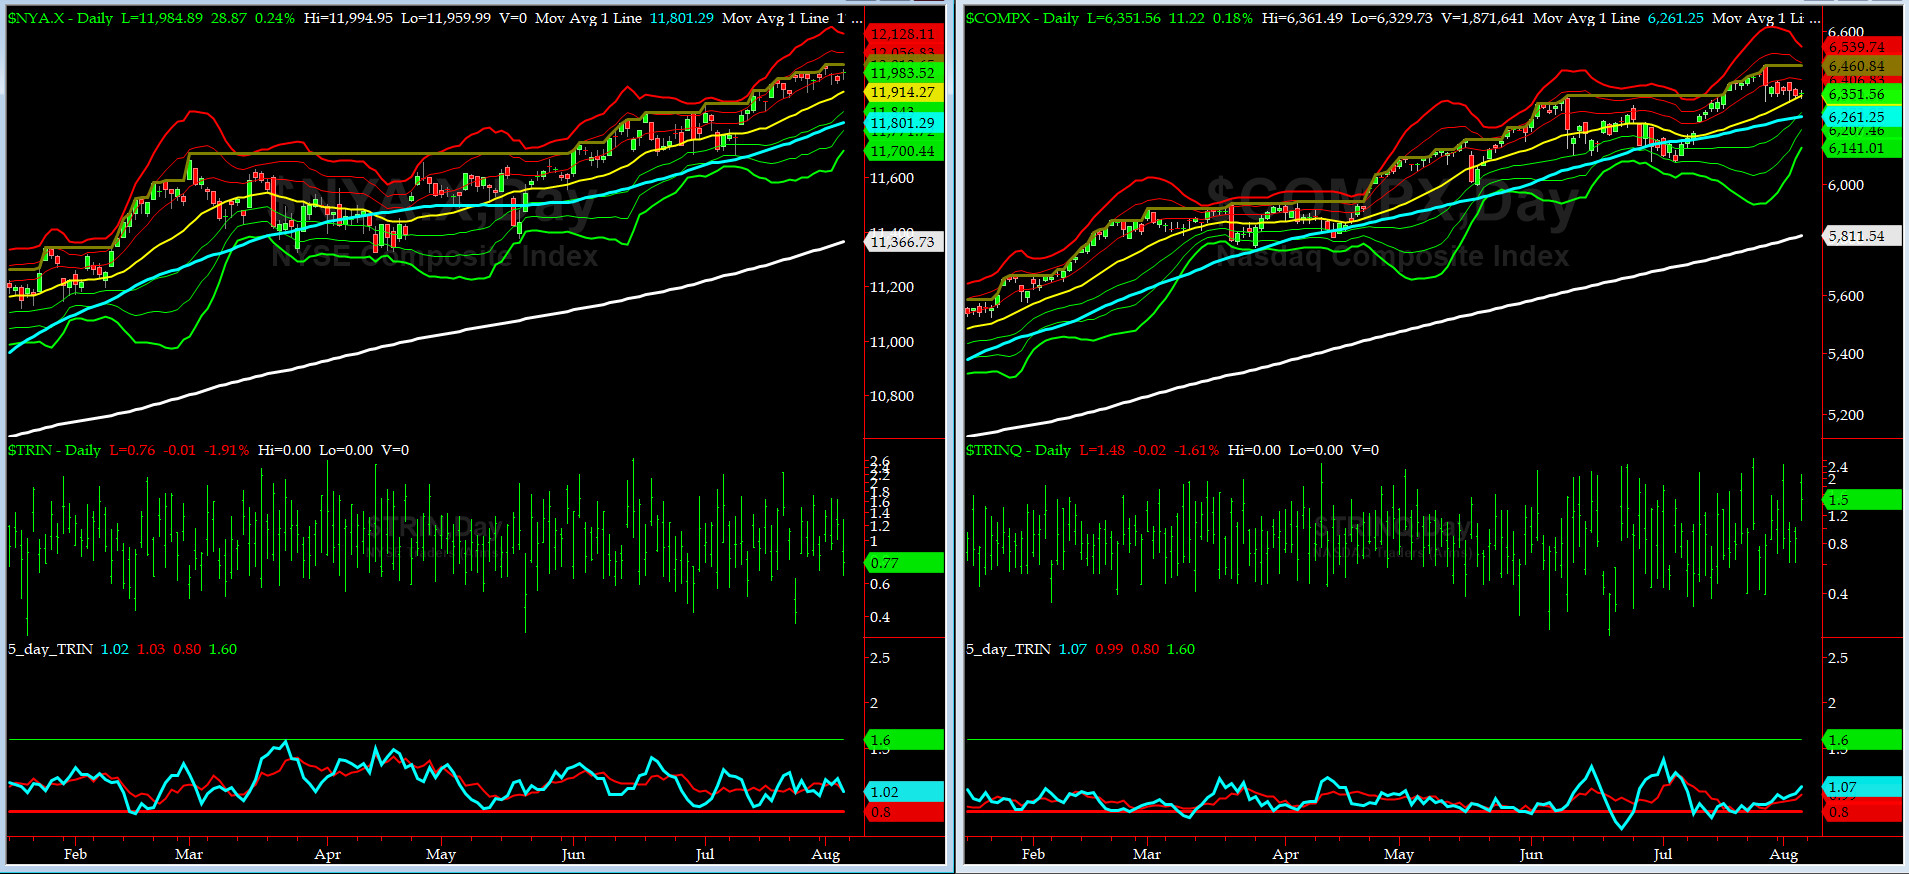
5-day TRIN & TRINQ Charts
Last week both NYSE & NASDAQ 5-day TRINs are in NEUTRAL zones.
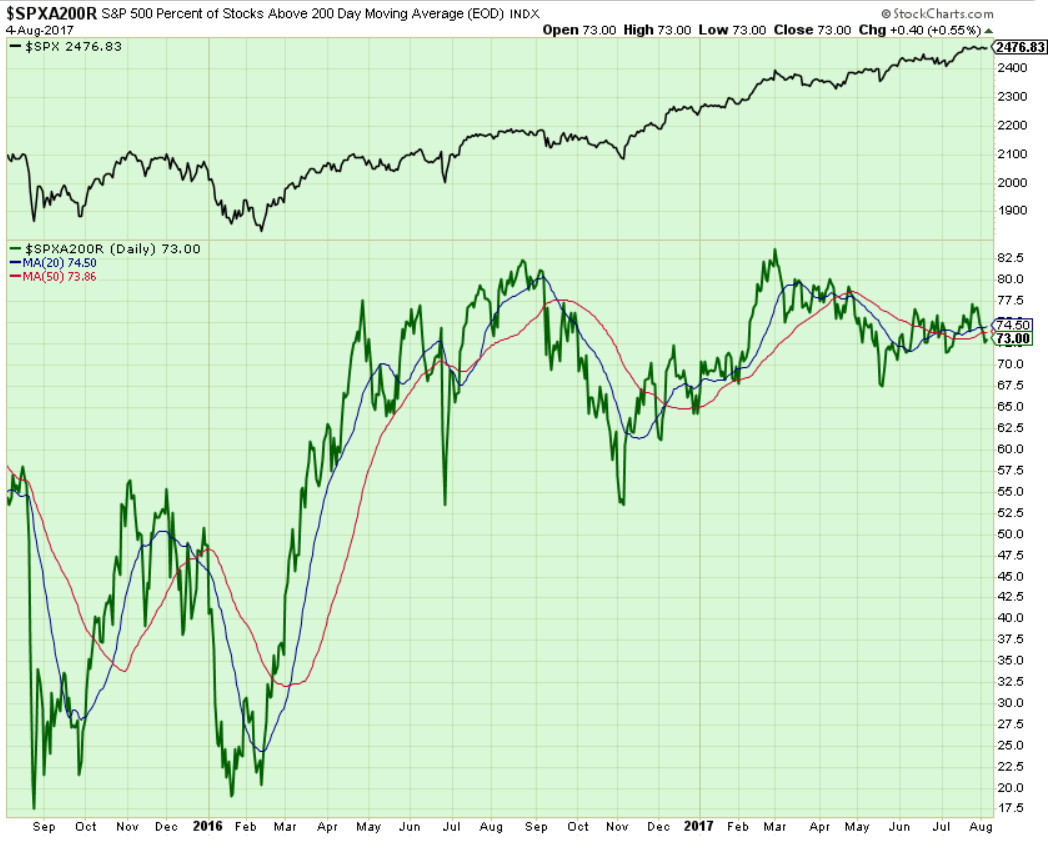
Components of SPX above their respective 200day MA Chart
This scoring indicator is in another clear and present divergence (read: danger) with SPX after touching 77% last week. HEADS UP.
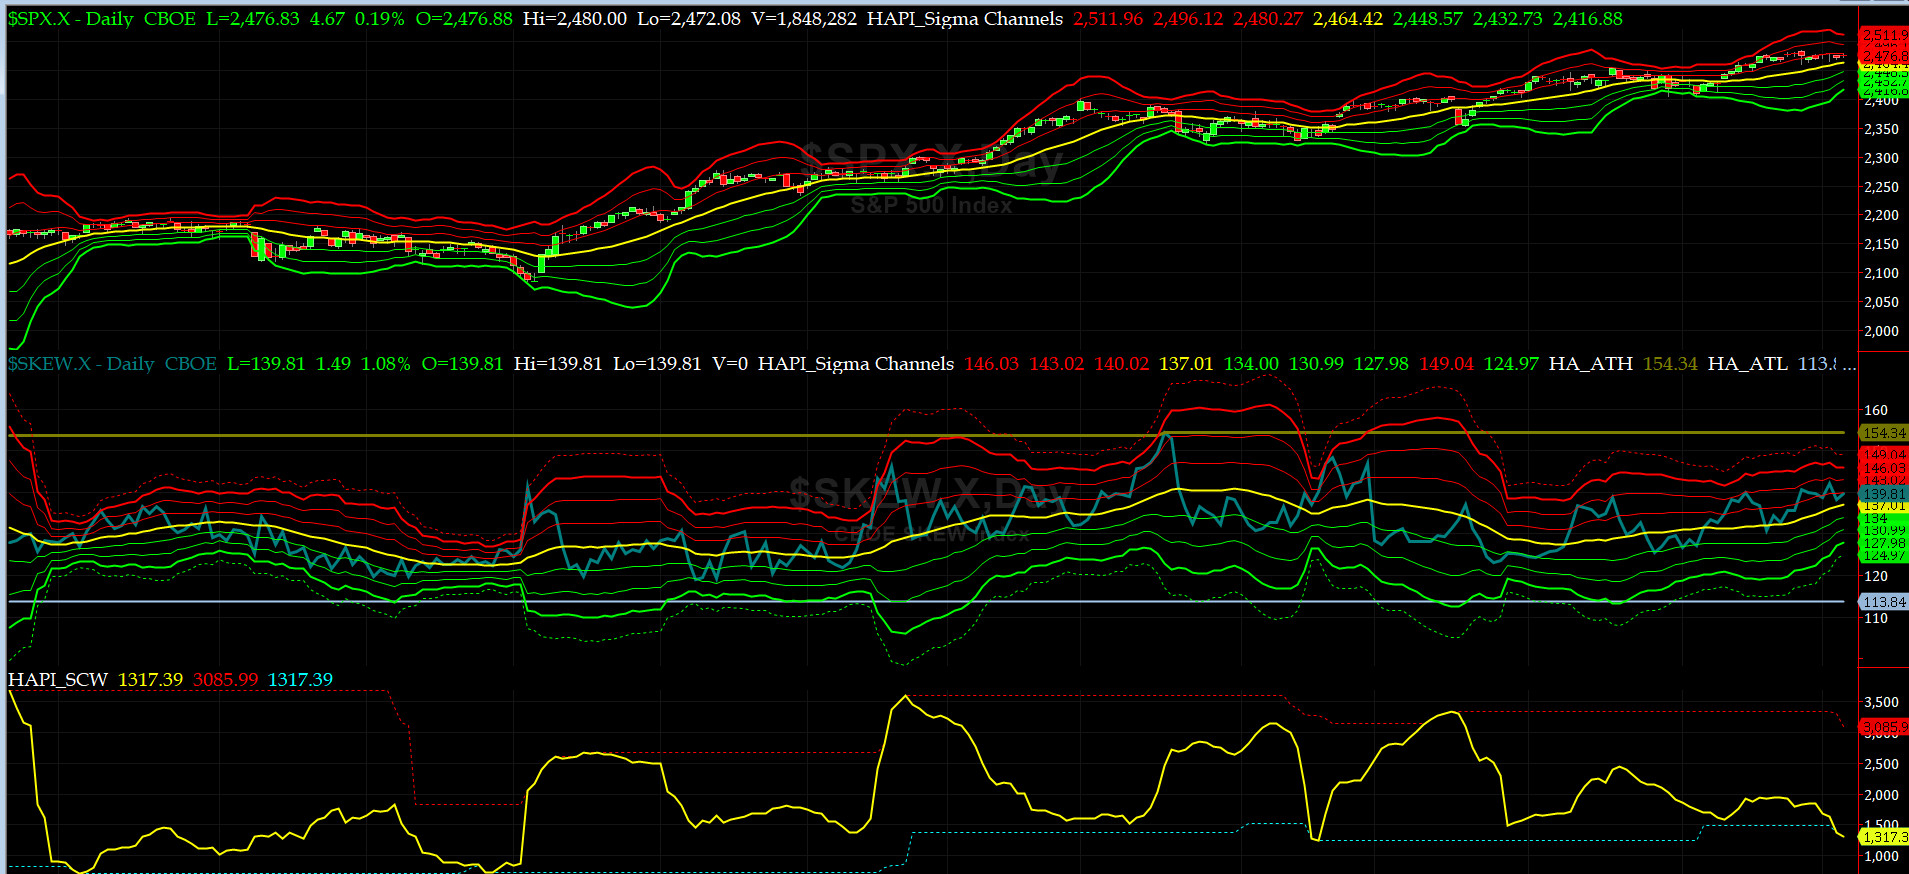
SPX SKEW (Tail Risk) Chart
Last week SPX SKEW (Tail Risk) went sideways this past week & closed at 139.81 at its +1 sigma (normal = 120-125, range 100-150).
Is all quiet on the Eastern & Mid-Western Fronts? Of course NOT.
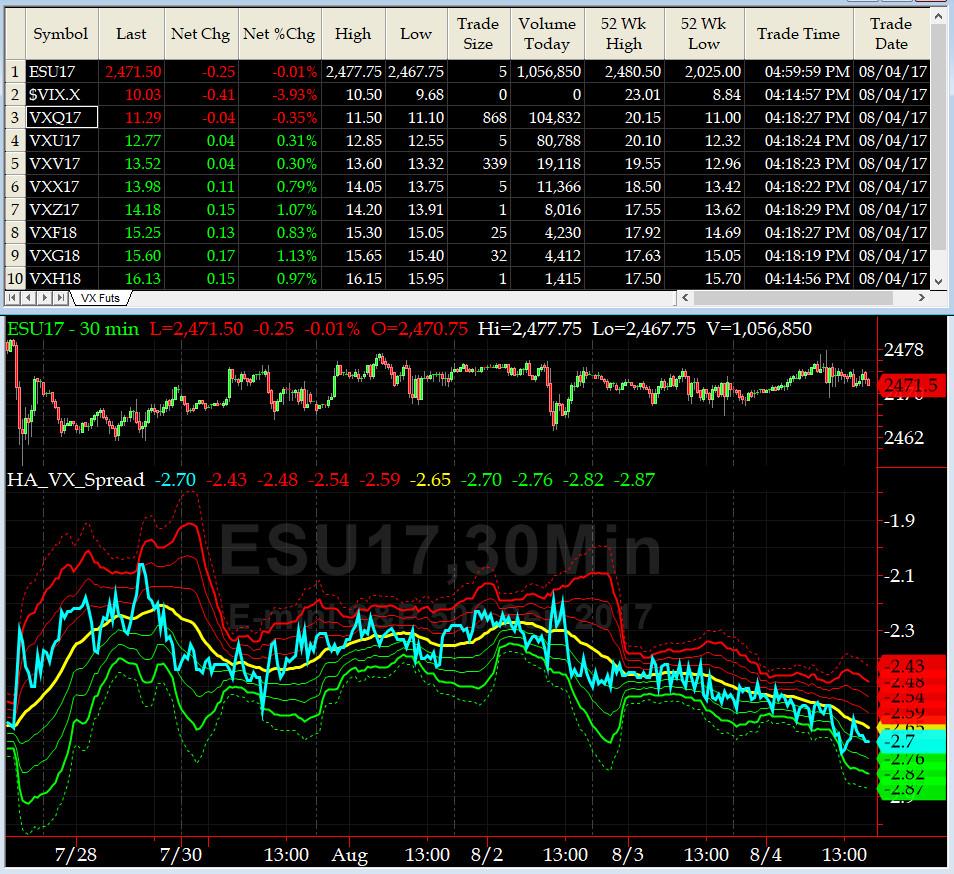
3-month VIX Futures Spread(VX) Chart
No signal here as we are still in neurtal zone.
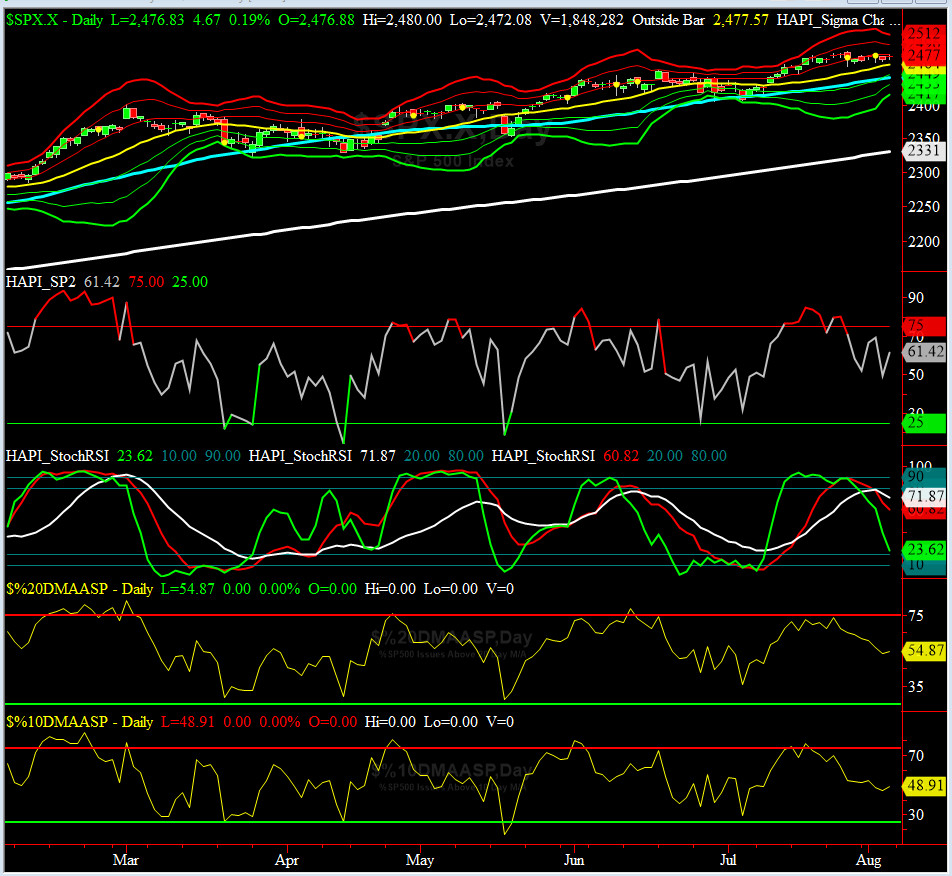
HA_SP2 Chart
HA_SP2 = 61 (Buy signal <= 25, Sell Signal >= 75)
Our fav prop indicator spent of the week above neutral and near overbought zones. STAY TUNED......
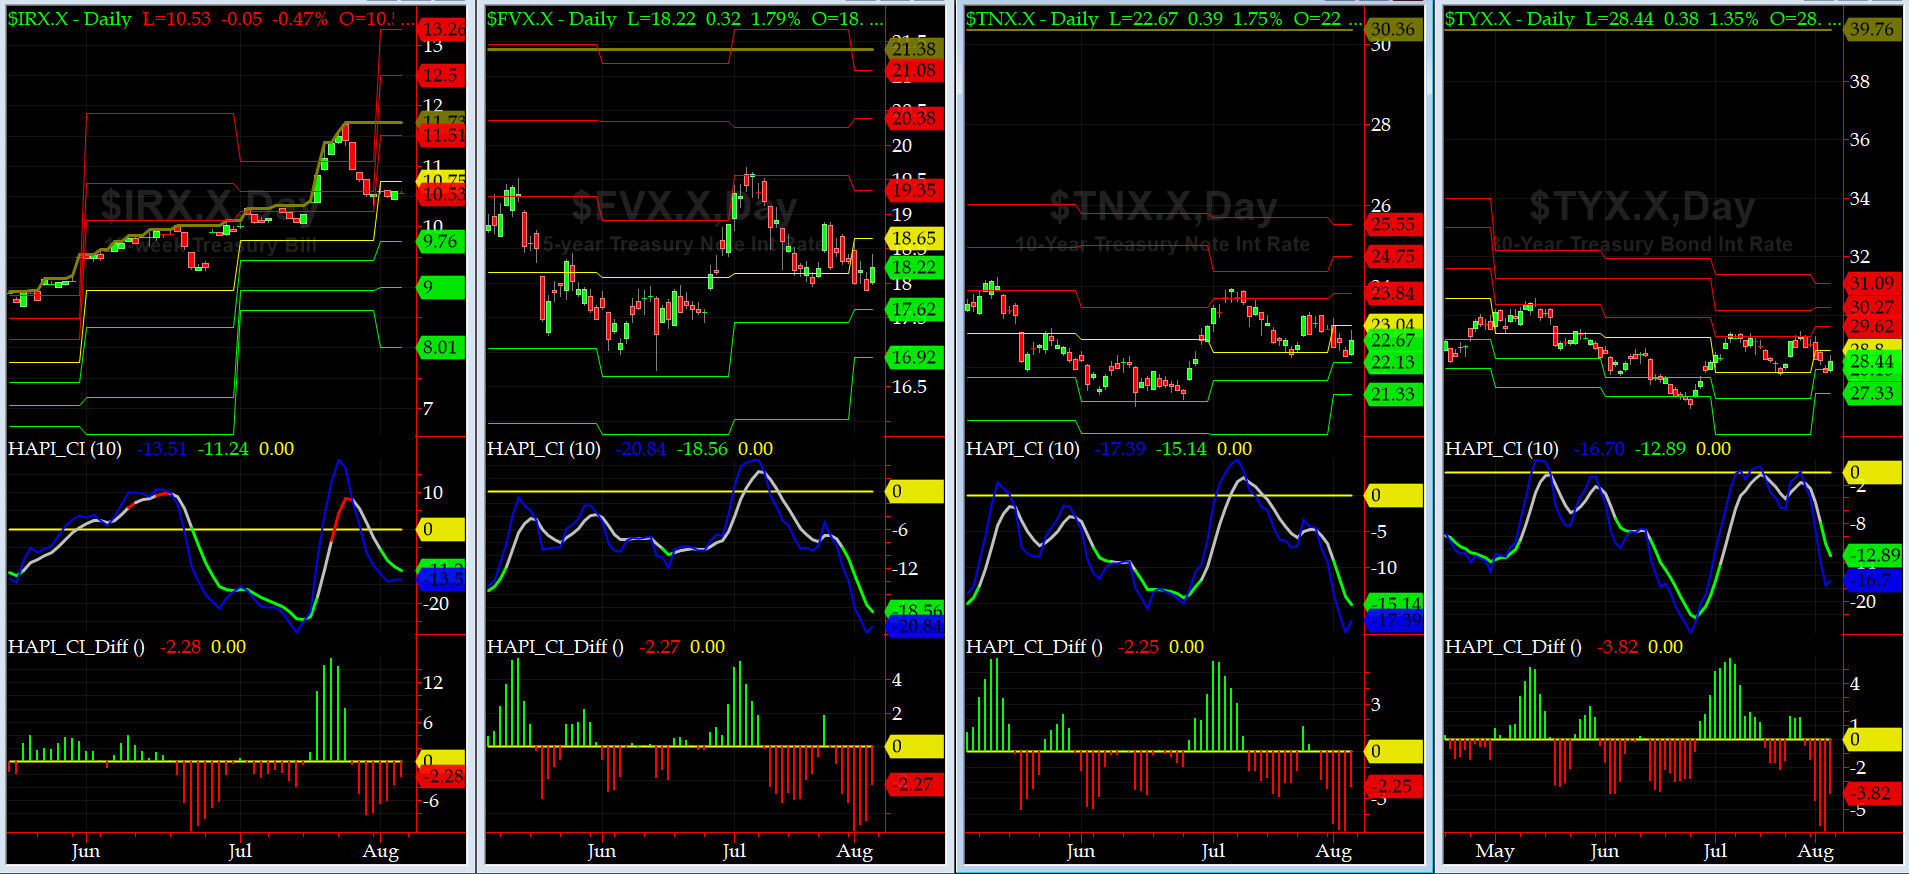
US Treasury T-Notes & T-Bonds Yields Chart
The Treasury Market also had another quiet week as August is here.
Fari Hamzei
|


 Proactive Market Timing