|
Sunday, August 27, 2017, 2145ET
Market Timing Charts, Analysis & Commentary for Issue #207
Timer Charts of S&P-500 Cash Index (SPX) + NASDAQ-100 Cash Index (NDX)
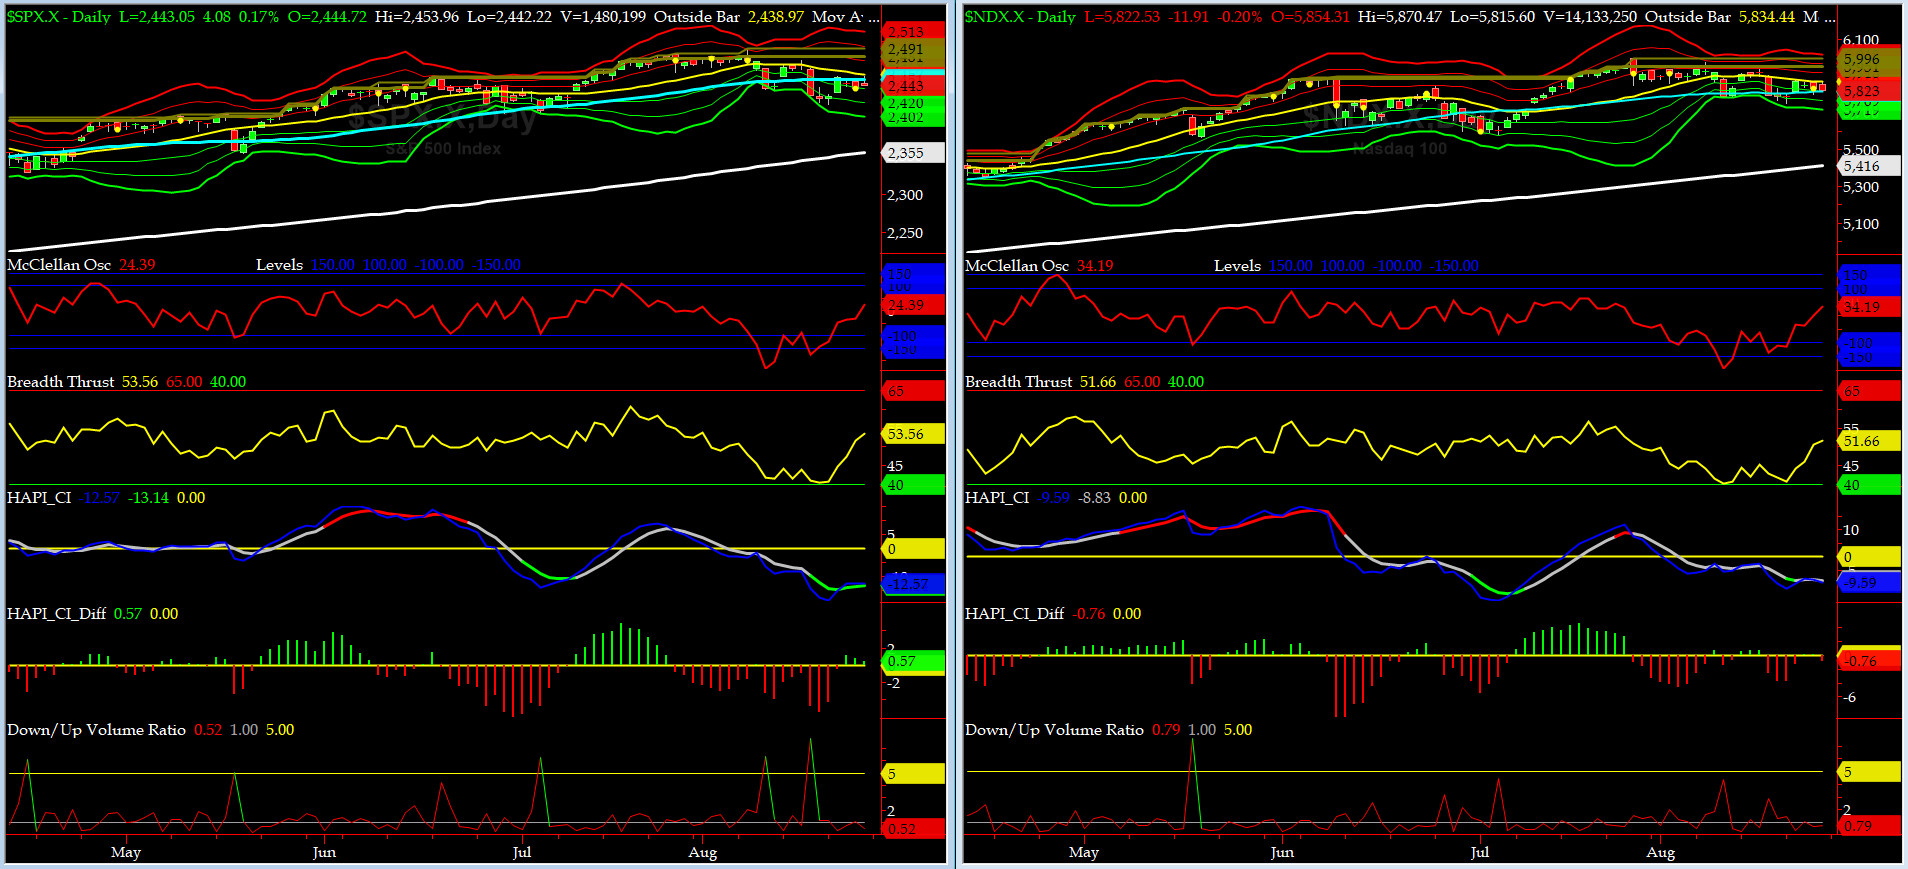
Most recent S&P-500 Cash Index (SPX): 2443.05 up +15.13 (up +0.62%) for the week ending on Friday, August 25, 2017, which closed just about its -1 sigma & below its 50 day MA.
SPX ALL TIME INTRADAY HIGH = 2490.87 (reached on Tuesday, Aug 8, 2017)
SPX ALL TIME CLOSING HIGH = 2480.91 (reached on Monday, Aug 7, 2017)
Current DAILY +2 Sigma SPX = 2494 with WEEKLY +2 Sigma = 2499
Current DAILY 0 Sigma (20 day MA) SPX = 2457 with WEEKLY 0 Sigma = 2422
Current DAILY -2 Sigma SPX = 2420 with WEEKLY -2 Sigma = 2345
NYSE McClellan Oscillator = +24 (-150 is start of the O/S area; around -275 to -300 area or lower, we go into the �launch-pad� mode, over +150, we are in O/B area)
NYSE Breadth Thrust = 53 (40 is considered as oversold and 65 as overbought)
News of Tax Reform efforts led by Gary Cohn and Steve Mnuchin lifted our equity markets on Tuesday. Rest of the week was uneventful.
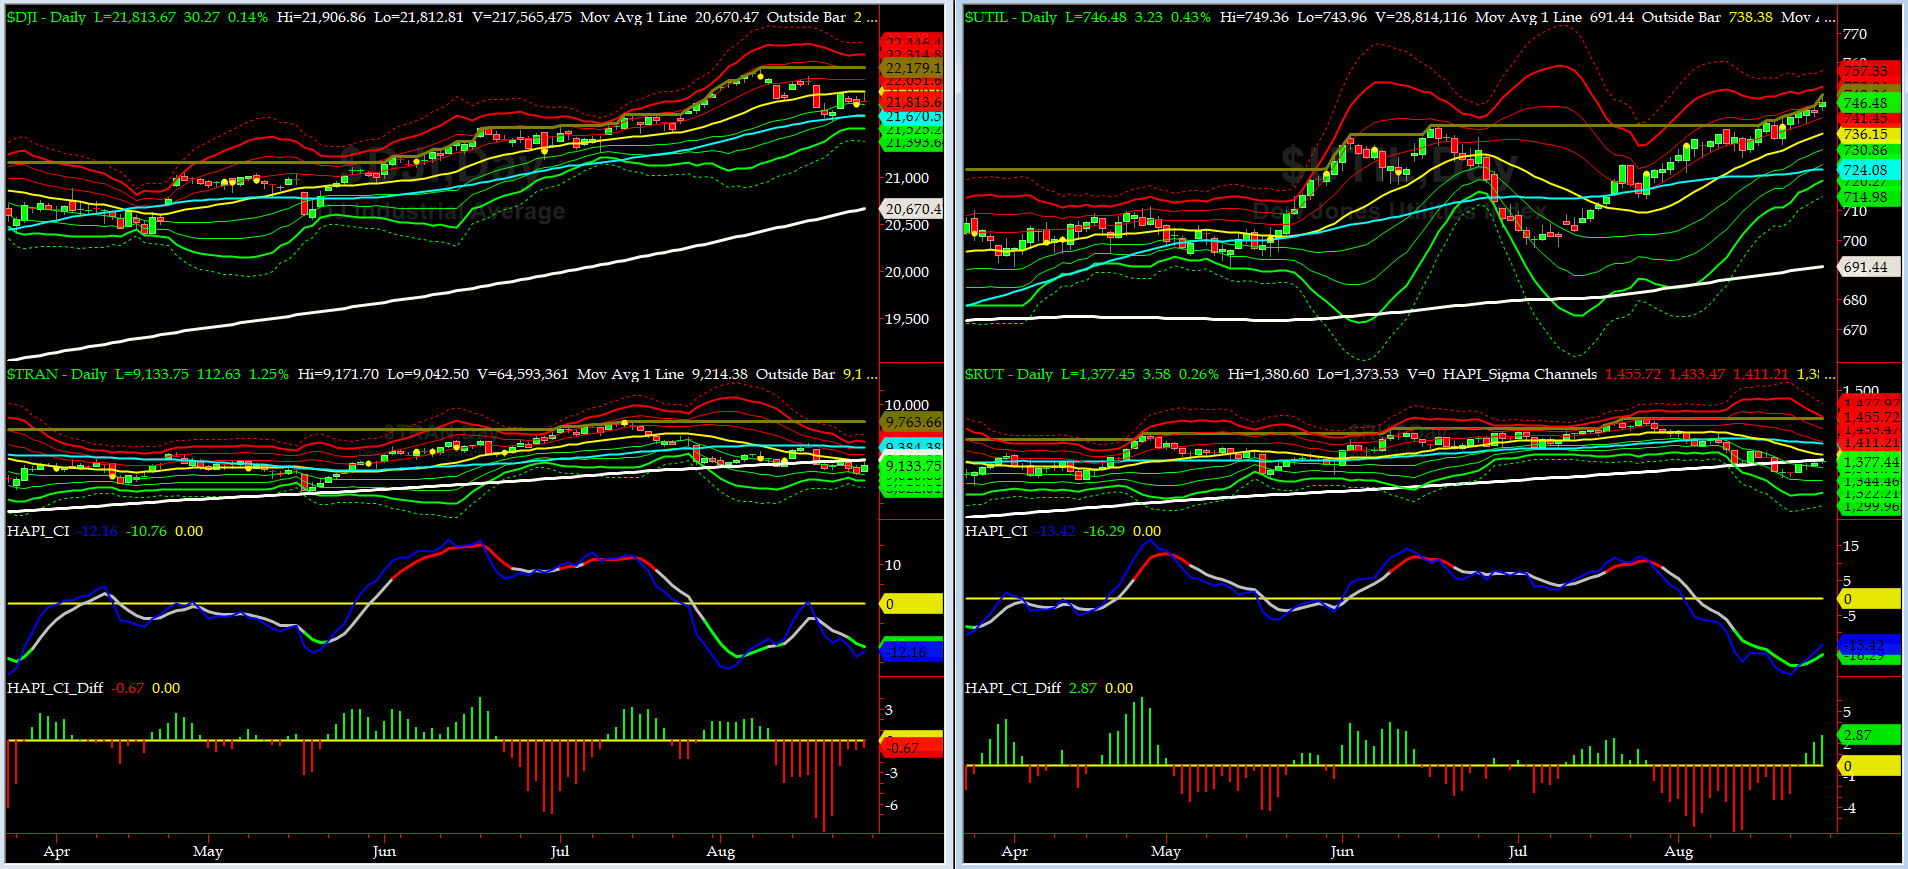
Canaries [in the Coal Mine] Chart for DJ TRAN & RUT Indices
200-Day MA DJ TRAN = 9214 or 0.9% above DJ TRAN (max observed in last 7 yrs = 20.2%, min = -20.3%)
200-Day MA RUT = 1380 or 0.2% above RUT (max observed in last 7 yrs = 21.3%, min = -22.6%)
DJ Transportation Index (proxy for economic conditions 6 to 9 months hence) is still trading below its 200 day MA.
Russell 2000 Small Caps Index (proxy for Risk ON/OFF) has tried very hard to regain its 200 day MA. Is RISK ON? still NO....
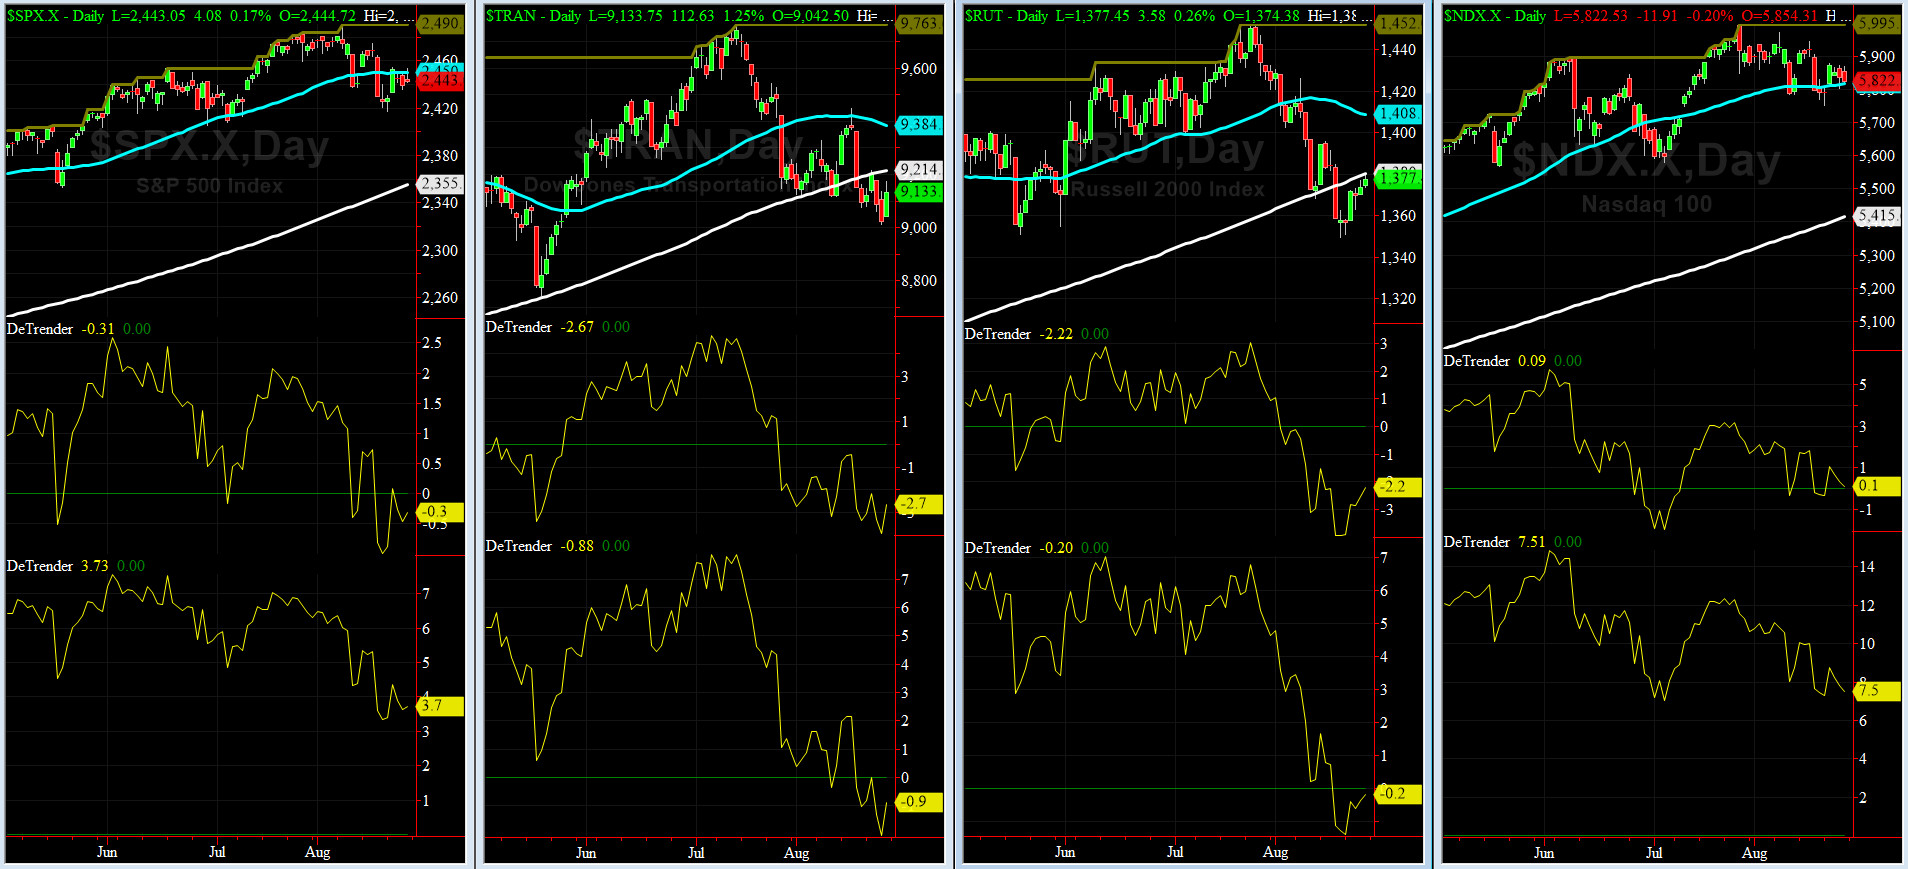
DeTrenders Charts for SPX, NDX, TRAN & RUT Indices
50-Day MA SPX = 2450 or 0.3% above SPX (max observed in last 7 yrs = +8.6%, min = -9.3%)
200-Day MA SPX = 2355 or 3.7% below SPX (max observed in last 7 yrs = 15.2%, min = -14%)
Only THREE of our EIGHT DeTrenders are POSITIVE while the DeTrenders for DJ Tran & RUT will continue to be harbingers of future price behavior in broad indices.
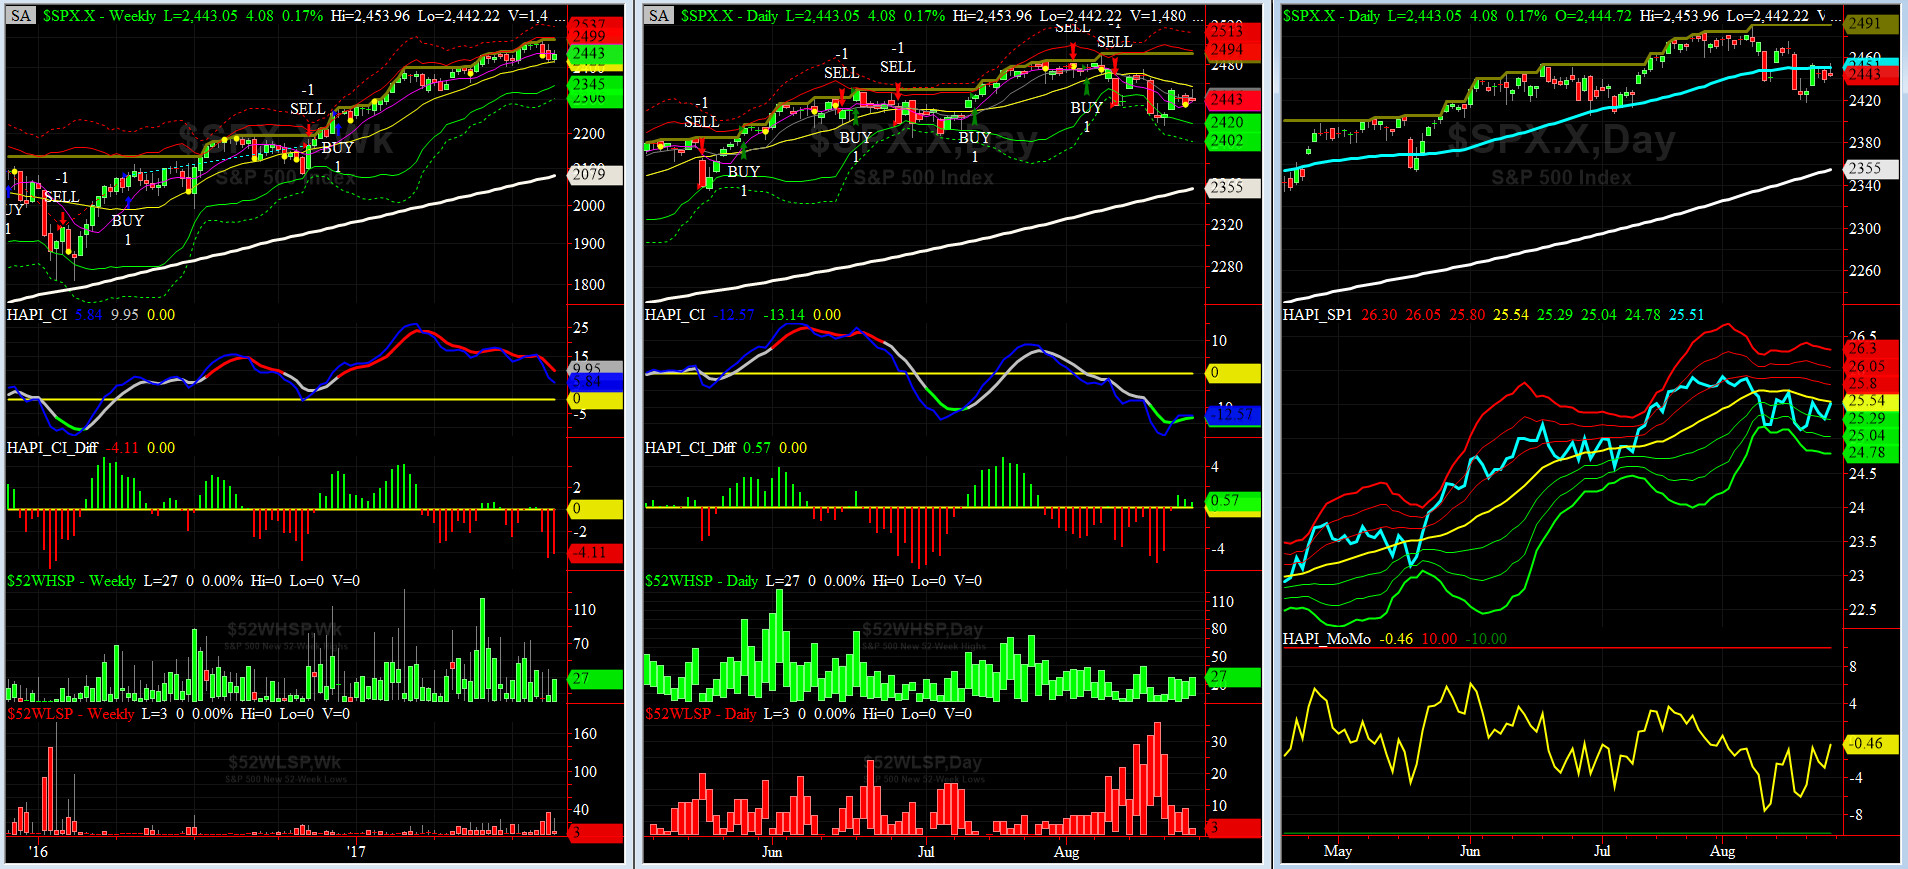
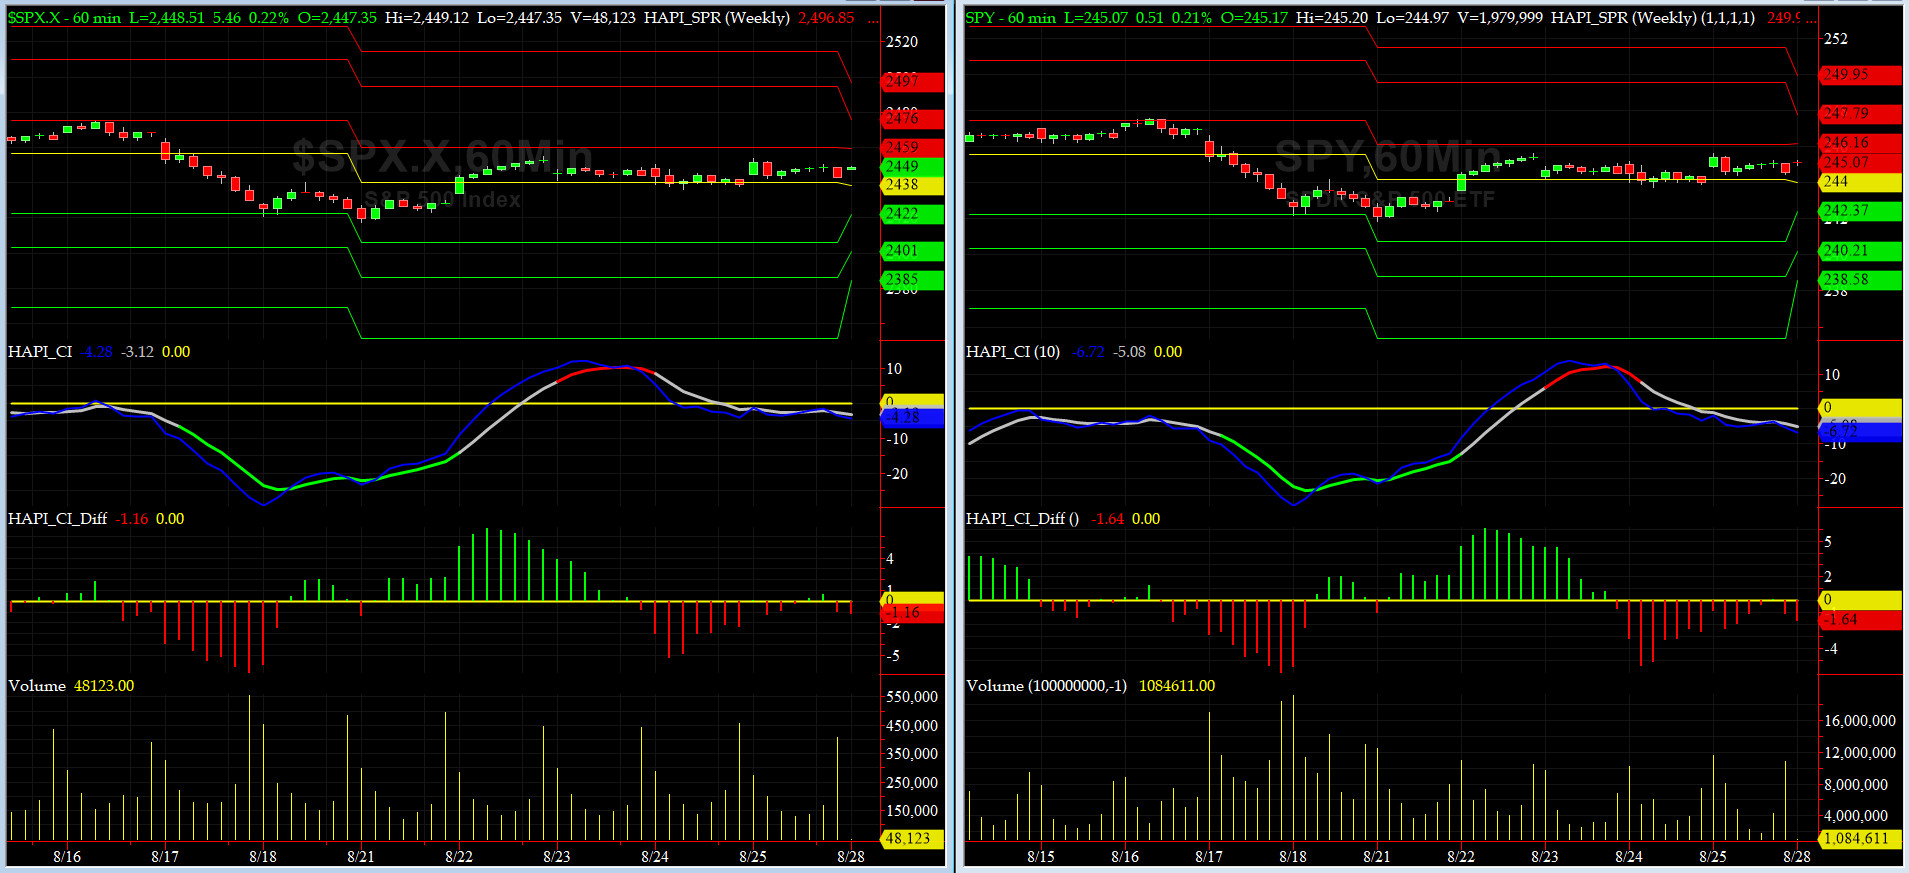
HA_SP1_Momo Chart
WEEKLY Timing Model = on a BUY Signal since Friday 12/16/16 CLOSE at 2258
DAILY Timing Model = on a SELL Signal since Thursday 8/10/17 CLOSE at 2438
Max SPX 52wk-highs reading last week = 27 (over 120-140, the local maxima is in)
Max SPX 52wk-Lows reading last week = 26 (over 40-60, the local minima is in)
HA_SP1 closed near its zero sigma channels
HA_Momo = -0.5 (reversals most likely occur above +10 or below -10)

Vol of the Vols Chart
VIX currently stands at 11.28, or just below its zero sigma (remember it's the VIX volatility pattern ( its sigma channels) that matters, and not the level of VIX itself (this is per Dr. Robert Whaley, a great mentor and inventor of original VIX, now called VXO ). VIX usually peaks around a test of its +4 sigma).
Last Tuesday, we saw VIX drop and since then it has been fairly quiet.

5-day TRIN & TRINQ Charts
Both NYSE & NASDAQ 5-day TRINs are in NEUTRAL Zone. No Signal here.....
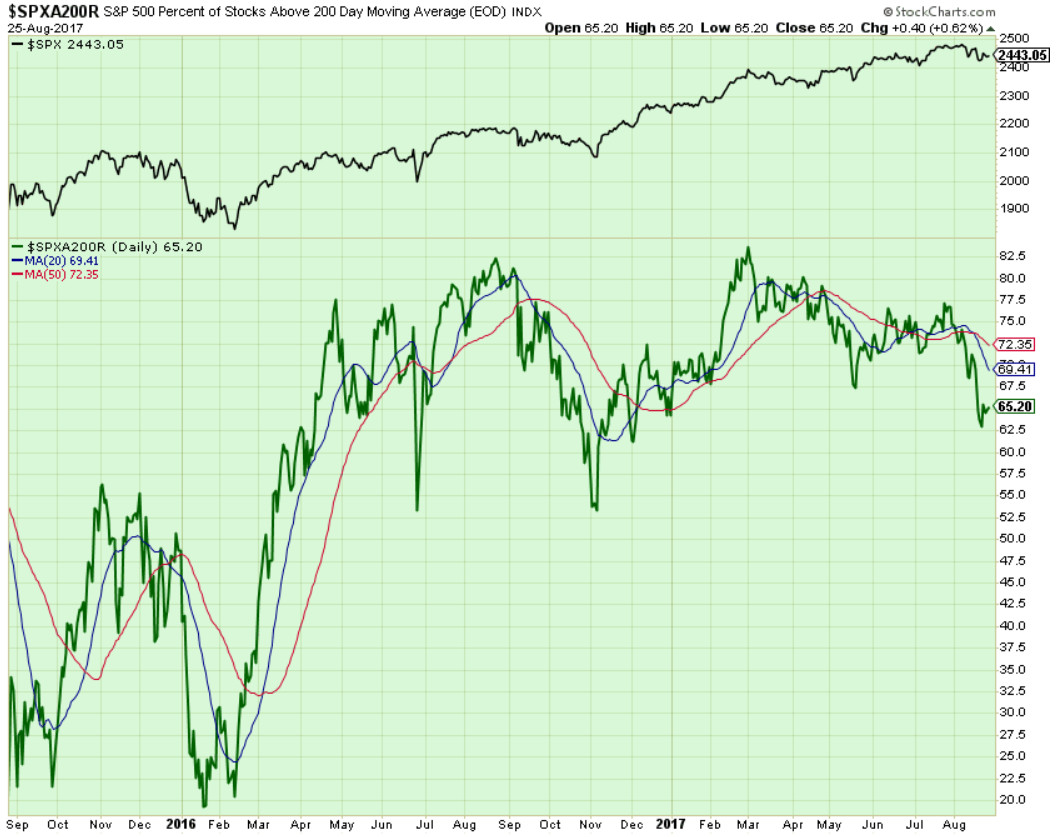
Components of SPX above their respective 200day MA Chart
During the past week, this scoring indicator tested its 62.5% level and then closed at 65%. We are still watching 55% to 60% area carefully.
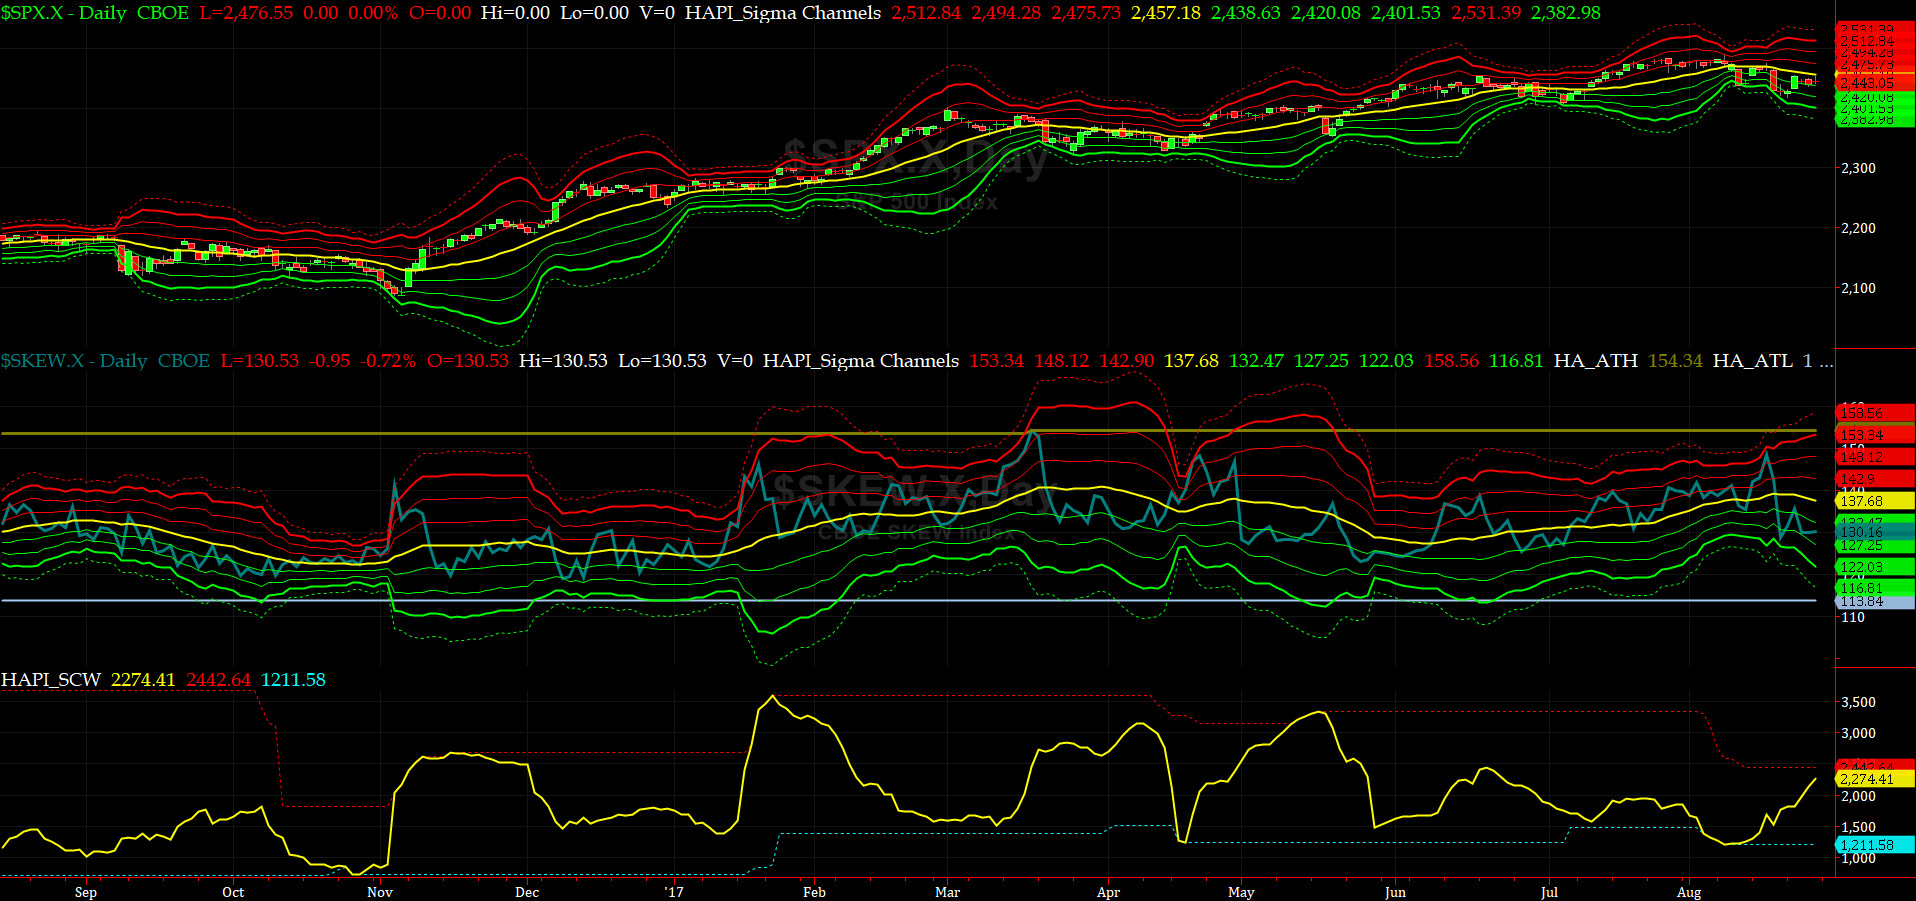
SPX SKEW (Tail Risk) Chart
Last week SPX SKEW (Tail Risk) sank to 130, or its -1.5 sigma, on Wednesday (normal = 120-125, range 100-150).
Is all quiet on the Eastern & Mid-Western Fronts? Smart Money thinks YES.
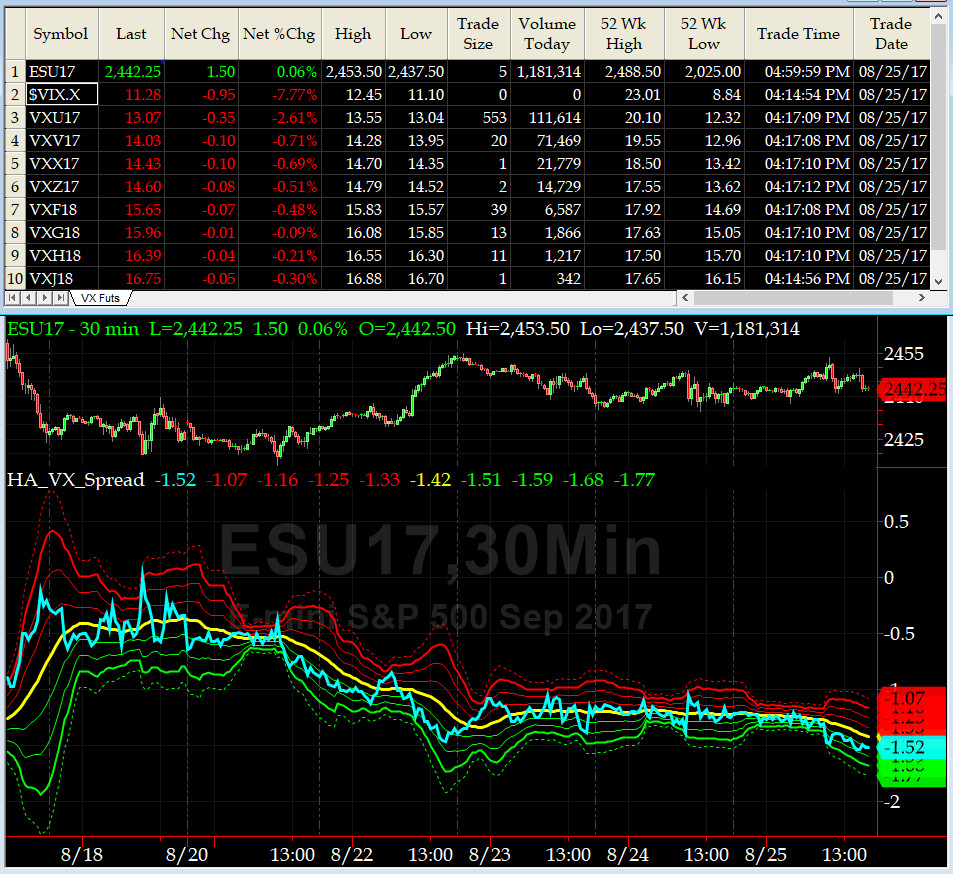
3-month VIX Futures Spread(VX) Chart
The Long SEP, Short DEEZ Spread continues to exhibit a negative slope. SPX should head higher into Labor Day long weekend.
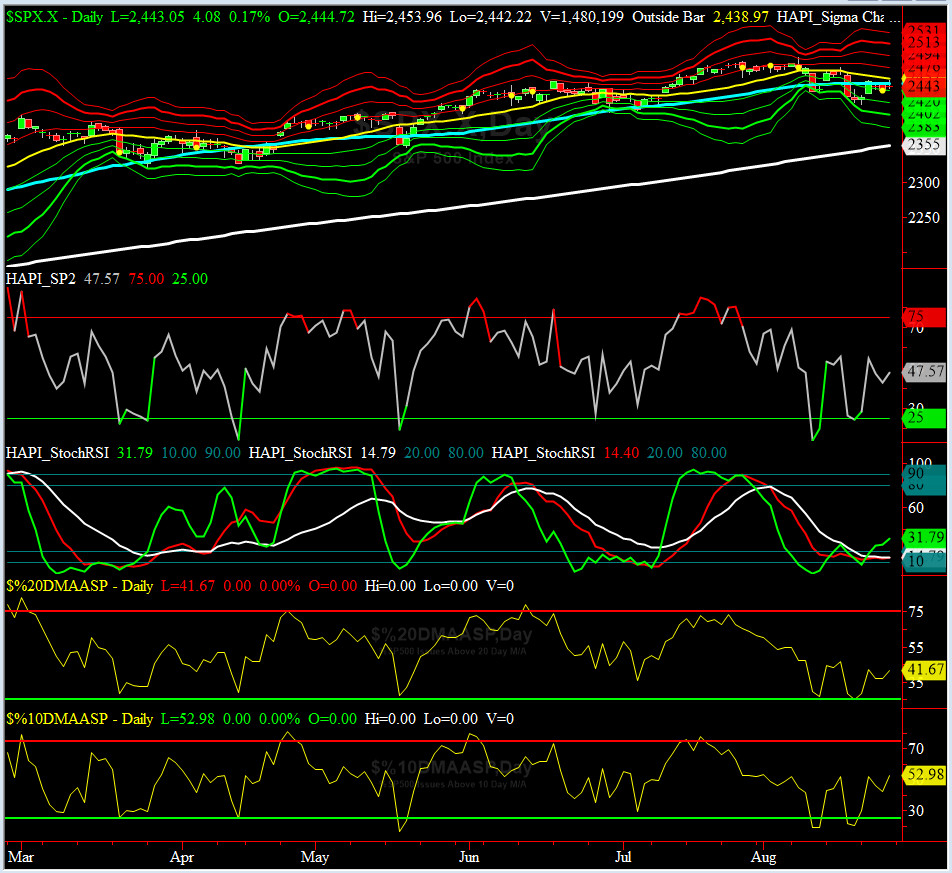
HA_SP2 Chart
HA_SP2 = 47.6 (Buy signal <= 25, Sell Signal >= 75)
Our favorite prop indicator again did what it does best. It exhibited a unique prescient of short-term market behavior.
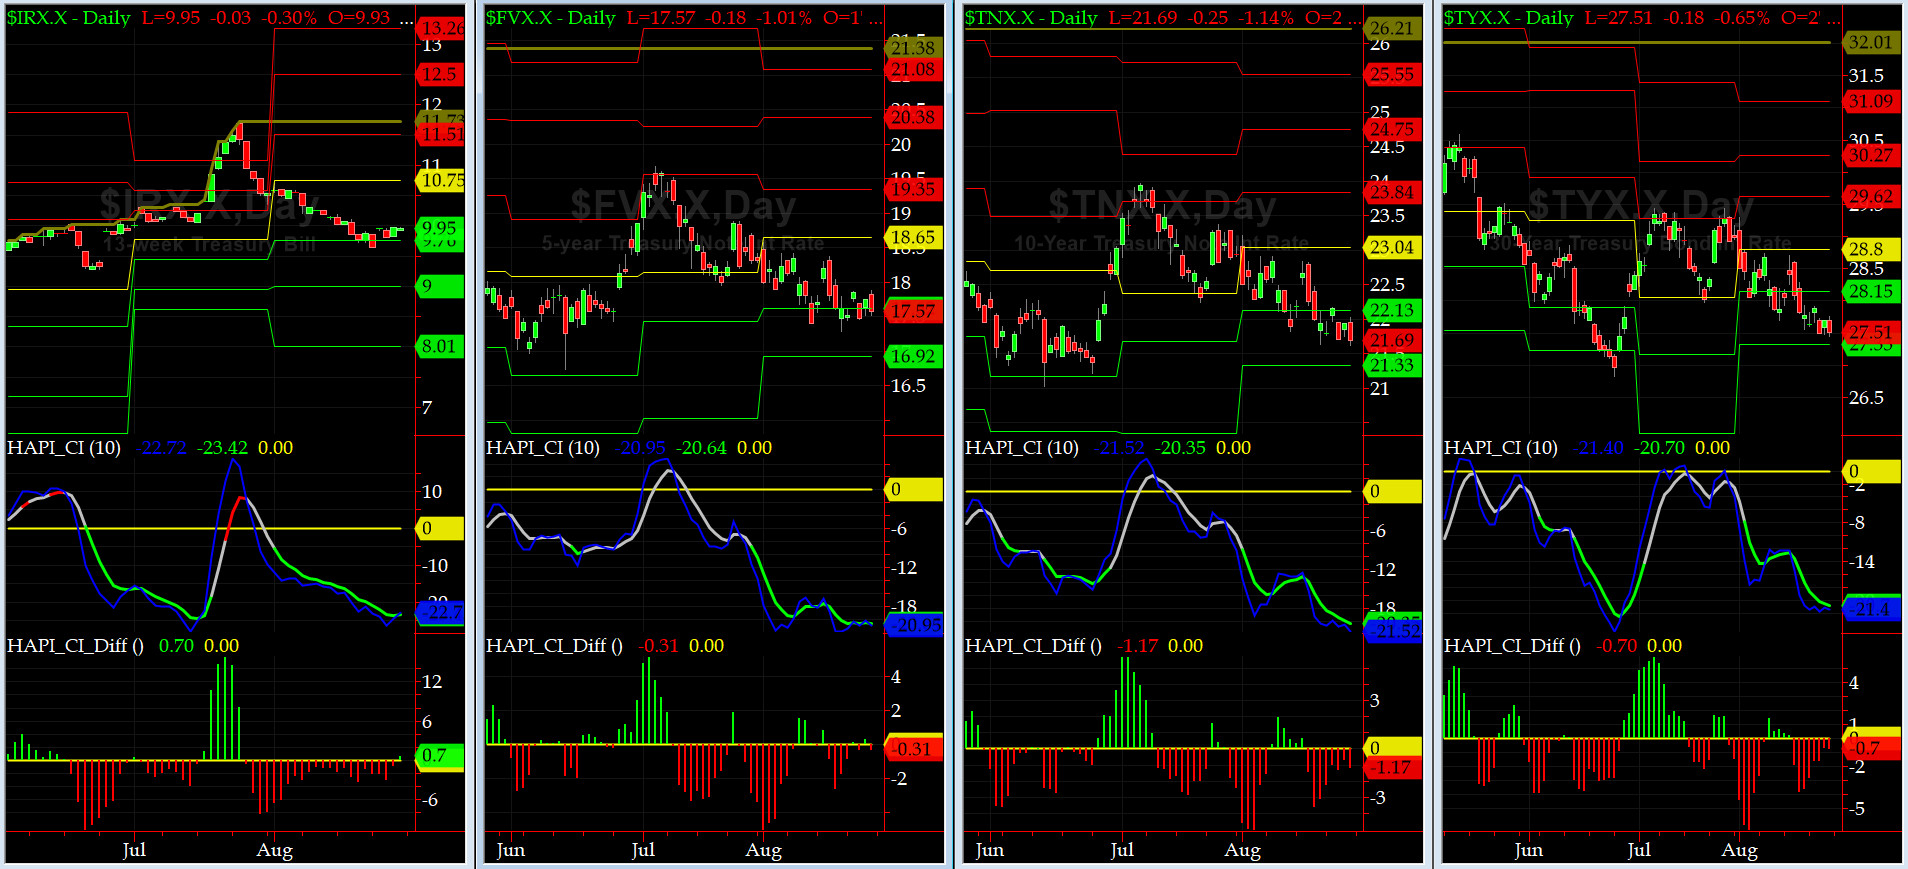
US Treasury T-Notes & T-Bonds Yields Chart
The Treasury Market went sideways last week as most players were on their last weeks of summer vacations.
Fari Hamzei
|


 Proactive Market Timing