|
Saturday, September 16, 2017, 1645ET
Market Timing Charts, Analysis & Commentary for Issue #209
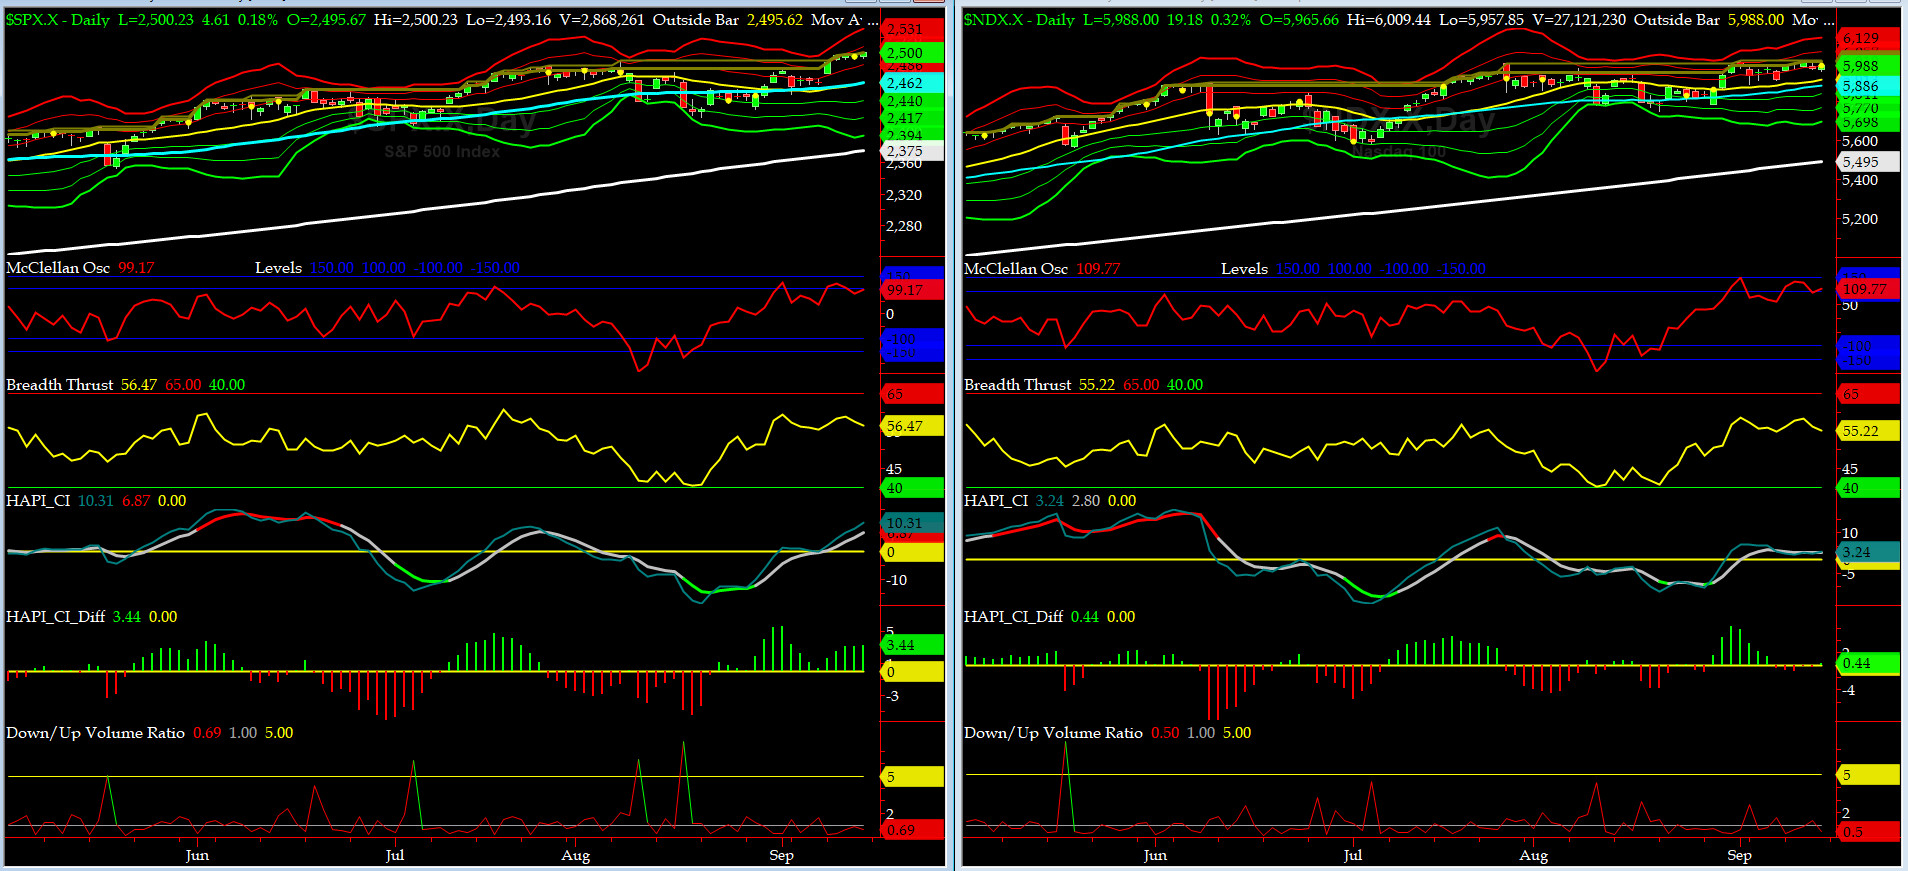
Timer Charts of S&P-500 Cash Index (SPX) + NASDAQ-100 Cash Index (NDX)
Most recent S&P-500 Cash Index (SPX): 2500.23 up +38.80 (up +1.58%) for the week ending on Friday, September 15, 2017, which closed just about its +1.5 sigma.
SPX ALL TIME INTRADAY HIGH = 2500.23 (reached on Friday, Sep 15, 2017)
SPX ALL TIME CLOSING HIGH = 2500.23 (reached on Friday, Sep 15, 2017)
Current DAILY +2 Sigma SPX = 2509 with WEEKLY +2 Sigma = 2501
Current DAILY 0 Sigma (20 day MA) SPX = 2463 with WEEKLY 0 Sigma = 2440
Current DAILY -2 Sigma SPX = 2417 with WEEKLY -2 Sigma = 2380
NYSE McClellan Oscillator = +99 (-150 is start of the O/S area; around -275 to -300 area or lower, we go into the �launch-pad� mode, over +150, we are in O/B area)
NYSE Breadth Thrust = 56.5 (40 is considered as oversold and 65 as overbought)
Many weeks ago we stated that 2500 for SPX is a crucial 'PRICE OCTAVE.' Many emails & tweets came in asking what does that mean. Well, best is to ask the shorts LOL.
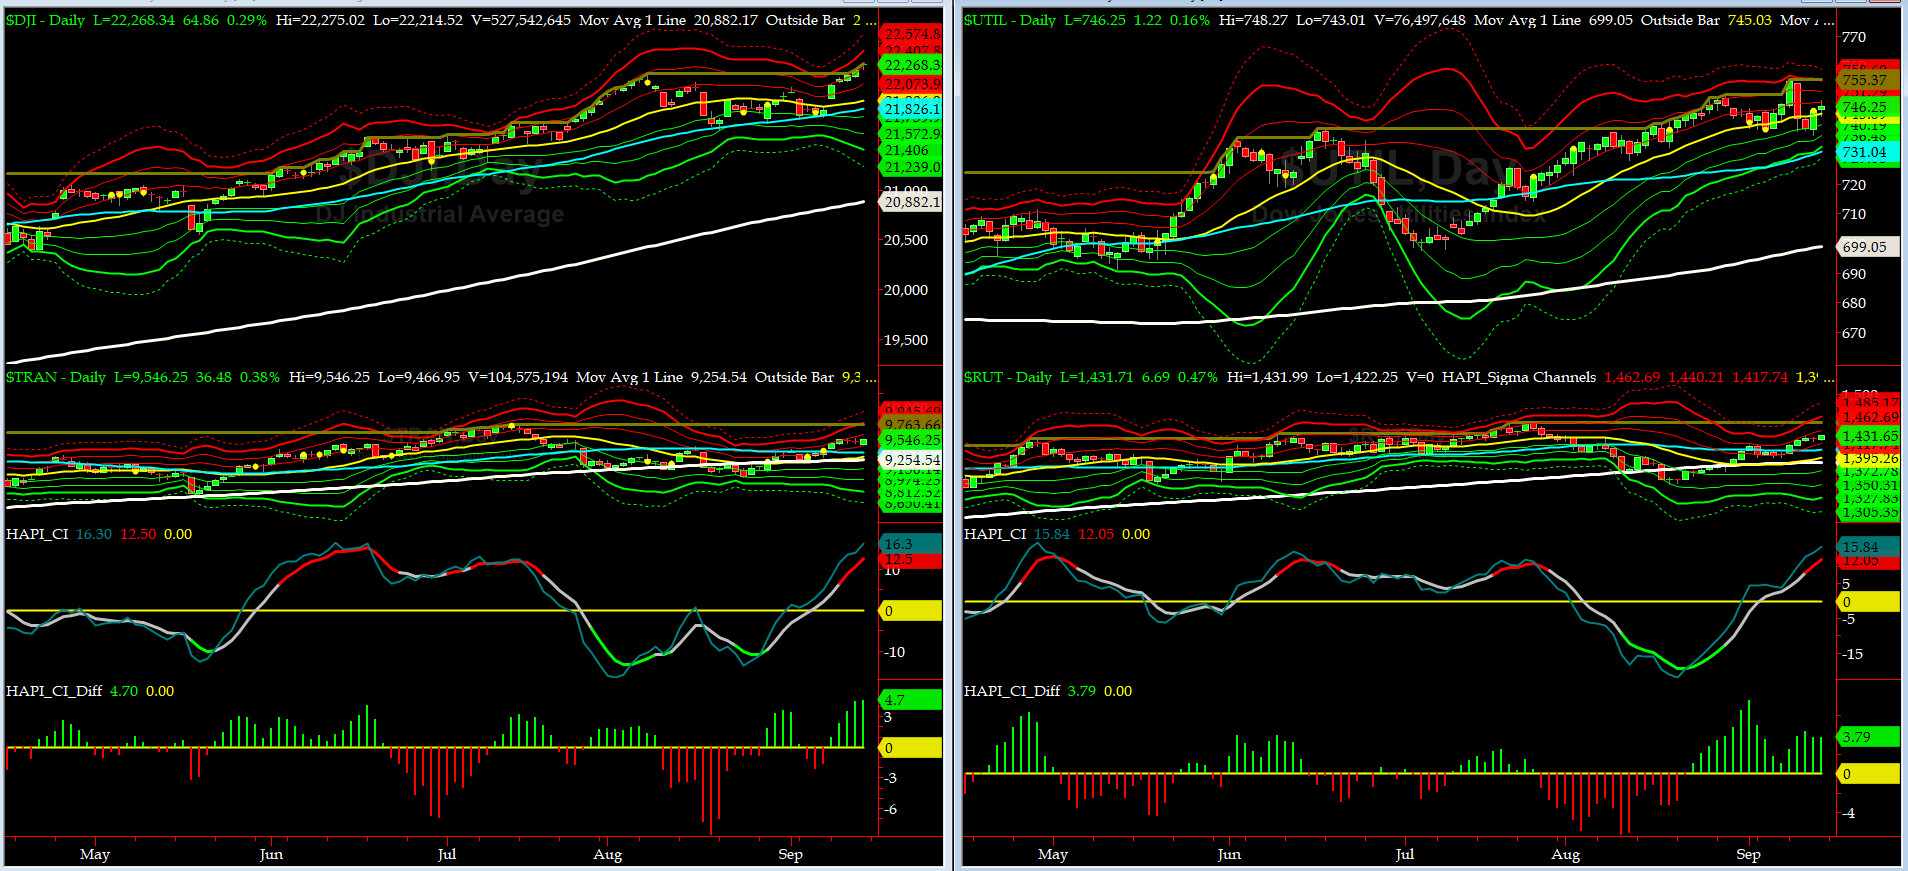
Canaries [in the Coal Mine] Chart for DJ TRAN & RUT Indices
200-Day MA DJ TRAN = 9254 or 3.2% above DJ TRAN (max observed in last 7 yrs = 20.2%, min = -20.3%)
200-Day MA RUT = 1387 or 3.2% above RUT (max observed in last 7 yrs = 21.3%, min = -22.6%)
DJ Transportation Index (proxy for economic conditions 6 to 9 months hence) is on a roar again. We love it.
Russell 2000 Small Caps Index (proxy for Risk ON/OFF) continued its strenght by shooting up further.... RISK is back ON.
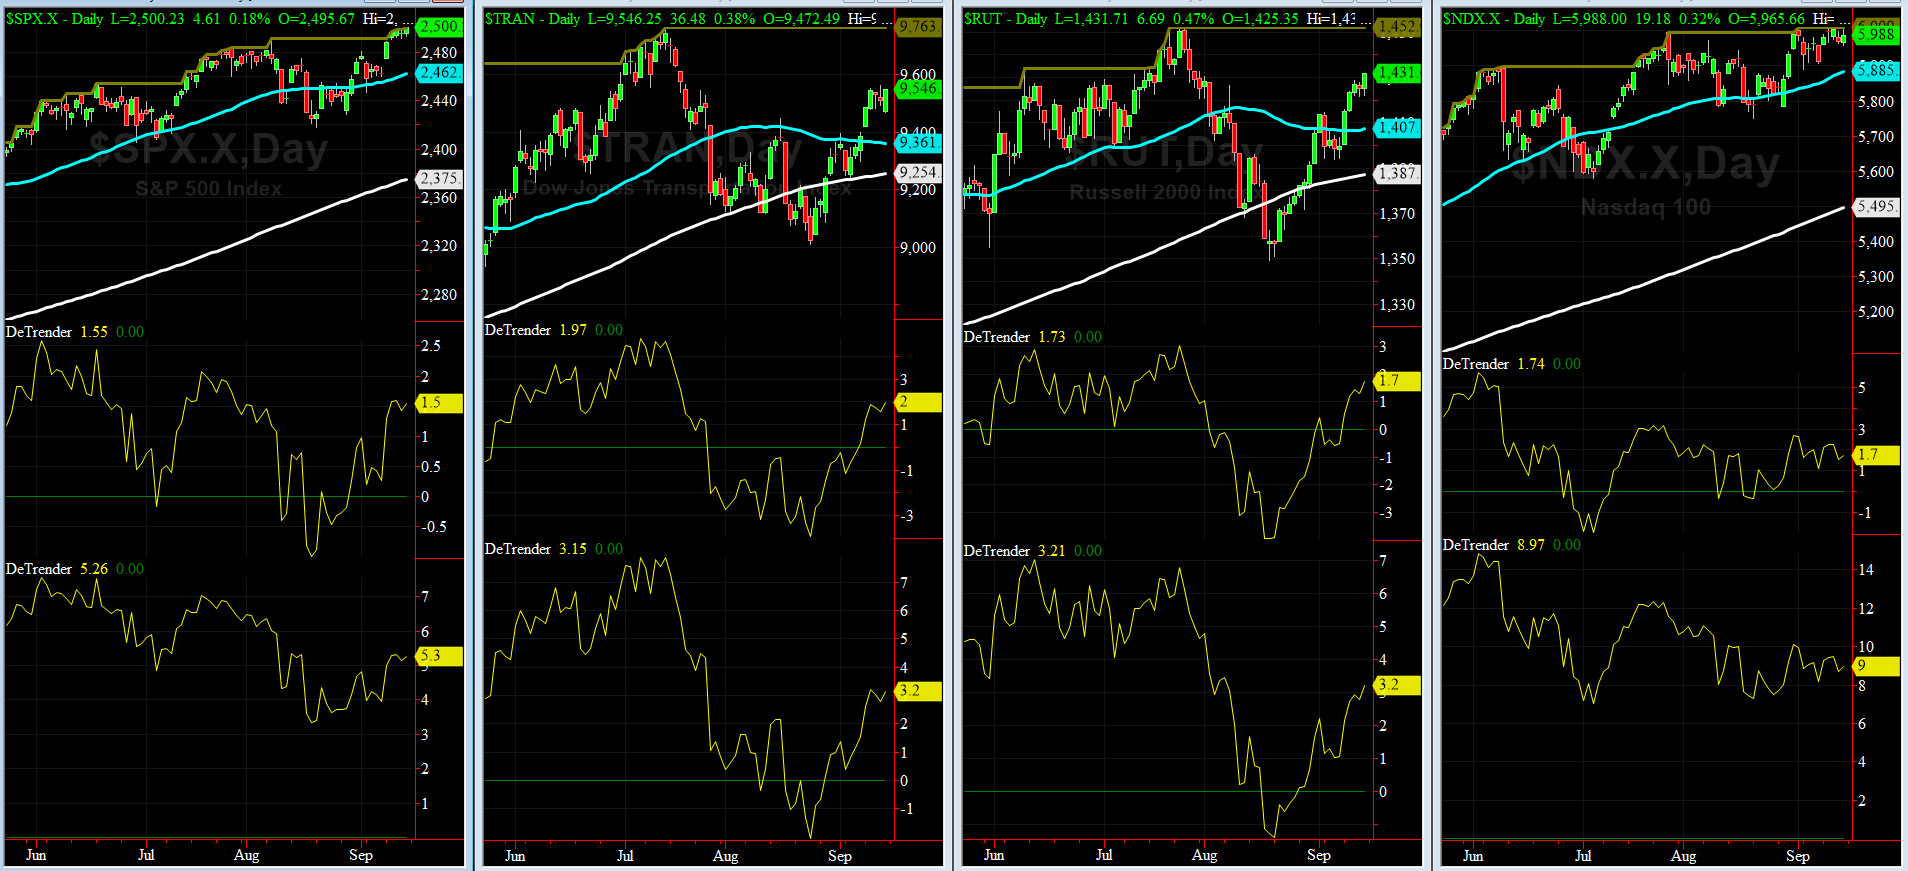
DeTrenders Charts for SPX, NDX, TRAN & RUT Indices
50-Day MA SPX = 2462 or 1.5% above SPX (max observed in last 7 yrs = +8.6%, min = -9.3%)
200-Day MA SPX = 2375 or 5.3% below SPX (max observed in last 7 yrs = 15.2%, min = -14%)
Only TWO of our EIGHT DeTrenders are NEGATIVE while the DeTrenders for DJ Tran & RUT will continue to be harbingers of future price behavior in broad indices.
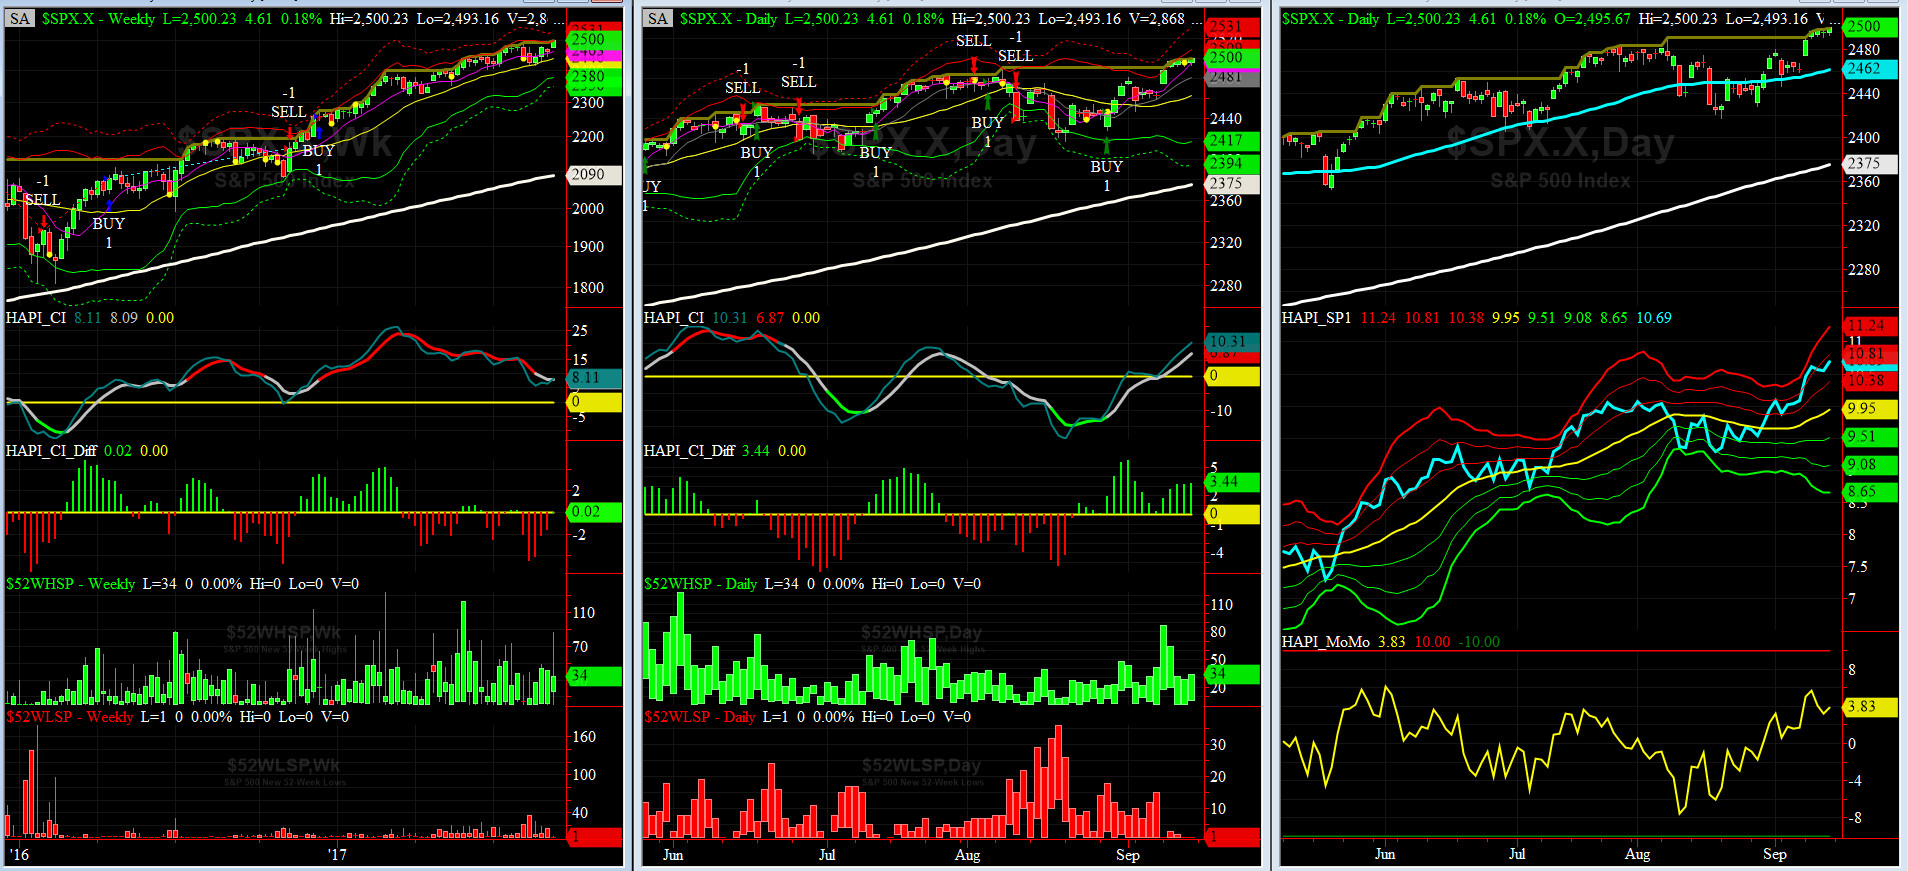
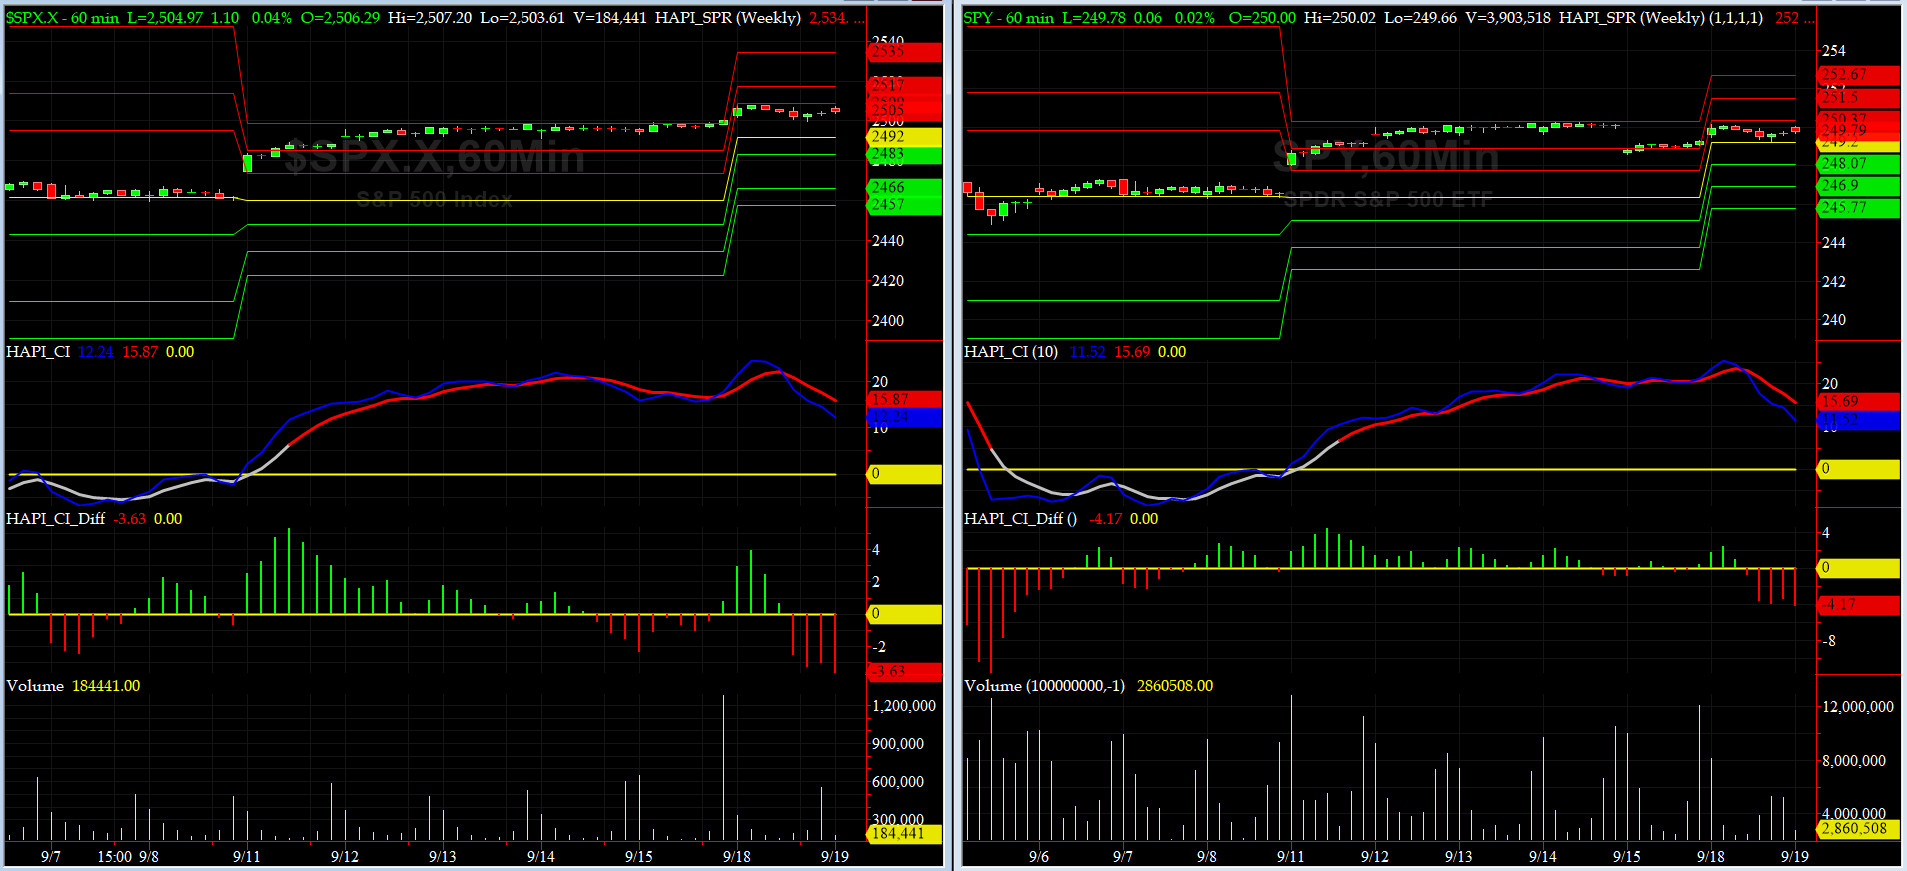
HA_SP1_Momo Chart
WEEKLY Timing Model = on a BUY Signal since Friday 12/16/16 CLOSE at 2258
DAILY Timing Model = on a BUY Signal since Tuesday 8/29/17 CLOSE at 2446
Max SPX 52wk-highs reading last week = 87 (over 120-140, the local maxima is in)
Max SPX 52wk-Lows reading last week = 3 (over 40-60, the local minima is in)
HA_SP1 closed near its +2 sigma channels
HA_Momo = +3.8 (reversals most likely occur above +10 or below -10)

Vol of the Vols Chart
VIX currently stands at 10.17, or just about its -1 sigma (remember it's the VIX volatility pattern ( its sigma channels) that matters, and not the level of VIX itself (this is per Dr. Robert Whaley, a great mentor and inventor of original VIX, now called VXO ). VIX usually peaks around a test of its +4 sigma).
Last week, VIX complex continued to sell off.
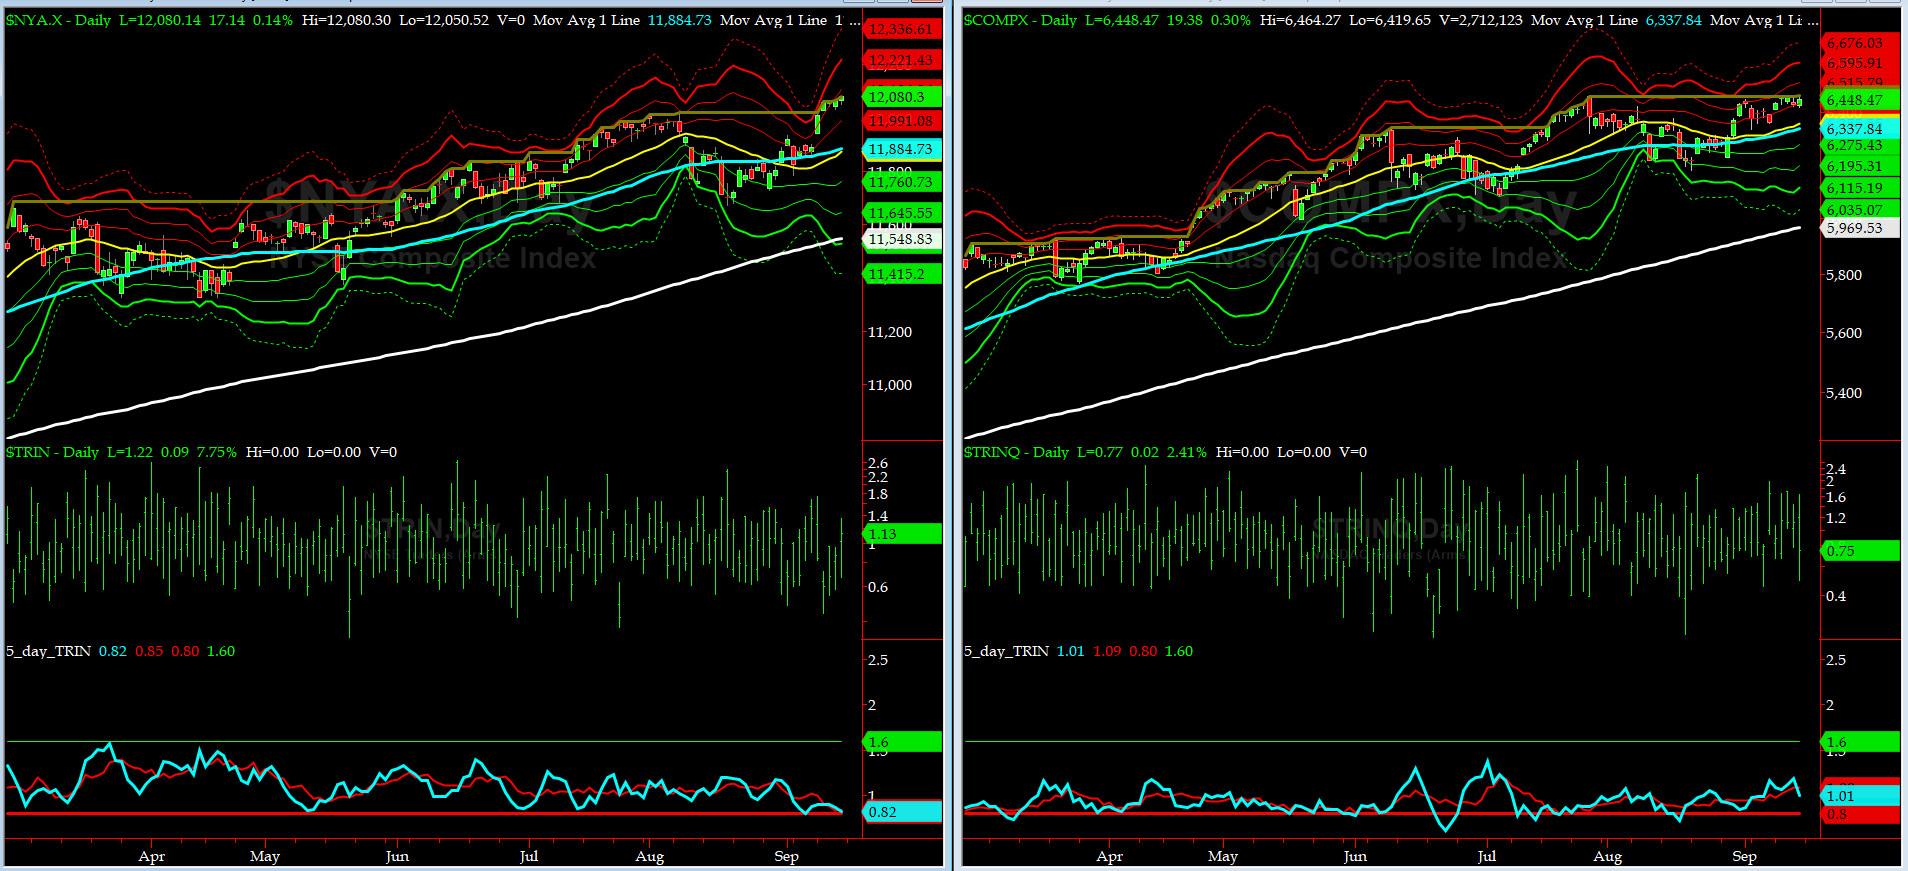
5-day TRIN & TRINQ Charts
NYSE 5-day TRIN is near its SELL Zone. No Signal here for NAZZ.
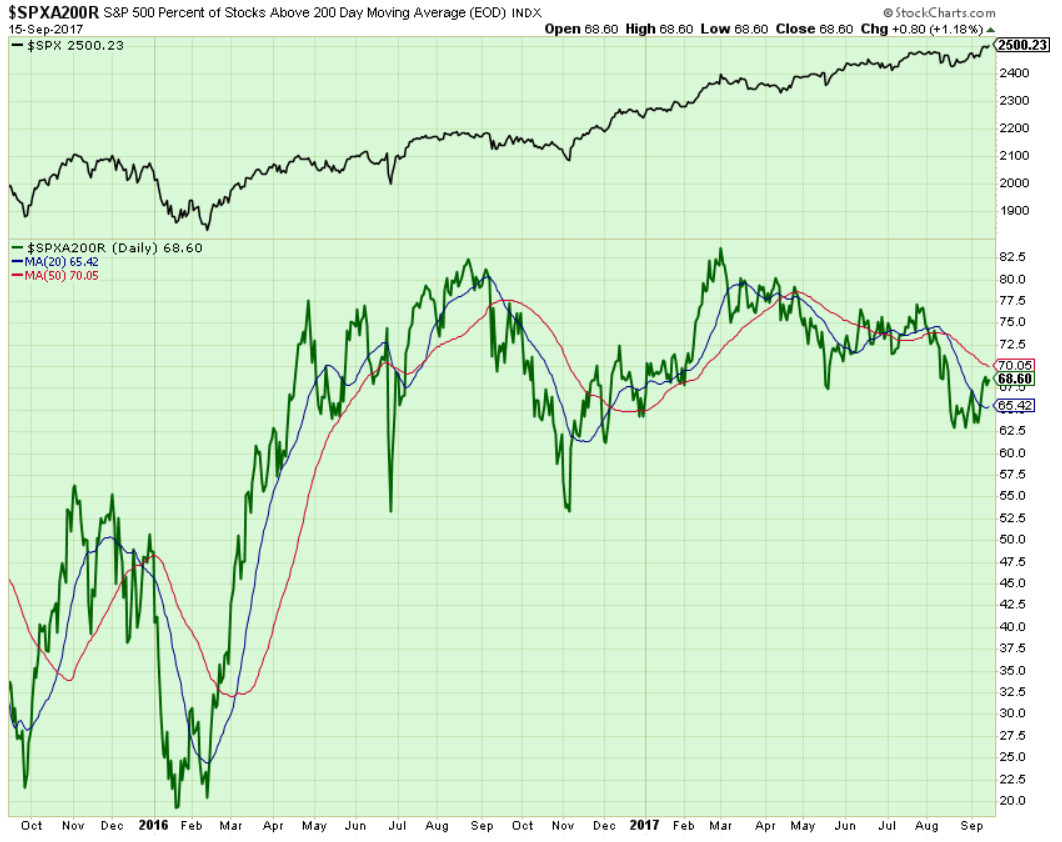
Components of SPX above their respective 200day MA Chart
During the past week, this scoring indicator shot up and test 69% level. Be aware of multiple divergences during CY2017 here.

SPX SKEW (Tail Risk) Chart
Last week SPX SKEW (Tail Risk) rose a tad to 144, or its +1.5 sigma (normal = 120-125, range 100-150).
Is all quiet on the Eastern & Mid-Western Fronts? Smart Money thinks NO.
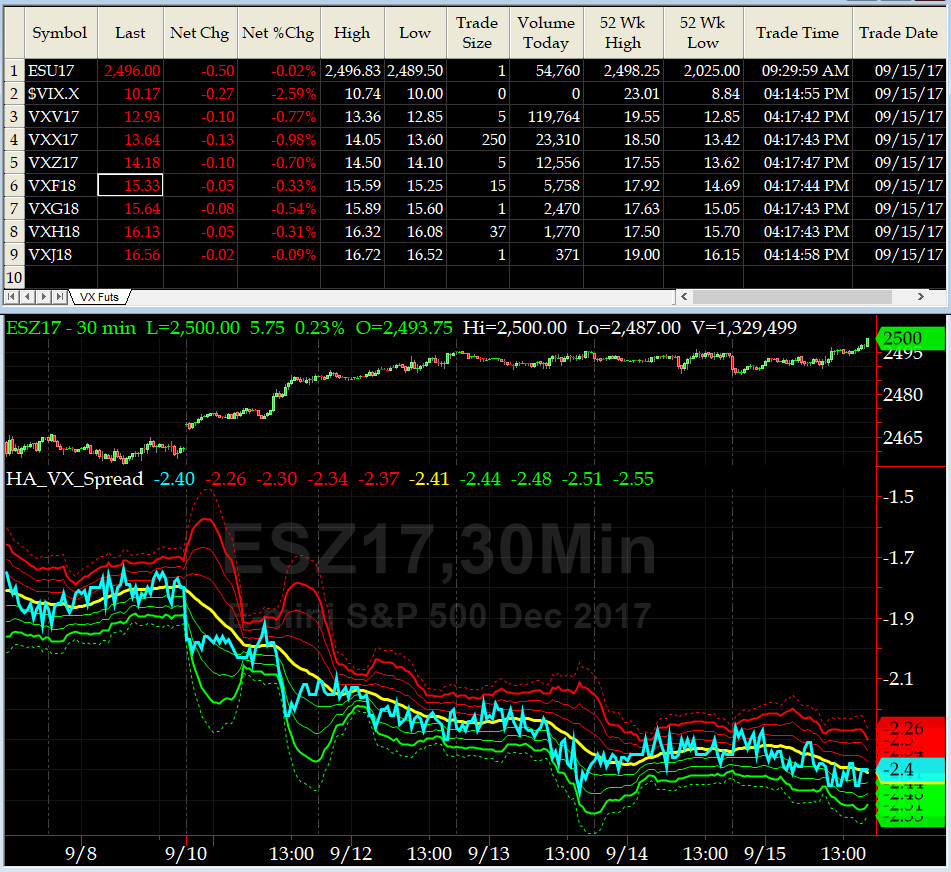
3-month VIX Futures Spread(VX) Chart
The Long OCT17, Short JAN18 Spread exhibited a shallow negative slope. The market is bid now.
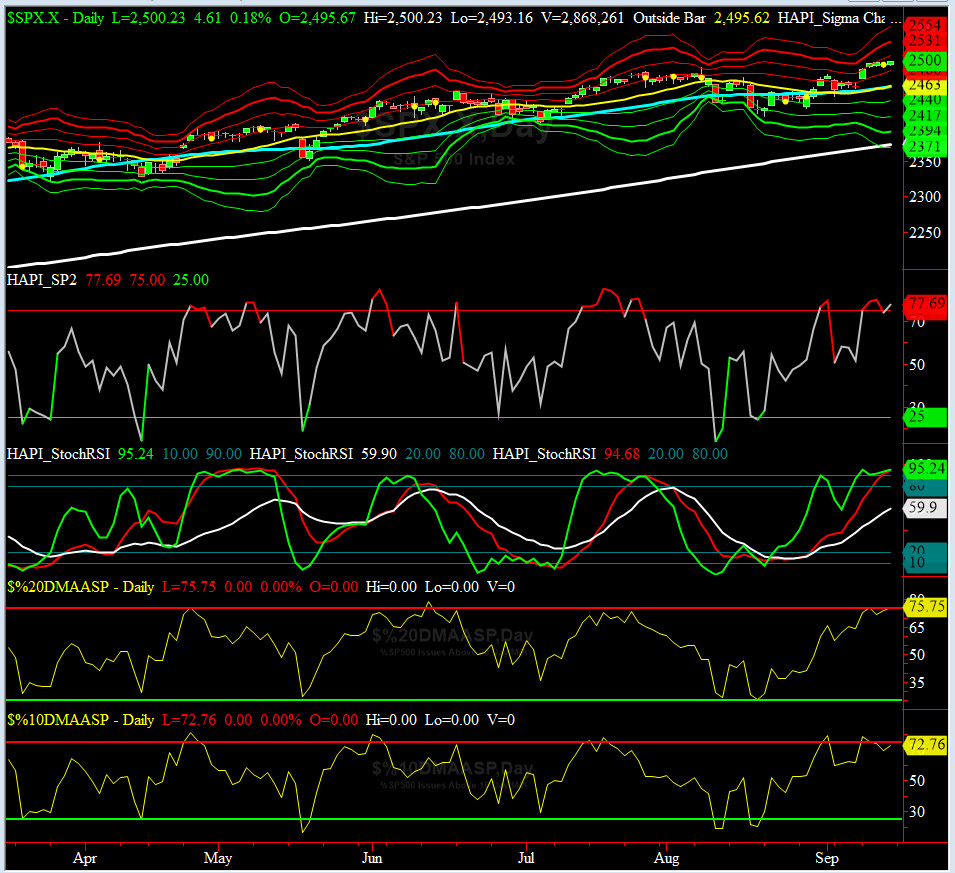
HA_SP2 Chart
HA_SP2 = 50.6 (Buy signal <= 25, Sell Signal >= 75)
Our favorite prop indicator rallied to 80.2 on Wednesday and then pulled back on Thursday. That is when we closed our Long SPY CallSpreads positions. Viva HA_SP2.
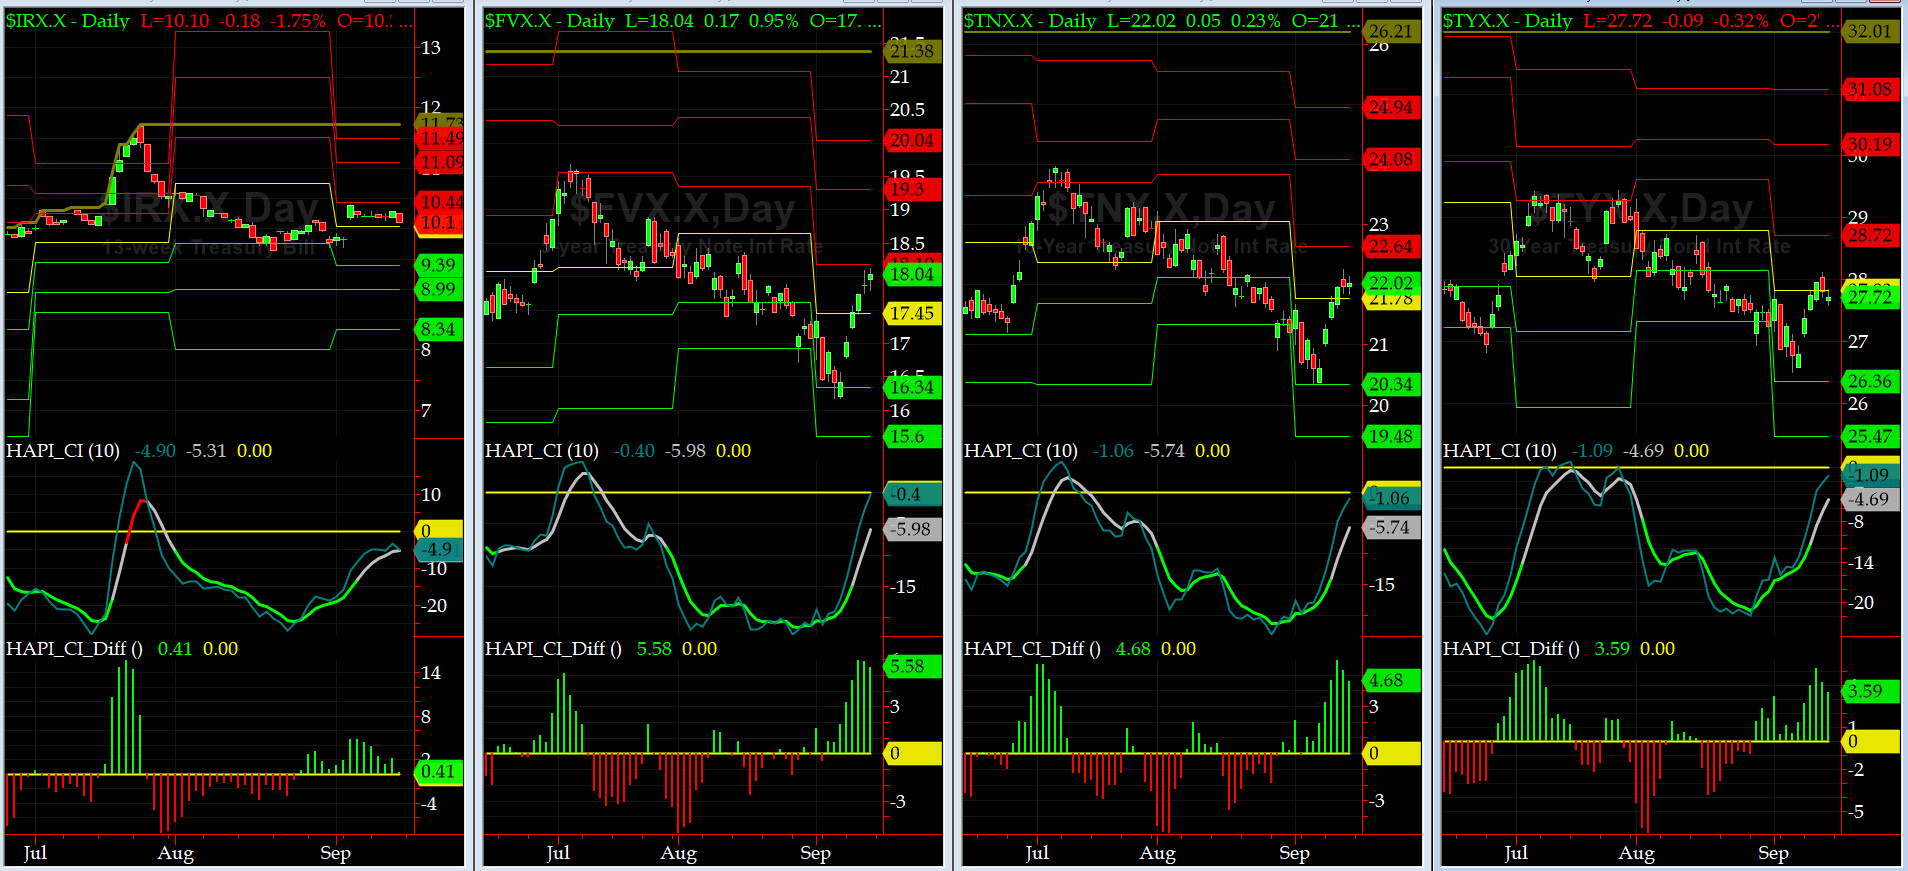
US Treasury T-Notes & T-Bonds Yields Chart
The Treasury Market sold off hard as YTMs for Notes & Bonds rallied. Front End of the Curve remained flat.
Fari Hamzei
|


 Proactive Market Timing