|
Sunday, September 24, 2017, 2345ET
Market Timing Charts, Analysis & Commentary for Issue #210
Timer Charts of S&P-500 Cash Index (SPX) + NASDAQ-100 Cash Index (NDX)
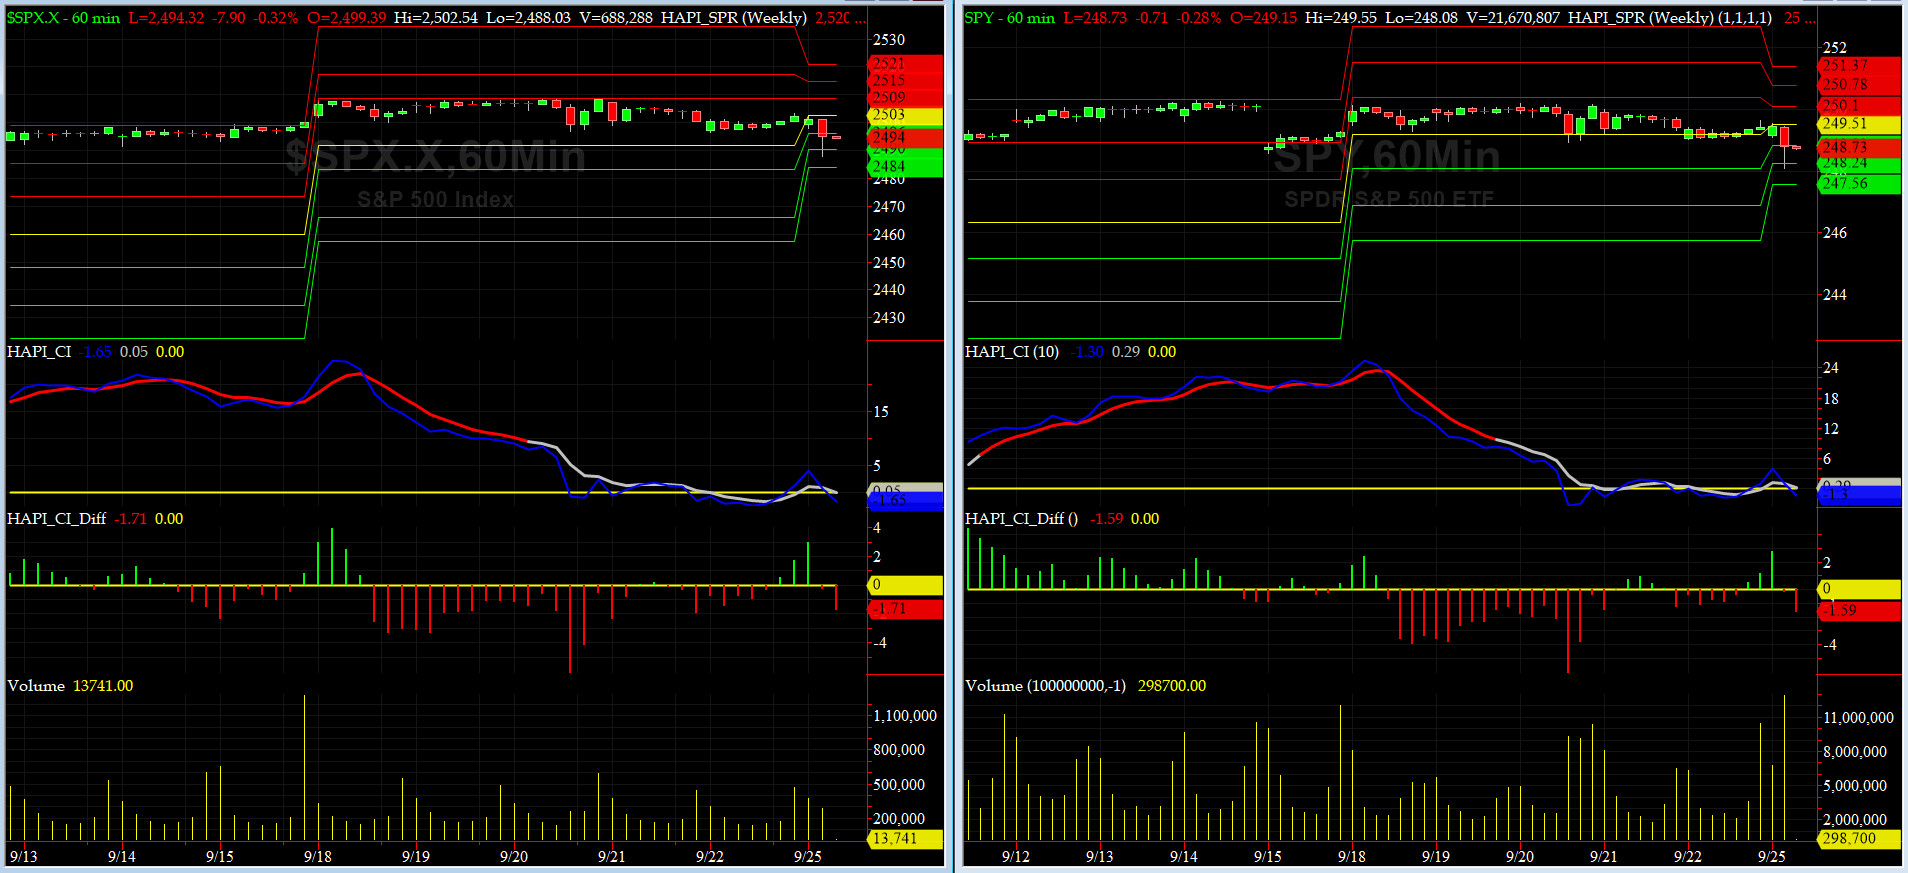
Most recent S&P-500 Cash Index (SPX): 2502.22 up +1.99 (up +0.08%) for the week ending on Friday, September 22, 2017, which closed just about its +1 sigma.
SPX ALL TIME INTRADAY HIGH = 2508.85 (reached on Wednesday, Sep 20, 2017)
SPX ALL TIME CLOSING HIGH = 2508.24 (reached on Wednesday, Sep 20, 2017)
Current DAILY +2 Sigma SPX = 2524 with WEEKLY +2 Sigma = 2508
Current DAILY 0 Sigma (20 day MA) SPX = 2479 with WEEKLY 0 Sigma = 2446
Current DAILY -2 Sigma SPX = 2435 with WEEKLY -2 Sigma = 2383
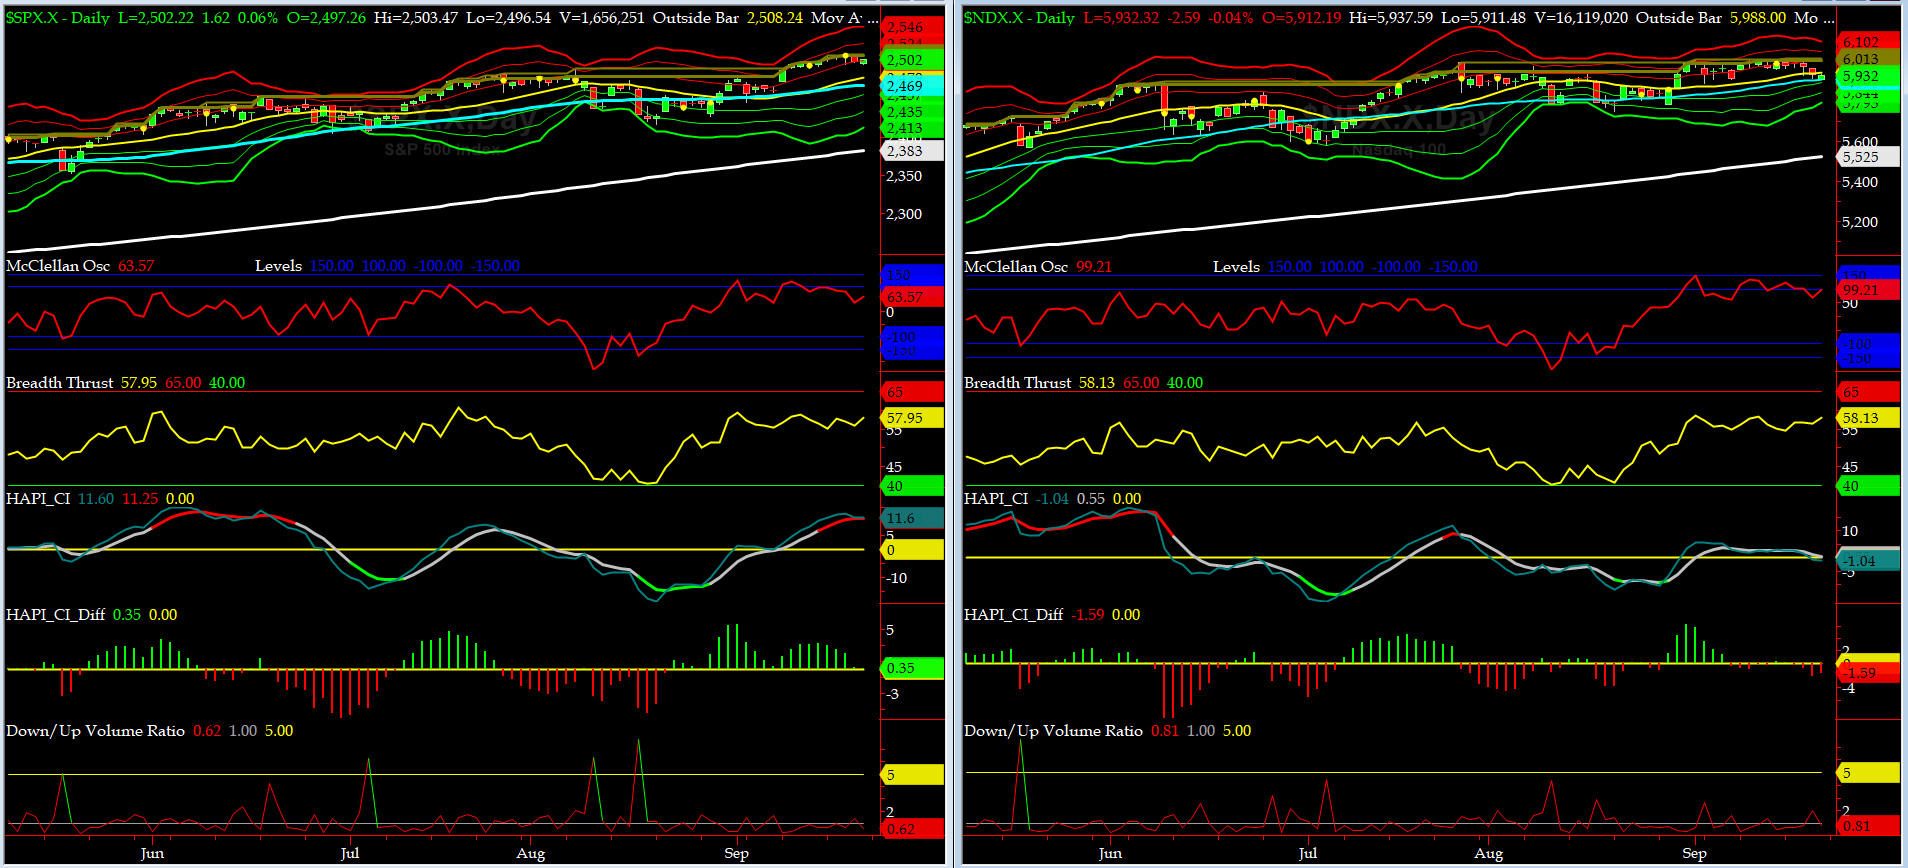
NYSE McClellan Oscillator = +64 (-150 is start of the O/S area; around -275 to -300 area or lower, we go into the �launch-pad� mode, over +150, we are in O/B area)
NYSE Breadth Thrust = 57.9 (40 is considered as oversold and 65 as overbought)
High Holidays are here and our markets are taking a pause. Seasonality says we should go down this week and rally next week. Happy New Year to our friends of Jewish Faith.
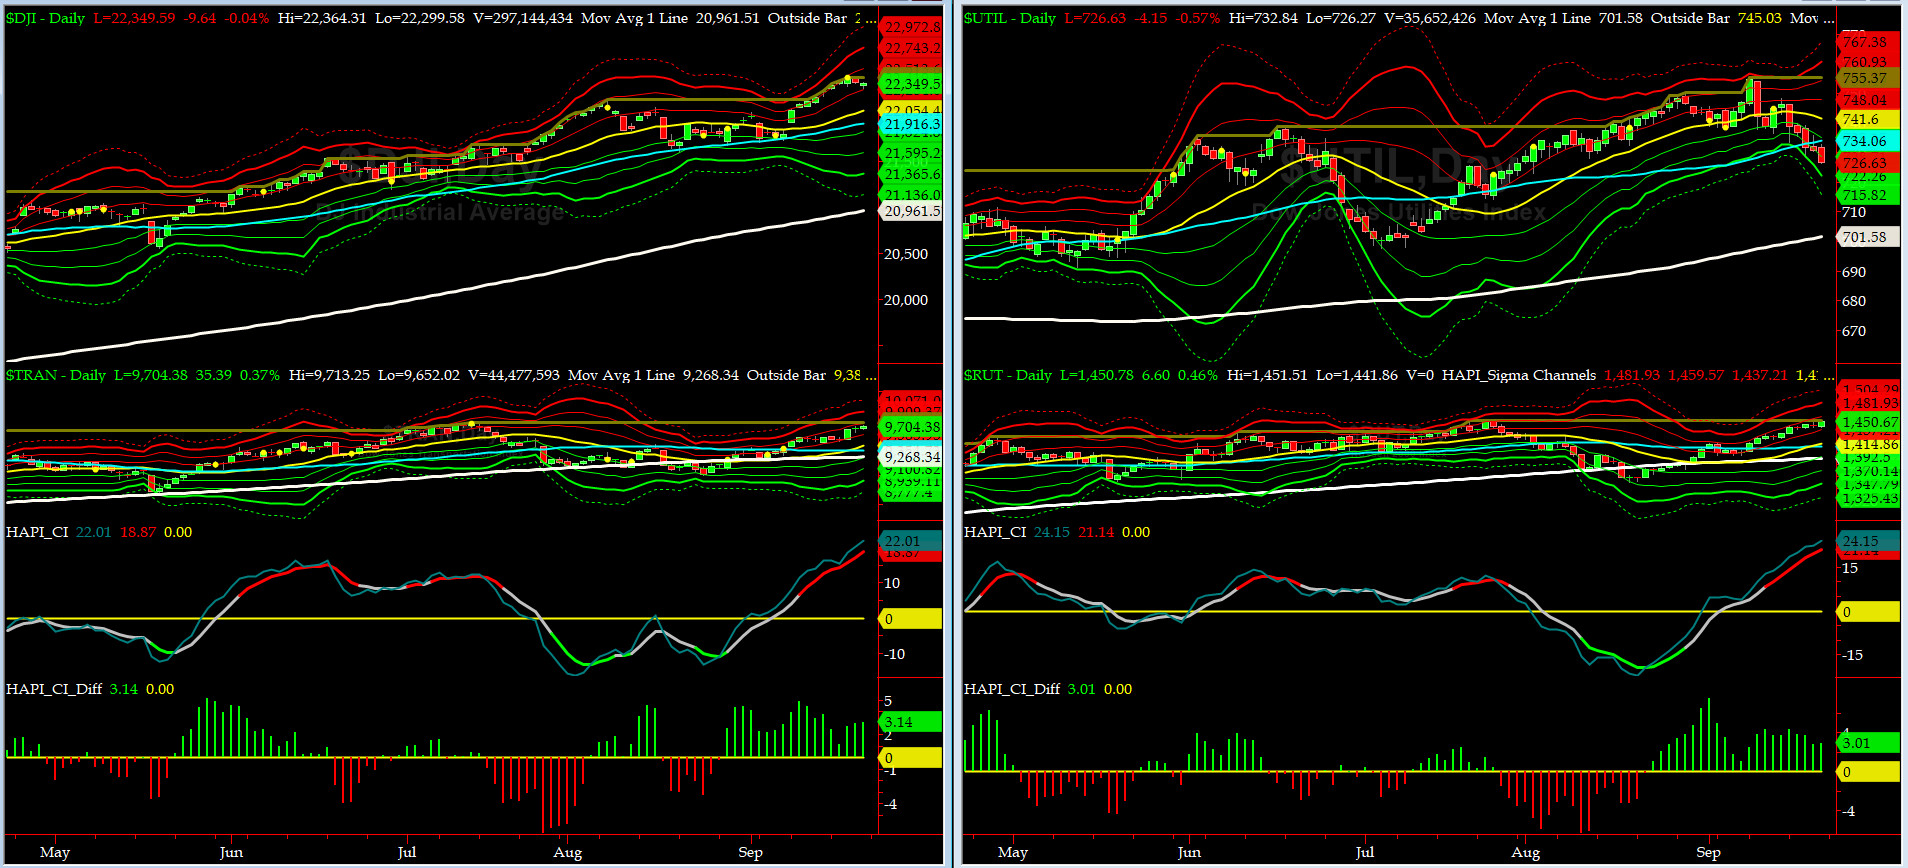
Canaries [in the Coal Mine] Chart for DJ TRAN & RUT Indices
200-Day MA DJ TRAN = 9268 or 4.7% above DJ TRAN (max observed in last 7 yrs = 20.2%, min = -20.3%)
200-Day MA RUT = 1390 or 4.4% above RUT (max observed in last 7 yrs = 21.3%, min = -22.6%)
DJ Transportation Index (proxy for economic conditions 6 to 9 months hence) is on a roar again. We love it.
Russell 2000 Small Caps Index (proxy for Risk ON/OFF) continued its strenght by shooting up further.... RISK is back ON.
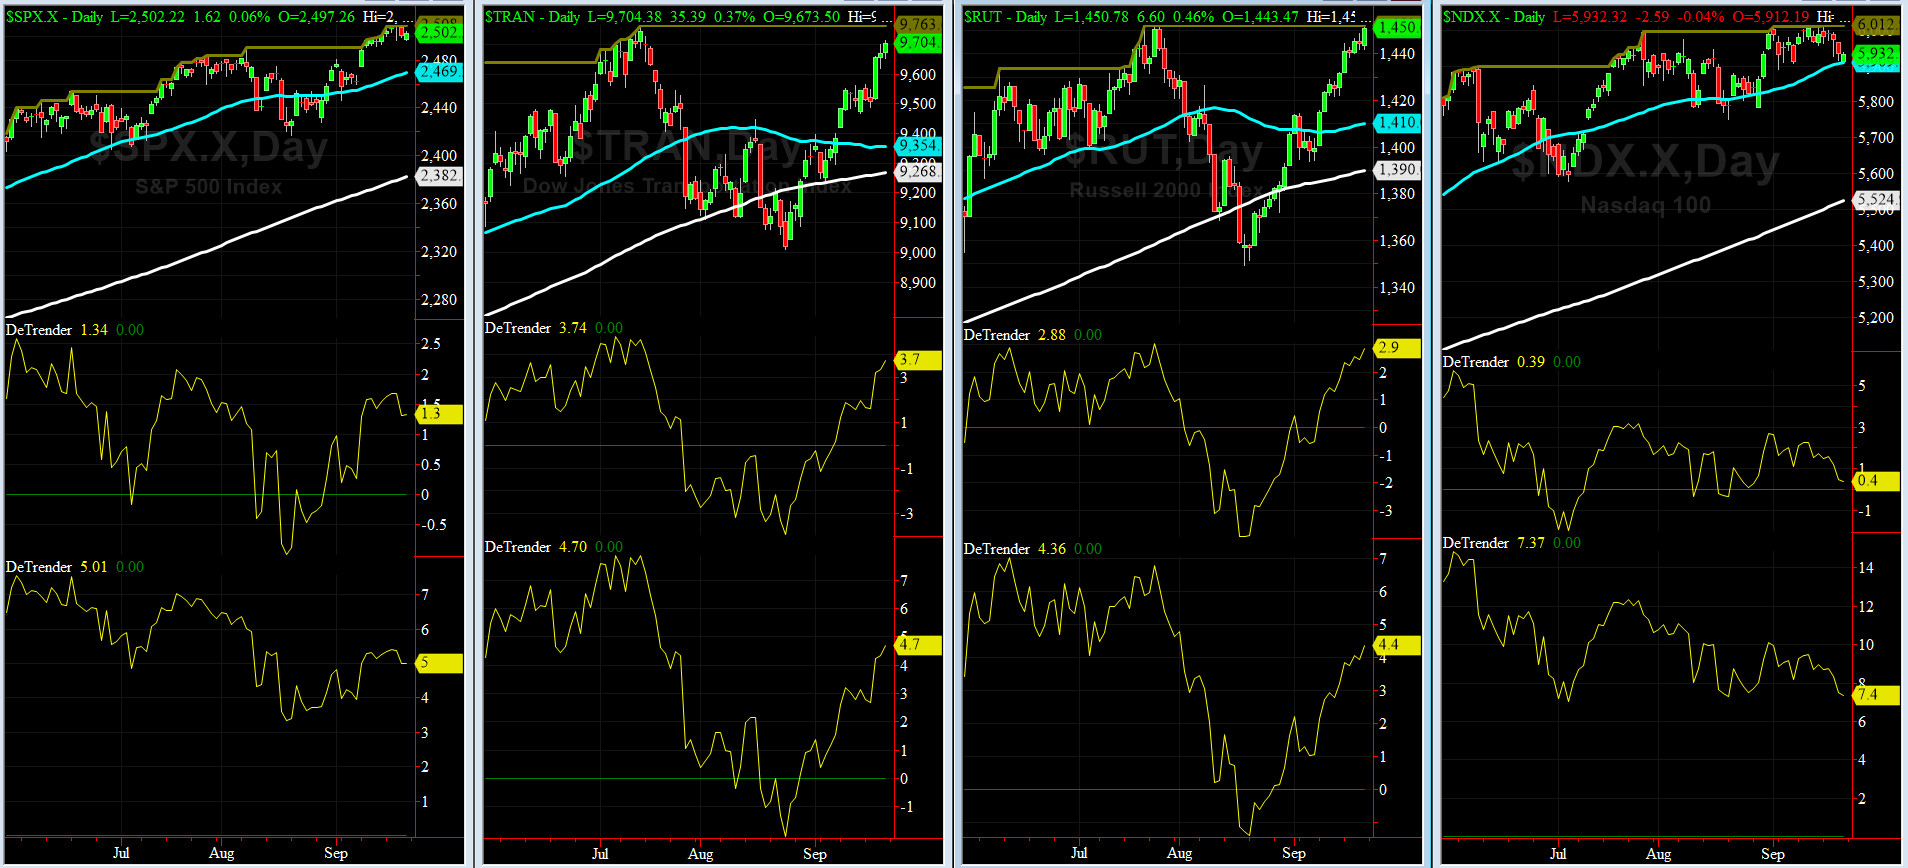
DeTrenders Charts for SPX, NDX, TRAN & RUT Indices
50-Day MA SPX = 2469 or 1.3% above SPX (max observed in last 7 yrs = +8.6%, min = -9.3%)
200-Day MA SPX = 2382 or 5% below SPX (max observed in last 7 yrs = 15.2%, min = -14%)
All of our EIGHT DeTrenders are POSITIVE while the DeTrenders for DJ Tran & RUT will continue to be harbingers of future price behavior in broad indices.
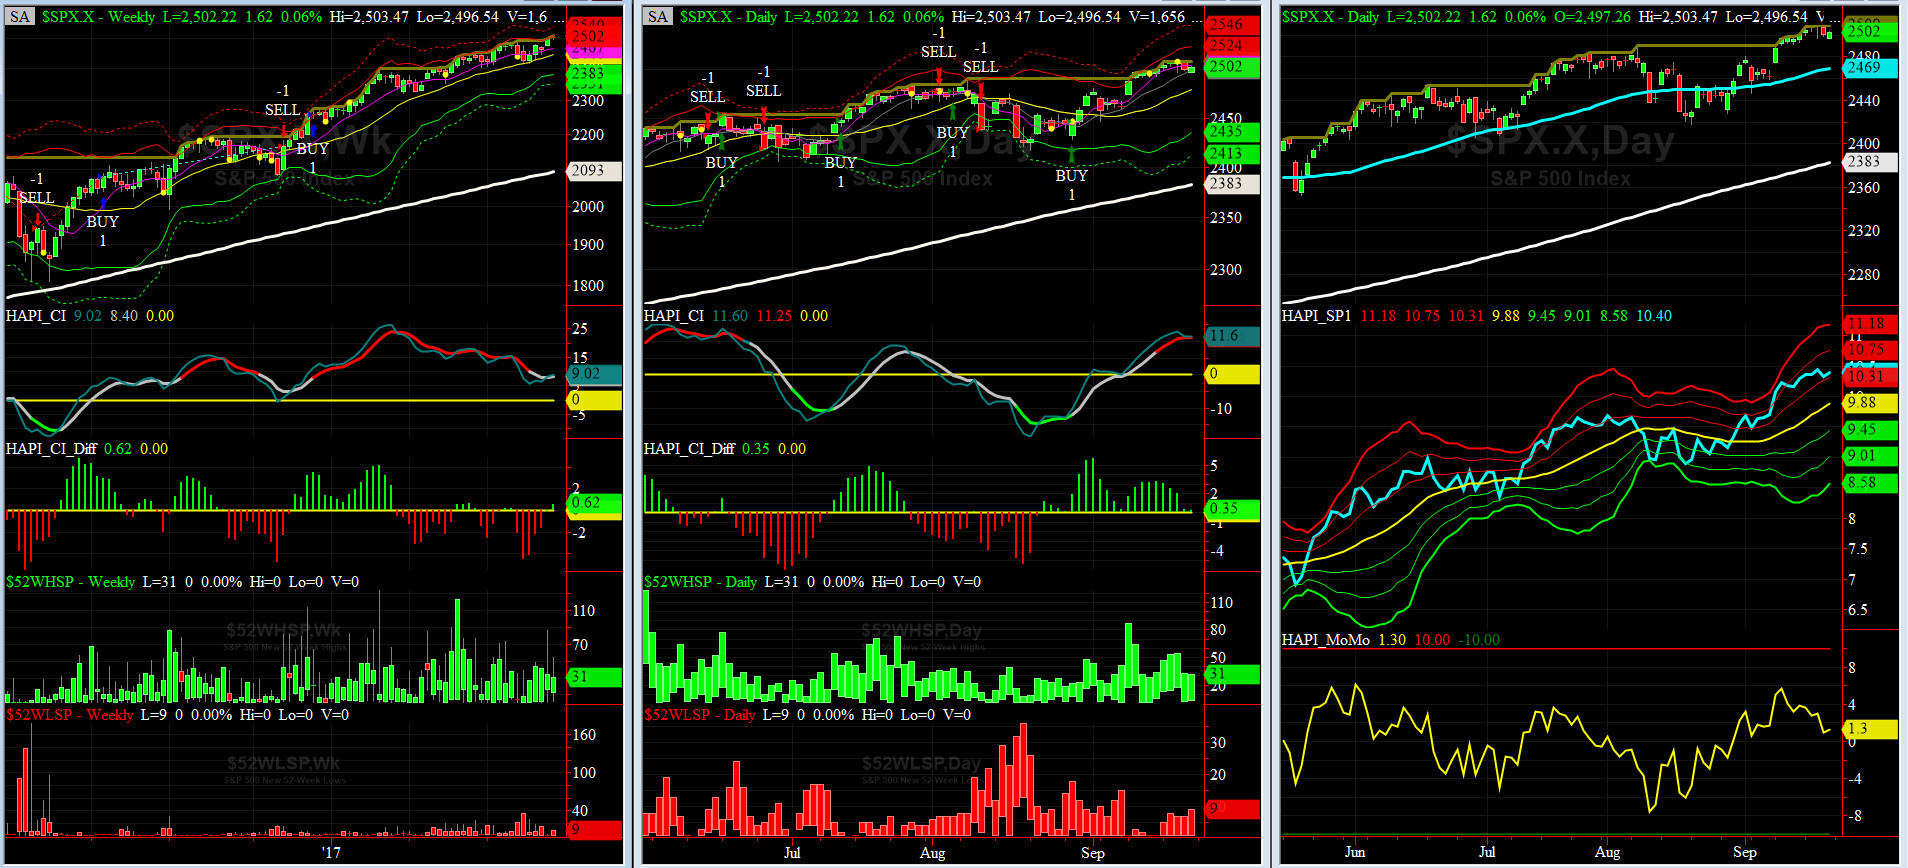
HA_SP1_Momo Chart
WEEKLY Timing Model = on a BUY Signal since Friday 12/16/16 CLOSE at 2258
DAILY Timing Model = on a BUY Signal since Tuesday 8/29/17 CLOSE at 2446
Max SPX 52wk-highs reading last week = 54 (over 120-140, the local maxima is in)
Max SPX 52wk-Lows reading last week = 9 (over 40-60, the local minima is in)
HA_SP1 closed near its +1 sigma channels
HA_Momo = +1.3 (reversals most likely occur above +10 or below -10)
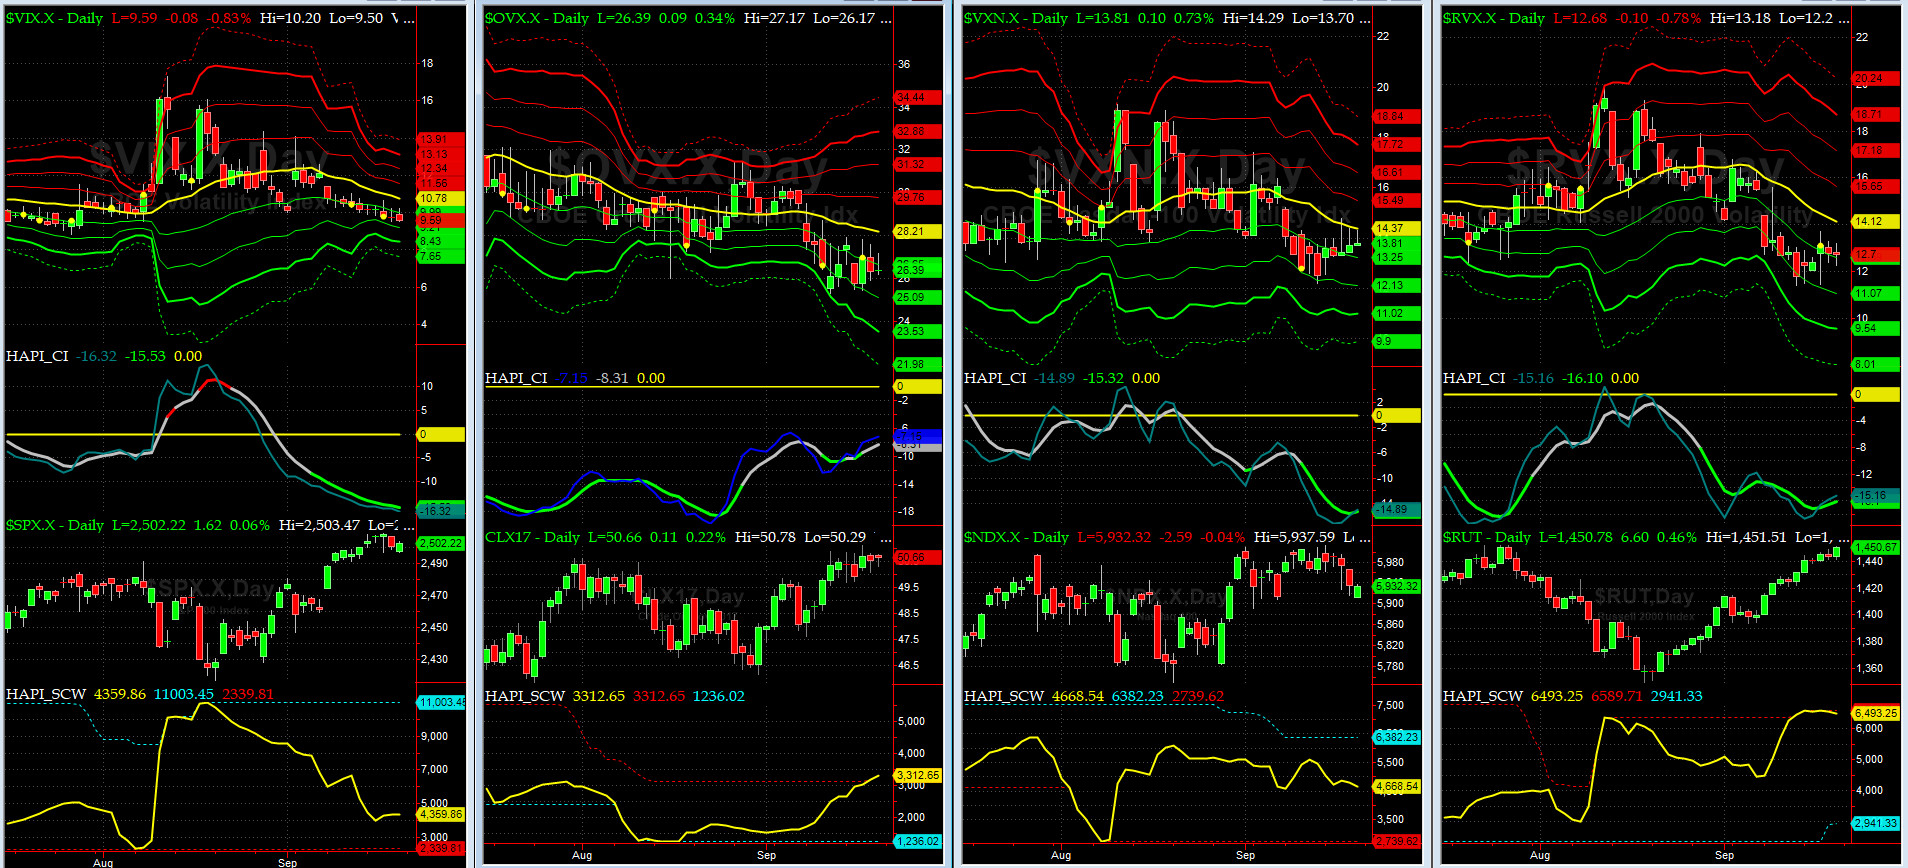
Vol of the Vols Chart
VIX currently stands at 9.59, or just below its -1 sigma (remember it's the VIX volatility pattern ( its sigma channels) that matters, and not the level of VIX itself (this is per Dr. Robert Whaley, a great mentor and inventor of original VIX, now called VXO ). VIX usually peaks around a test of its +4 sigma).
Last week, VIX managed to trade in 9 handle. FEAR is for Wimps.
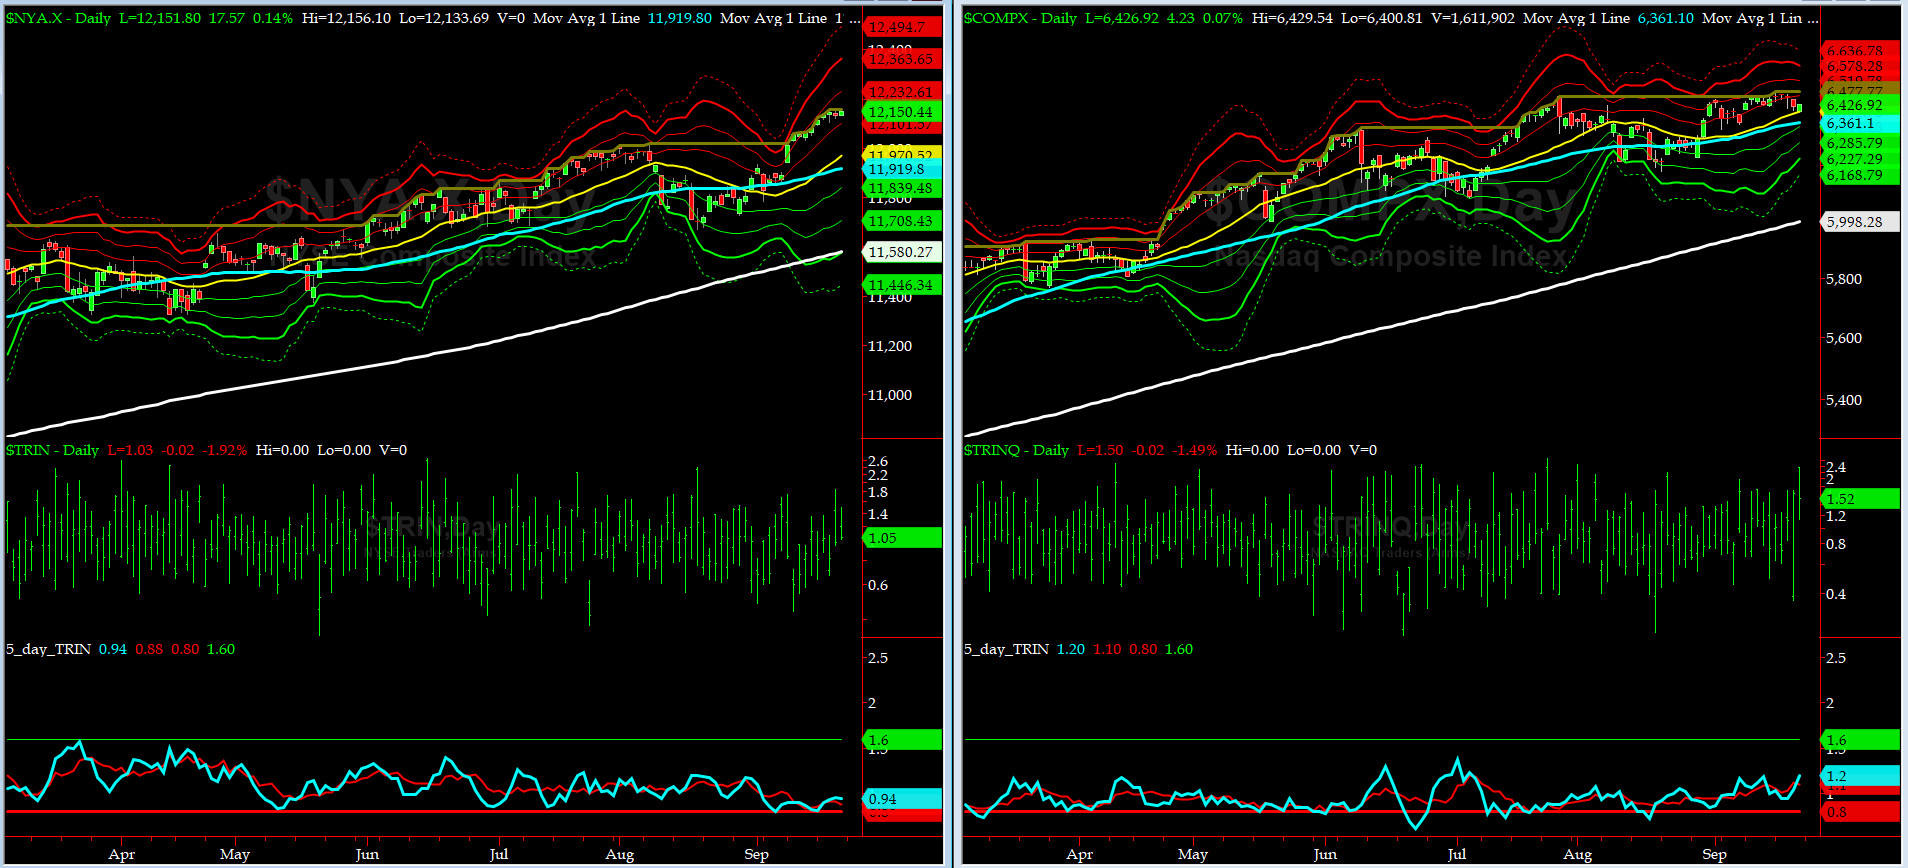
5-day TRIN & TRINQ Charts
NYSE 5-day TRIN is just above its SELL Zone. No Signal here for NAZZ TRINQ.
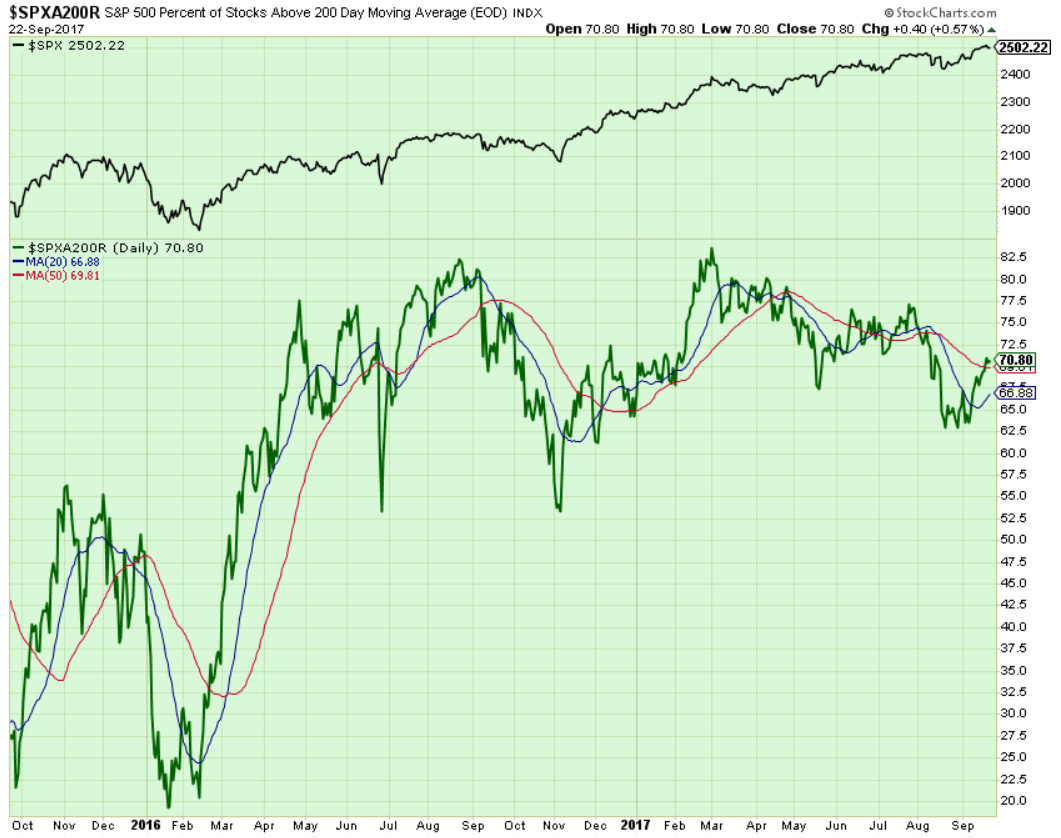
Components of SPX above their respective 200day MA Chart
During the past week, this scoring indicator rallied and test 70% level. We remind you to be aware of multiple divergences during CY2017.
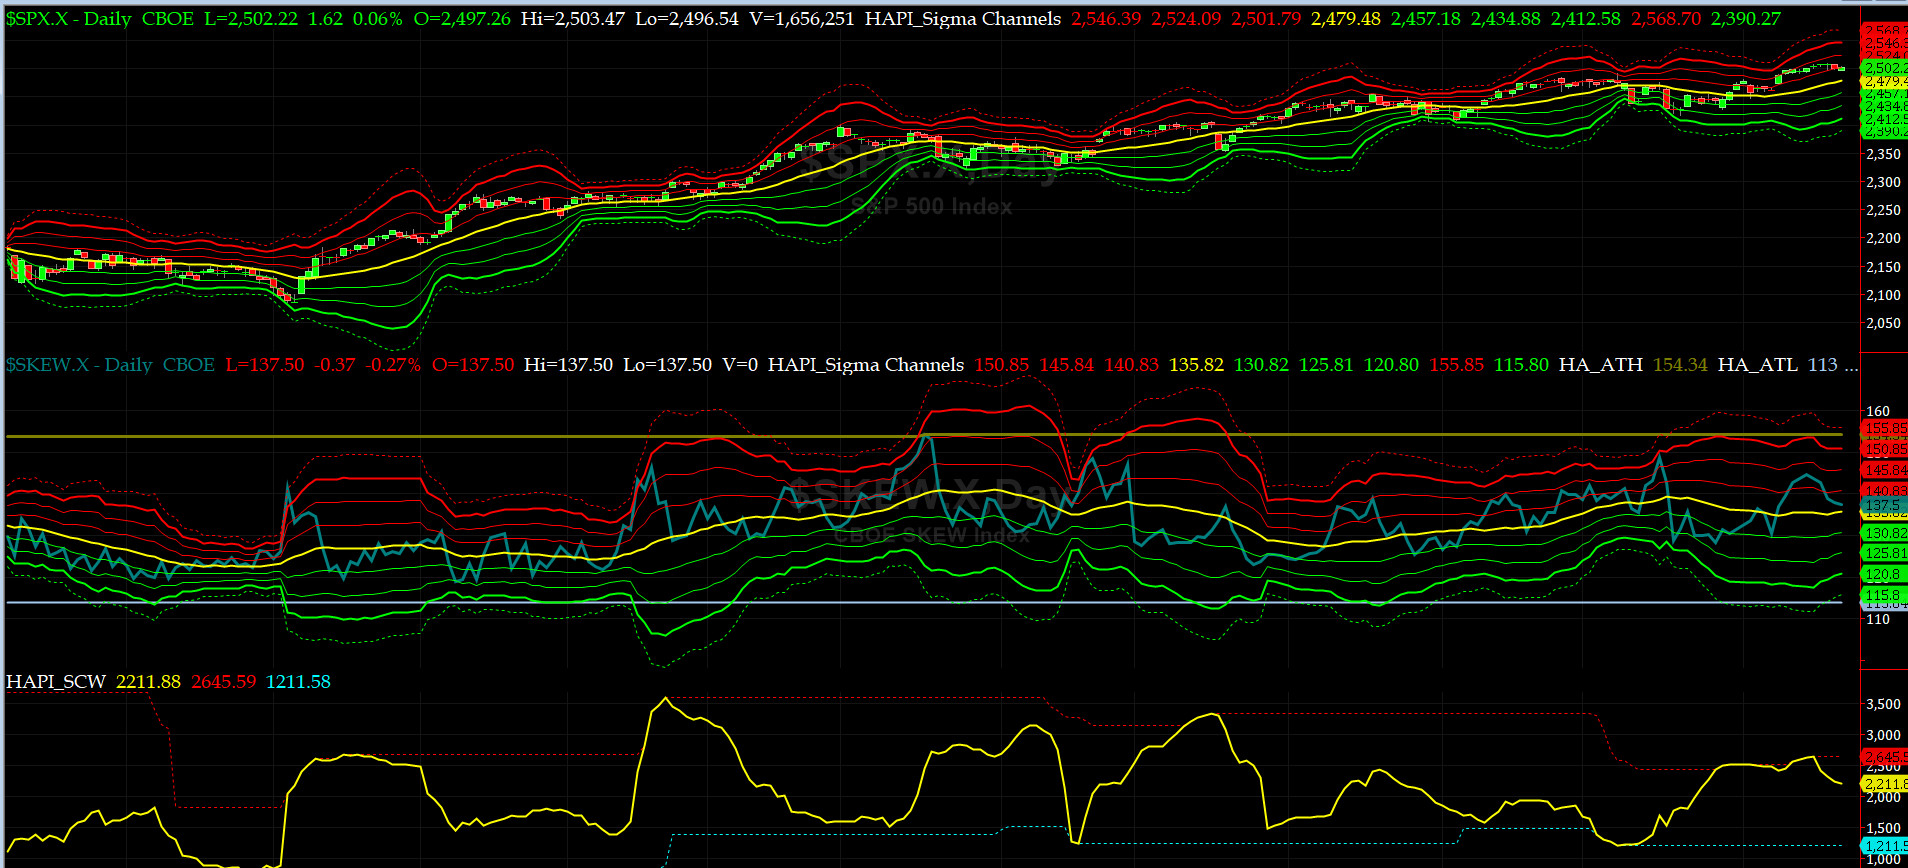
SPX SKEW (Tail Risk) Chart
Last week SPX SKEW (Tail Risk) came in lower to 137.5, or its zero sigma (normal = 120-125, range 100-150).
Is all quiet on the Eastern & Mid-Western Fronts? Smart Money thinks so.
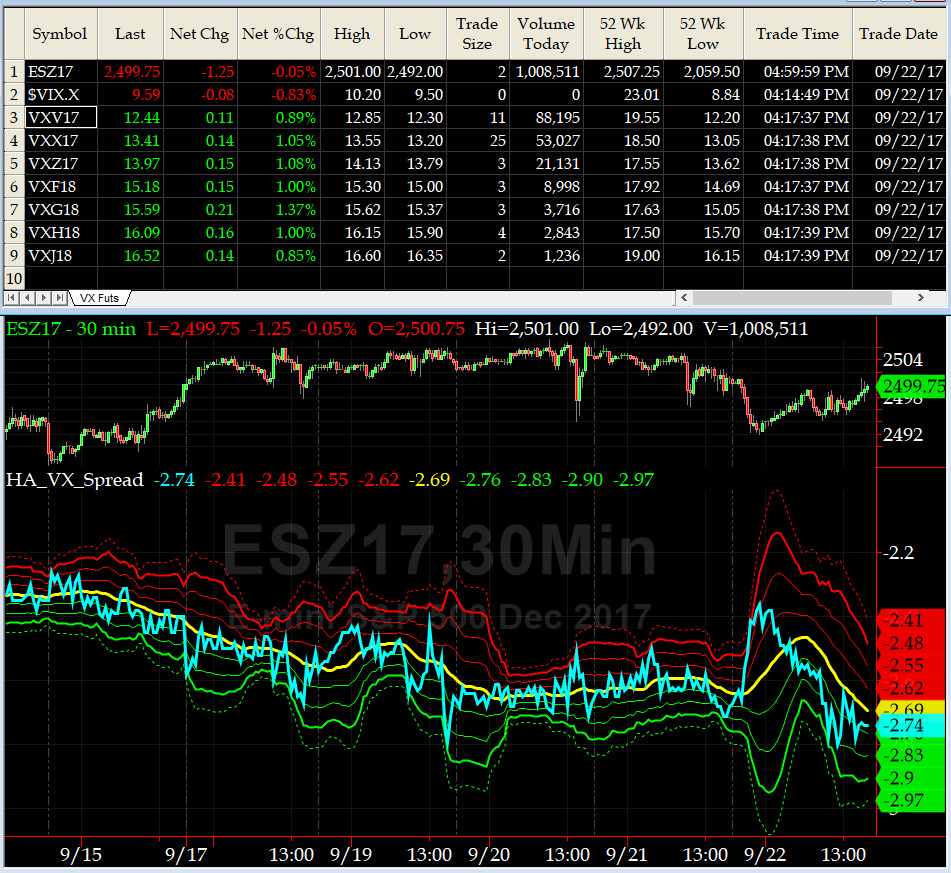
3-month VIX Futures Spread(VX) Chart
The Long OCT17, Short JAN18 Spread went sideways for most of the week and then rallied hard on Friday. The market lost its bid.
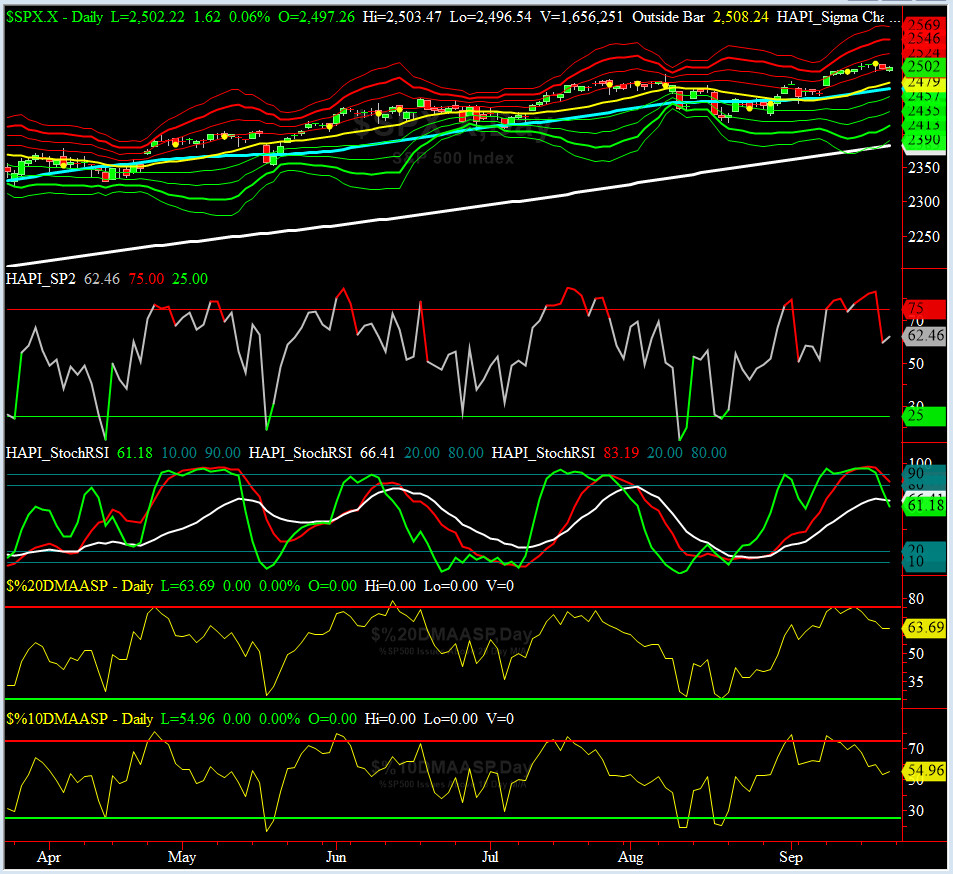
HA_SP2 Chart
HA_SP2 = 62.46 (Buy signal <= 25, Sell Signal >= 75)
Our favorite prop indicator rallied to 83.4 on Wednesday and then pulled back hard on Thursday.
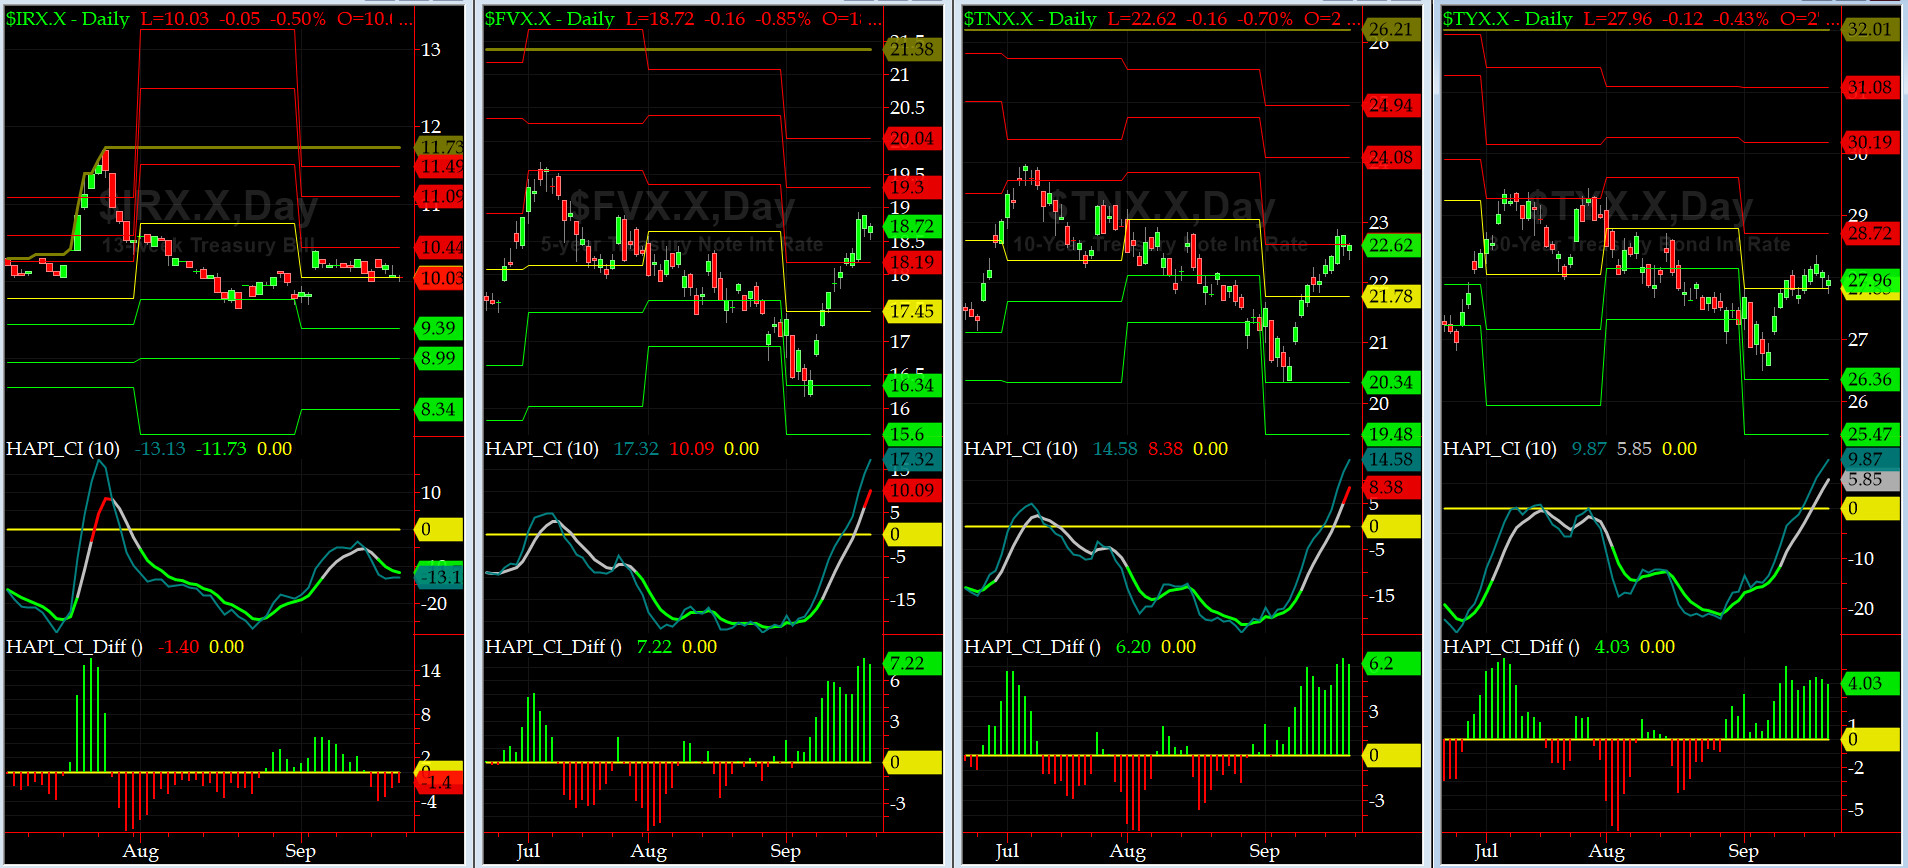
US Treasury T-Notes & T-Bonds Yields Chart
Our Treasury Market sold off as YTMs for Notes & Bonds rose a tad. Again the front end of the Curve remained flat.
Fari Hamzei
|


 Proactive Market Timing