|
Monday, October 9, 2017, 2345ET
Market Timing Charts, Analysis & Commentary for Issue #212

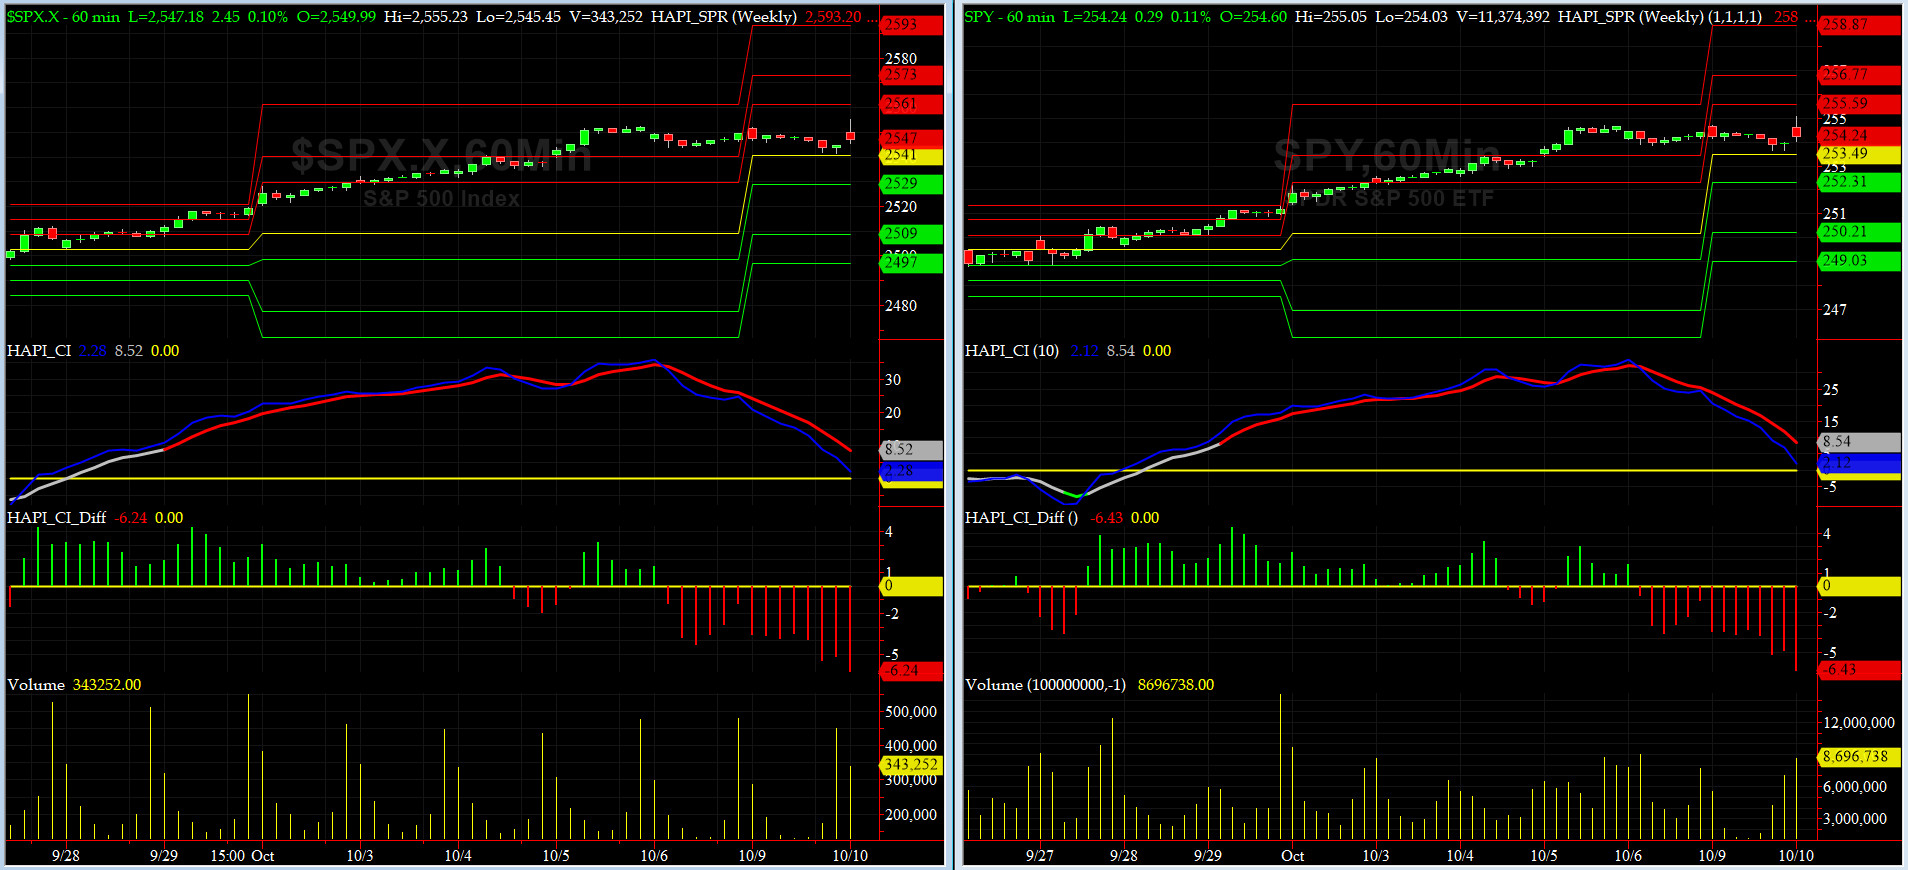
Timer Charts of S&P-500 Cash Index (SPX) + NASDAQ-100 Cash Index (NDX)
Most recent S&P-500 Cash Index (SPX): 2554.73 up +35.36 (up +1.4%) for six trading days ending on Monday, October 9, 2017, which closed just about its +1 sigma.
SPX ALL TIME INTRADAY HIGH = 2552.51 (reached on Thursday, Oct 5, 2017)
SPX ALL TIME CLOSING HIGH = 2552.07 (reached on Thursday, Oct 5, 2017)
Current DAILY +2 Sigma SPX = 2552 with WEEKLY +2 Sigma = 2543
Current DAILY 0 Sigma (20 day MA) SPX = 2514 with WEEKLY 0 Sigma = 2467
Current DAILY -2 Sigma SPX = 2477 with WEEKLY -2 Sigma = 2391
NYSE McClellan Oscillator = -17 (-150 is start of the O/S area; around -275 to -300 area or lower, we go into the �launch-pad� mode, over +150, we are in O/B area)
NYSE Breadth Thrust = 54 (40 is considered as oversold and 65 as overbought)
Shorting this market is not easy. This could be our last try in CY 2017.
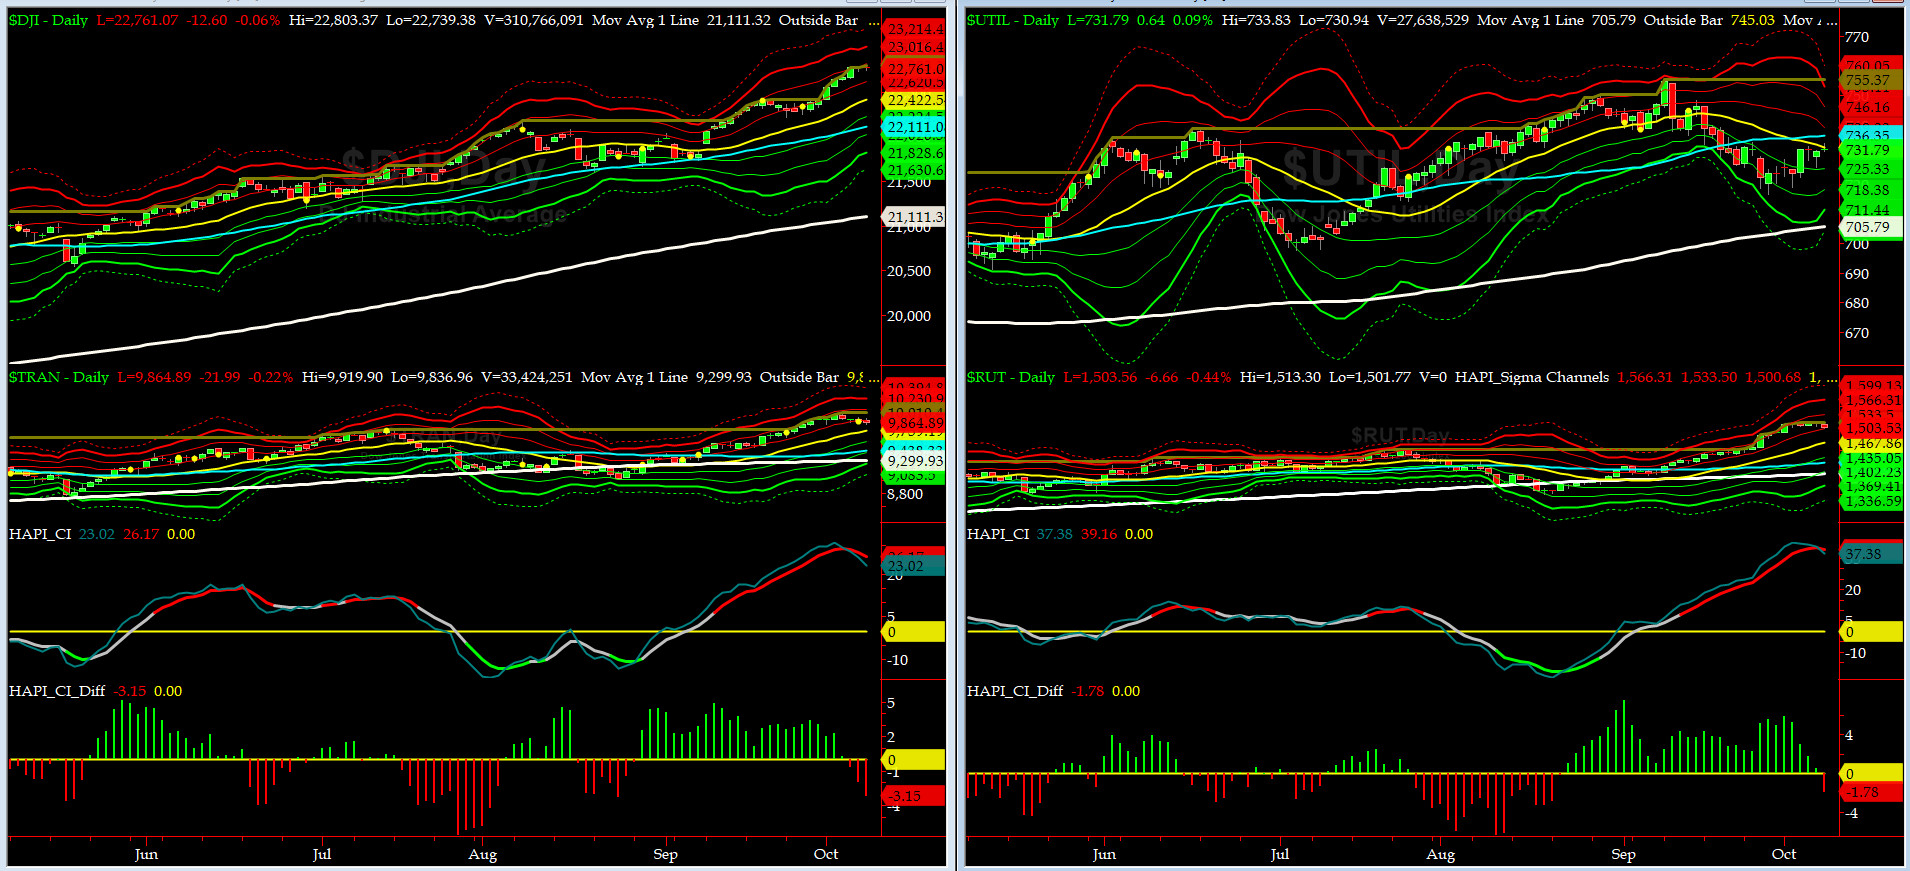
Canaries [in the Coal Mine] Chart for DJ TRAN & RUT Indices
200-Day MA DJ TRAN = 9299 or 6.1% above DJ TRAN (max observed in last 7 yrs = 20.2%, min = -20.3%)
200-Day MA RUT = 1396 or 7.6% above RUT (max observed in last 7 yrs = 21.3%, min = -22.6%)
DJ Transportation Index (proxy for economic conditions 6 to 9 months hence) pulled back last Wednesday and failed to make a new high on Thursday (SPX ATH).
Russell 2000 Small Caps Index (proxy for Risk ON/OFF) still shows strength .... RISK is ON, for now.
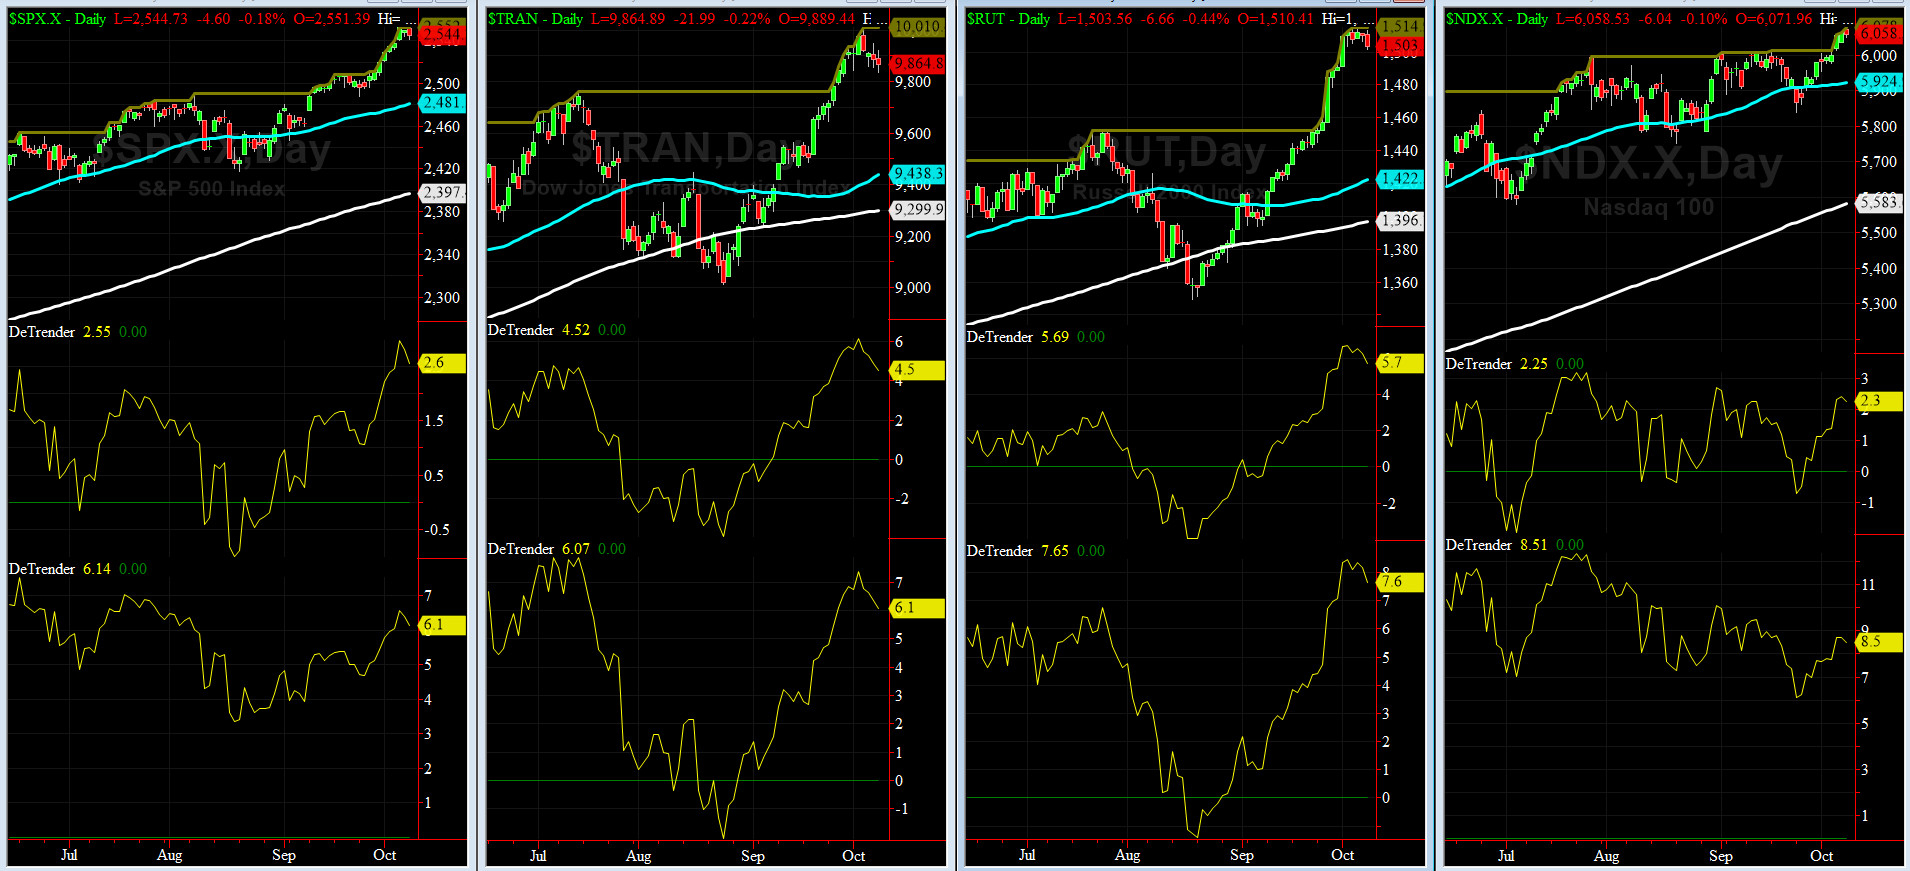
DeTrenders Charts for SPX, NDX, TRAN & RUT Indices
50-Day MA SPX = 2481 or 2.6% below SPX (max observed in last 7 yrs = +8.6%, min = -9.3%)
200-Day MA SPX = 2397 or 6.1% below SPX (max observed in last 7 yrs = 15.2%, min = -14%)
All of our EIGHT DeTrenders are continue to remain POSITIVE while the DeTrenders for DJ Tran & RUT will continue to be harbingers of future price behavior in broad indices.
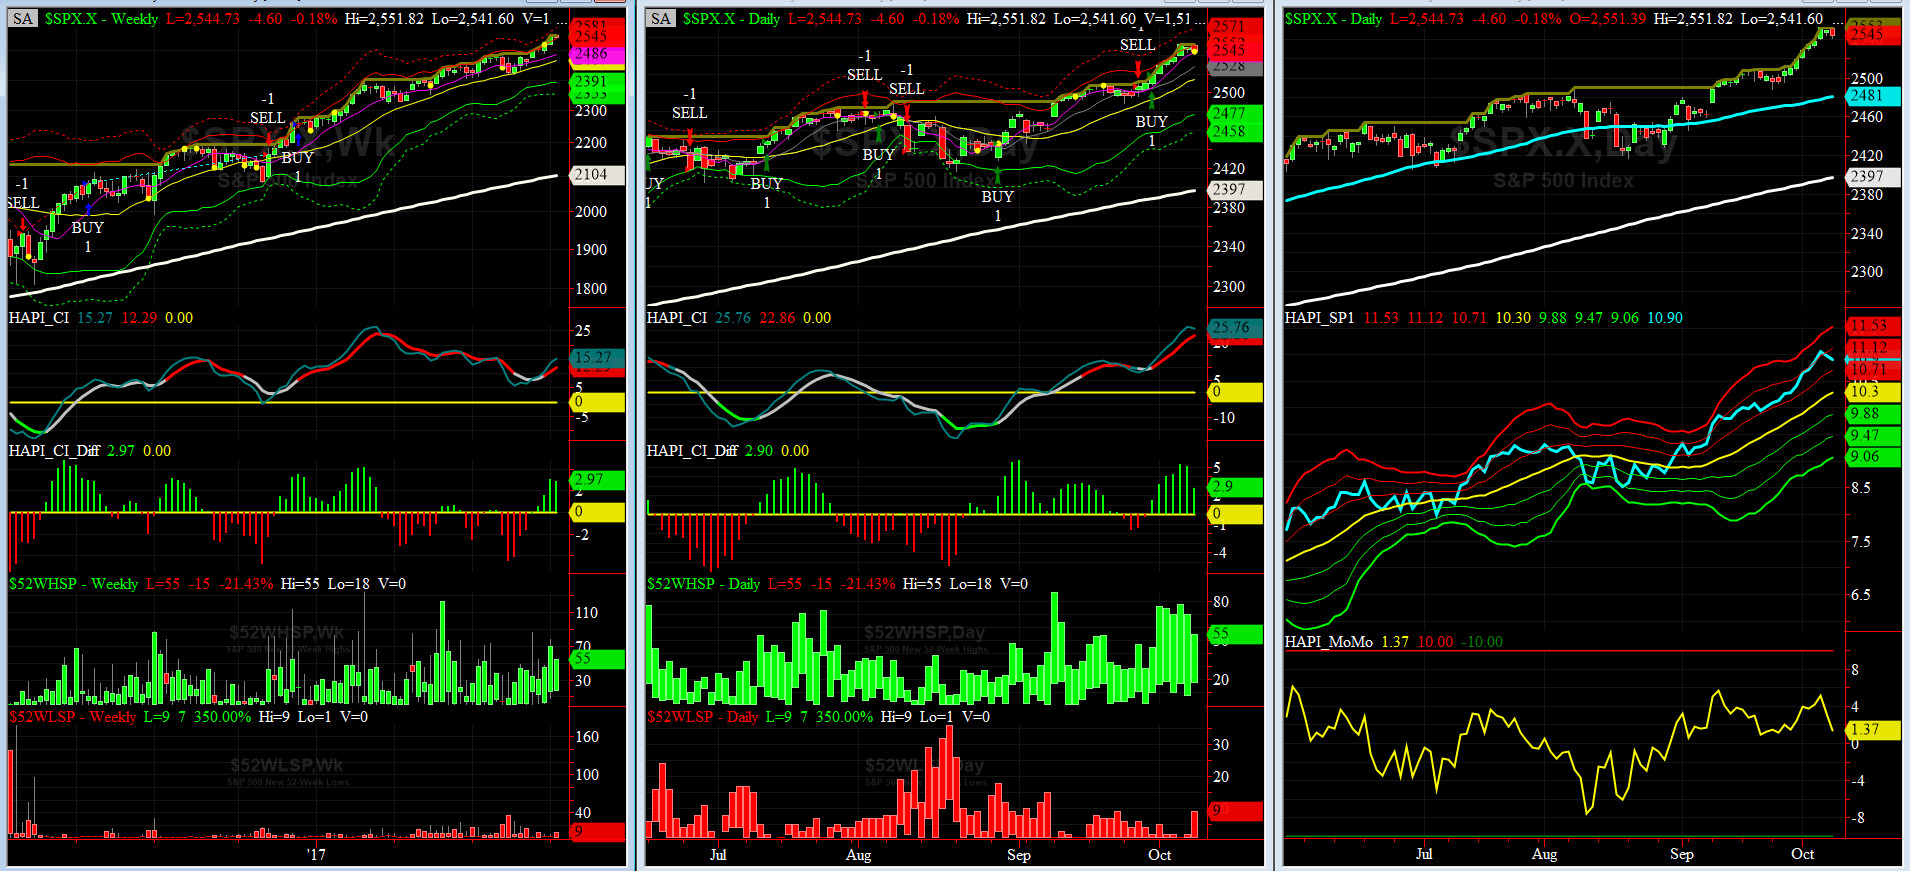
HA_SP1_Momo Chart
WEEKLY Timing Model = on a BUY Signal since Friday 12/16/16 CLOSE at 2258
DAILY Timing Model = on a BUY Signal since Friday 9/29/17 CLOSE at 2519
Max SPX 52wk-highs reading last week = 78 (over 120-140, the local maxima is in)
Max SPX 52wk-Lows reading last week = 5 (over 40-60, the local minima is in)
HA_SP1 closed near its +1.5 sigma channels
HA_Momo = +1.4 (reversals most likely occur above +10 or below -10)
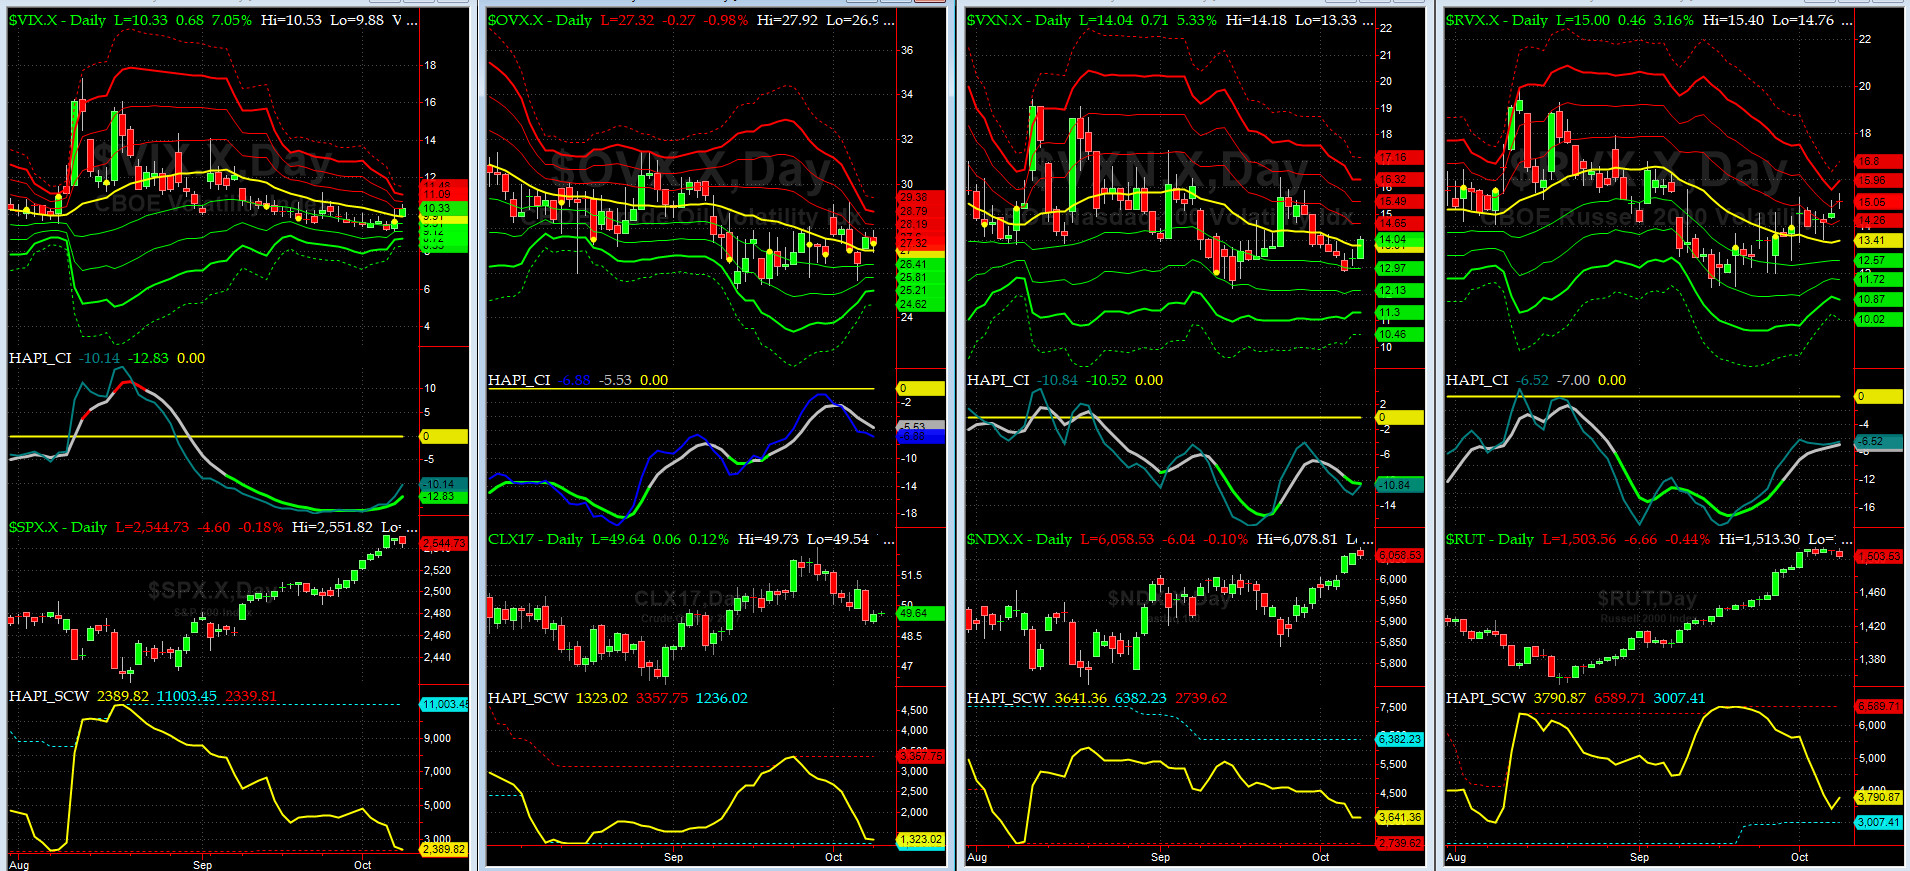
Vol of the Vols Chart
VIX currently stands at 10.33, right at its +1 sigma (remember it's the VIX volatility pattern ( its sigma channels) that matters, and not the level of VIX itself (this is per Dr. Robert Whaley, a great mentor and inventor of original VIX, now called VXO ). VIX usually peaks around a test of its +4 sigma).
Last week, VIX continued to trade in 9 handle and then it bumped up a tad on Monday.

5-day TRIN & TRINQ Charts
Both NYSE & NASDAQ 5-day TRINs are in SELL Zone.
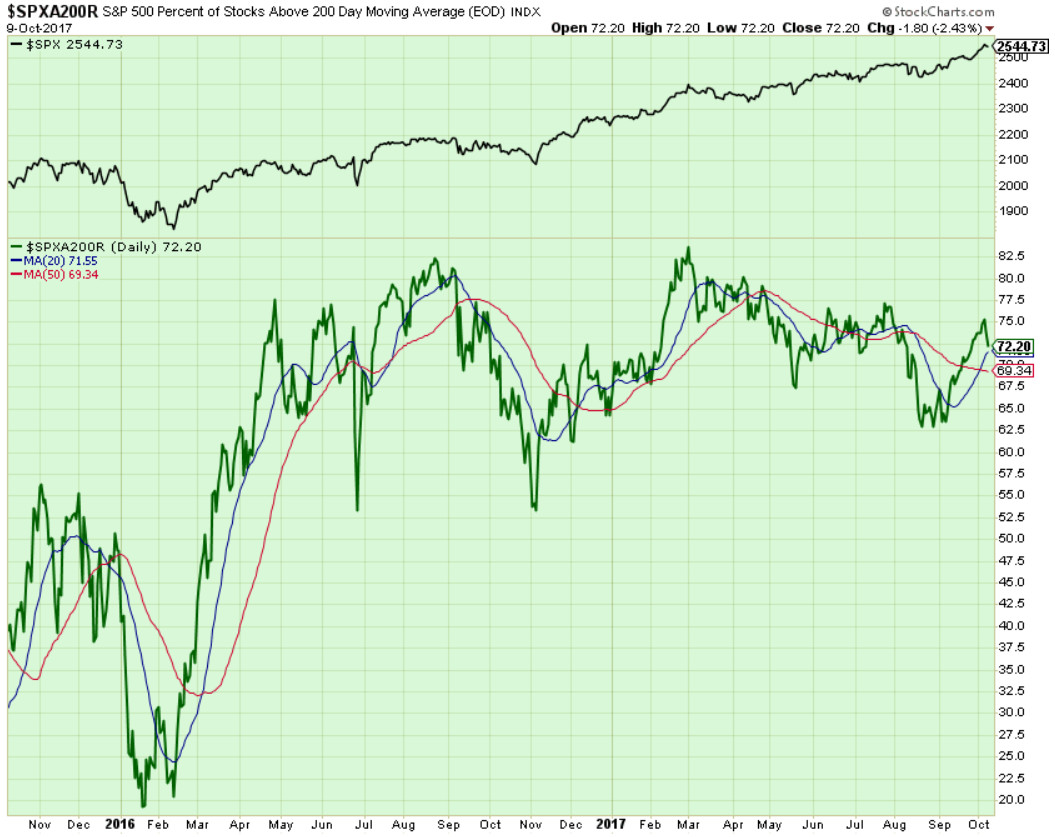
Components of SPX above their respective 200day MA Chart
During the past week, this scoring indicator dropped off hard after testing 75% level. One must be aware of multiple divergences between this indicator and SPX.
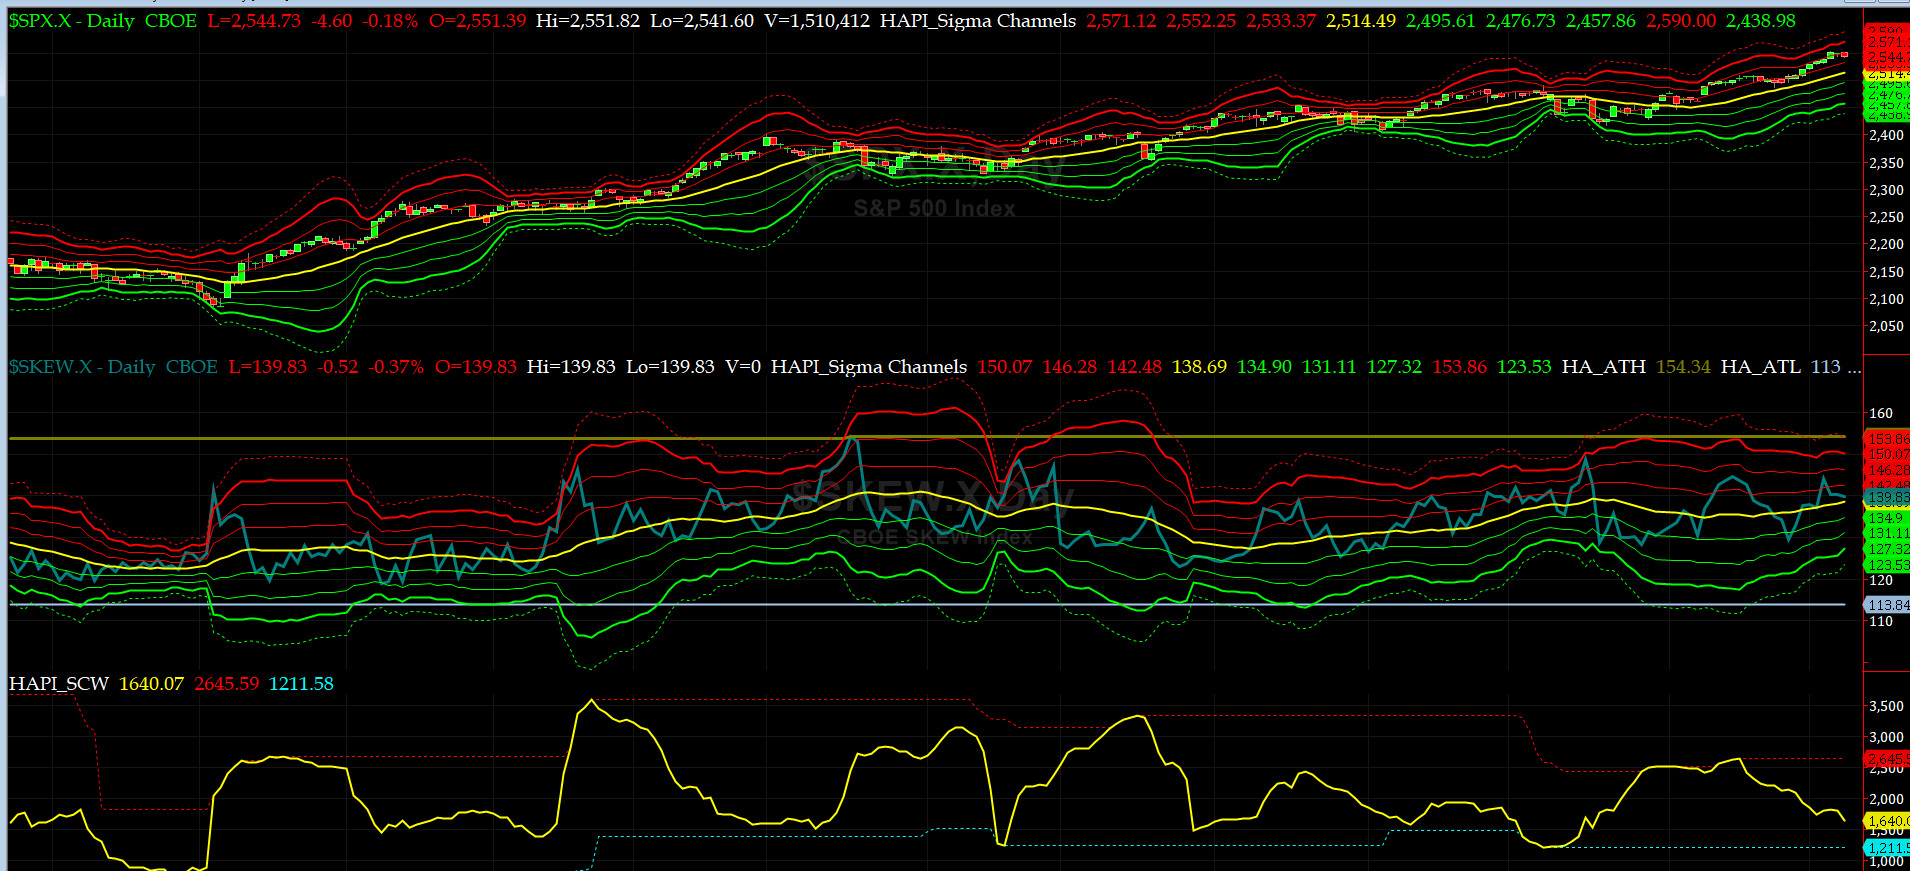
SPX SKEW (Tail Risk) Chart
Last week SPX SKEW (Tail Risk) jumped and then came back down to close at 140, or its zero sigma (normal = 120-125, range 100-150).
Is all quiet on the Eastern & Mid-Western Fronts? Smart Money is slightly not sure.
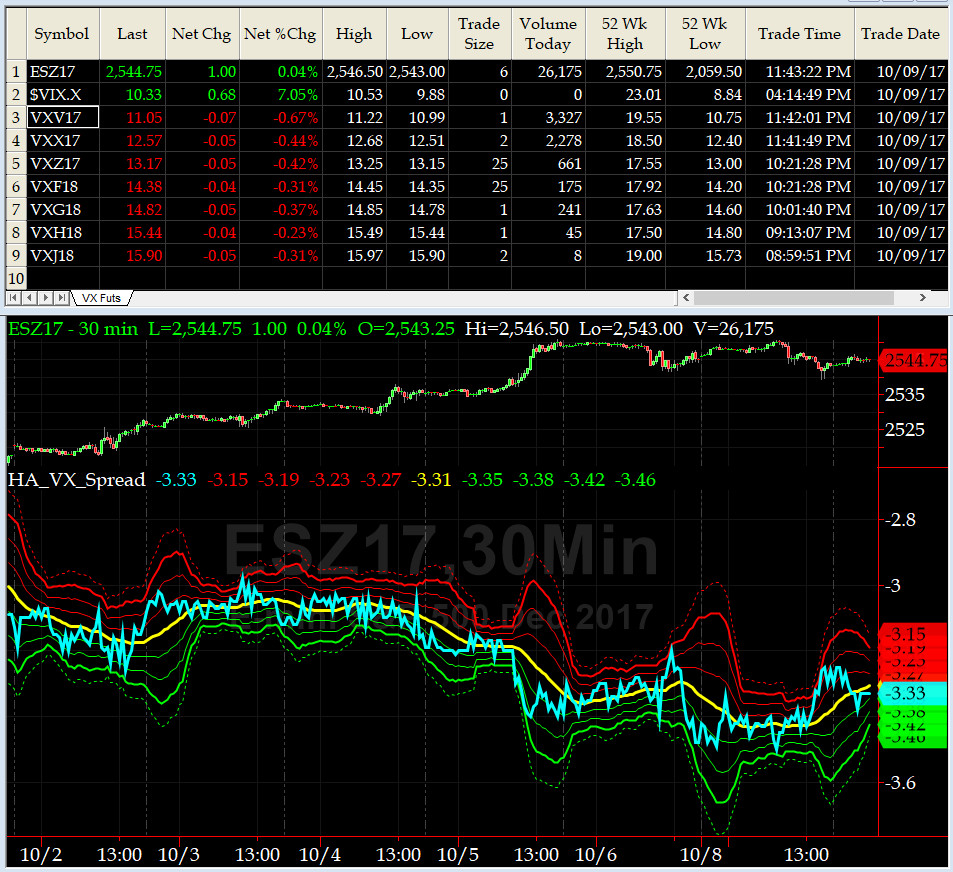
3-month VIX Futures Spread(VX) Chart
The Long OCT17, Short JAN18 Spread has been trending lower as SPX made new ATHs. Equity markets remain in overbought is the current signal here.
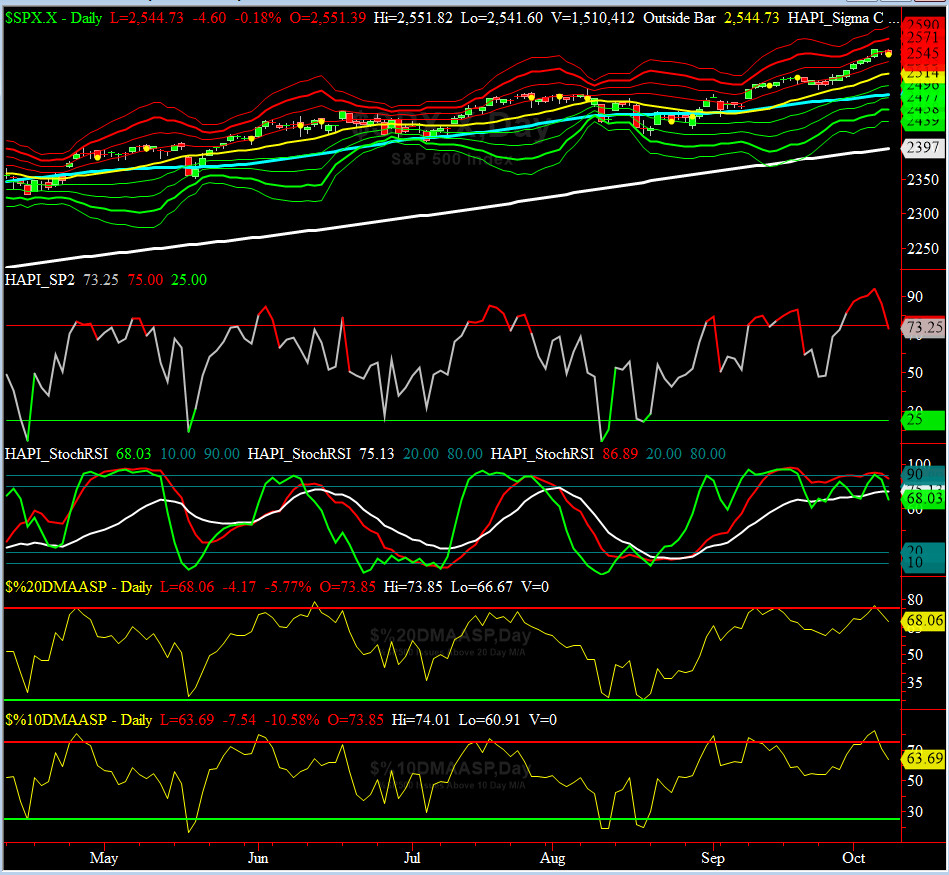
HA_SP2 Chart
HA_SP2 = 73+ (Buy signal <= 25, Sell Signal >= 75)
Our favorite prop indicator rallied to 94+ last Thursday as SPX hit our secondary profit target of 2550 and then came back down a tad on Monday to close at 73.25.
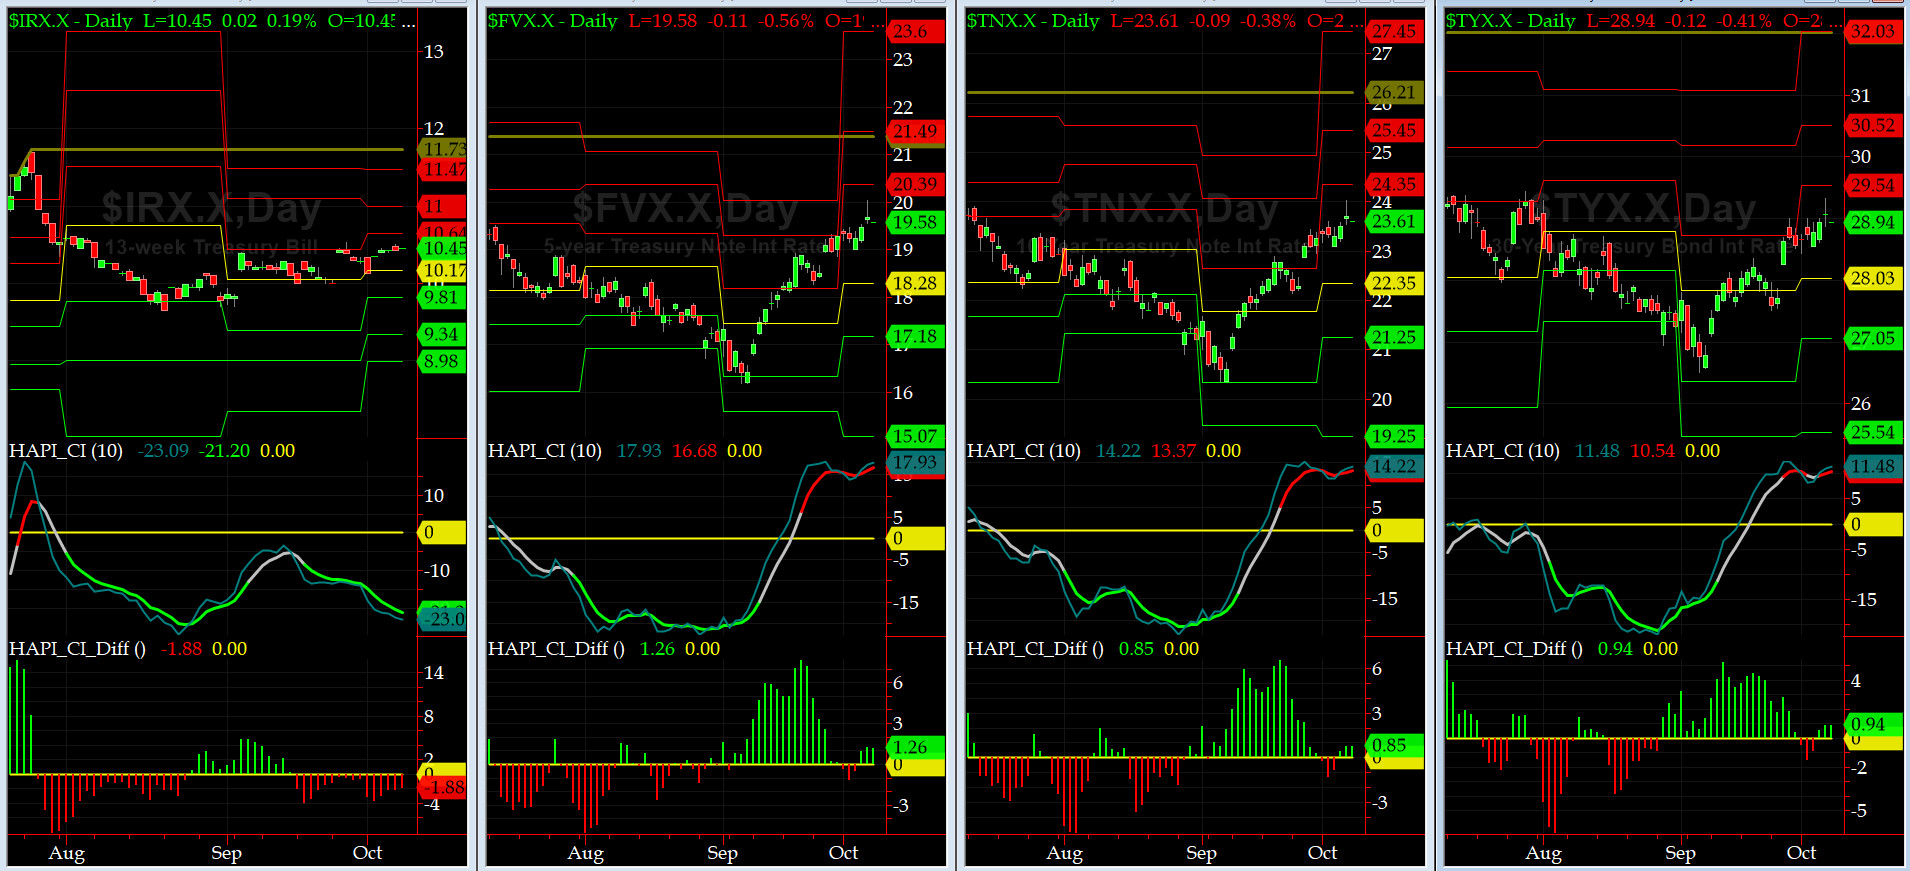
US Treasury T-Notes & T-Bonds Yields Chart
Our Treasury Market sold off as YTMs for Notes & Bonds rose a tad this past week. The front end of the Yield Curve again remained flat.
Fari Hamzei
|


 Proactive Market Timing