|
Sunday, October 15, 2017, 2330ET
Market Timing Charts, Analysis & Commentary for Issue #213
Timer Charts of S&P-500 Cash Index (SPX) + NASDAQ-100 Cash Index (NDX)
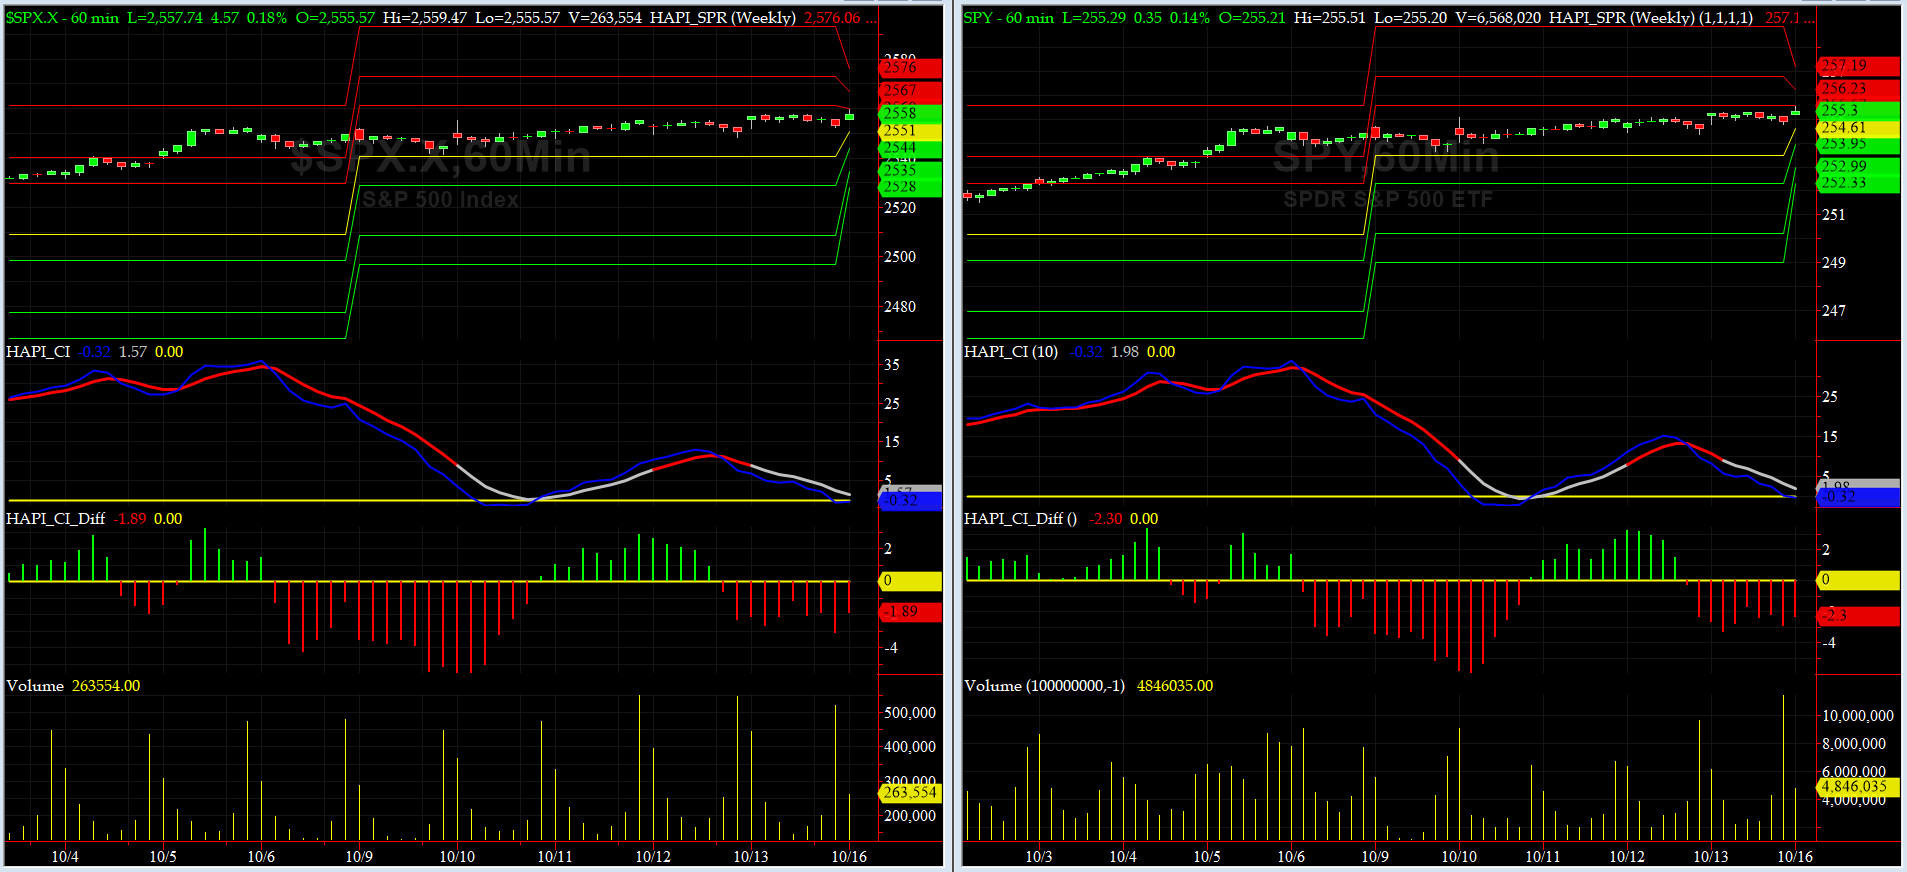
Most recent S&P-500 Cash Index (SPX): 2553.17 up +8.44 (up +0.33%) for four trading days ending on Friday, October 13, 2017, which closed just about its +1.5 sigma.
SPX ALL TIME INTRADAY HIGH = 2555.24 (reached on Wednesday, Oct 11, 2017)
SPX ALL TIME CLOSING HIGH = 2557.65 (reached on Friday, Oct 13, 2017)
Current DAILY +2 Sigma SPX = 2569 with WEEKLY +2 Sigma = 2545
Current DAILY 0 Sigma (20 day MA) SPX = 2525 with WEEKLY 0 Sigma = 2467
Current DAILY -2 Sigma SPX = 2482 with WEEKLY -2 Sigma = 2389
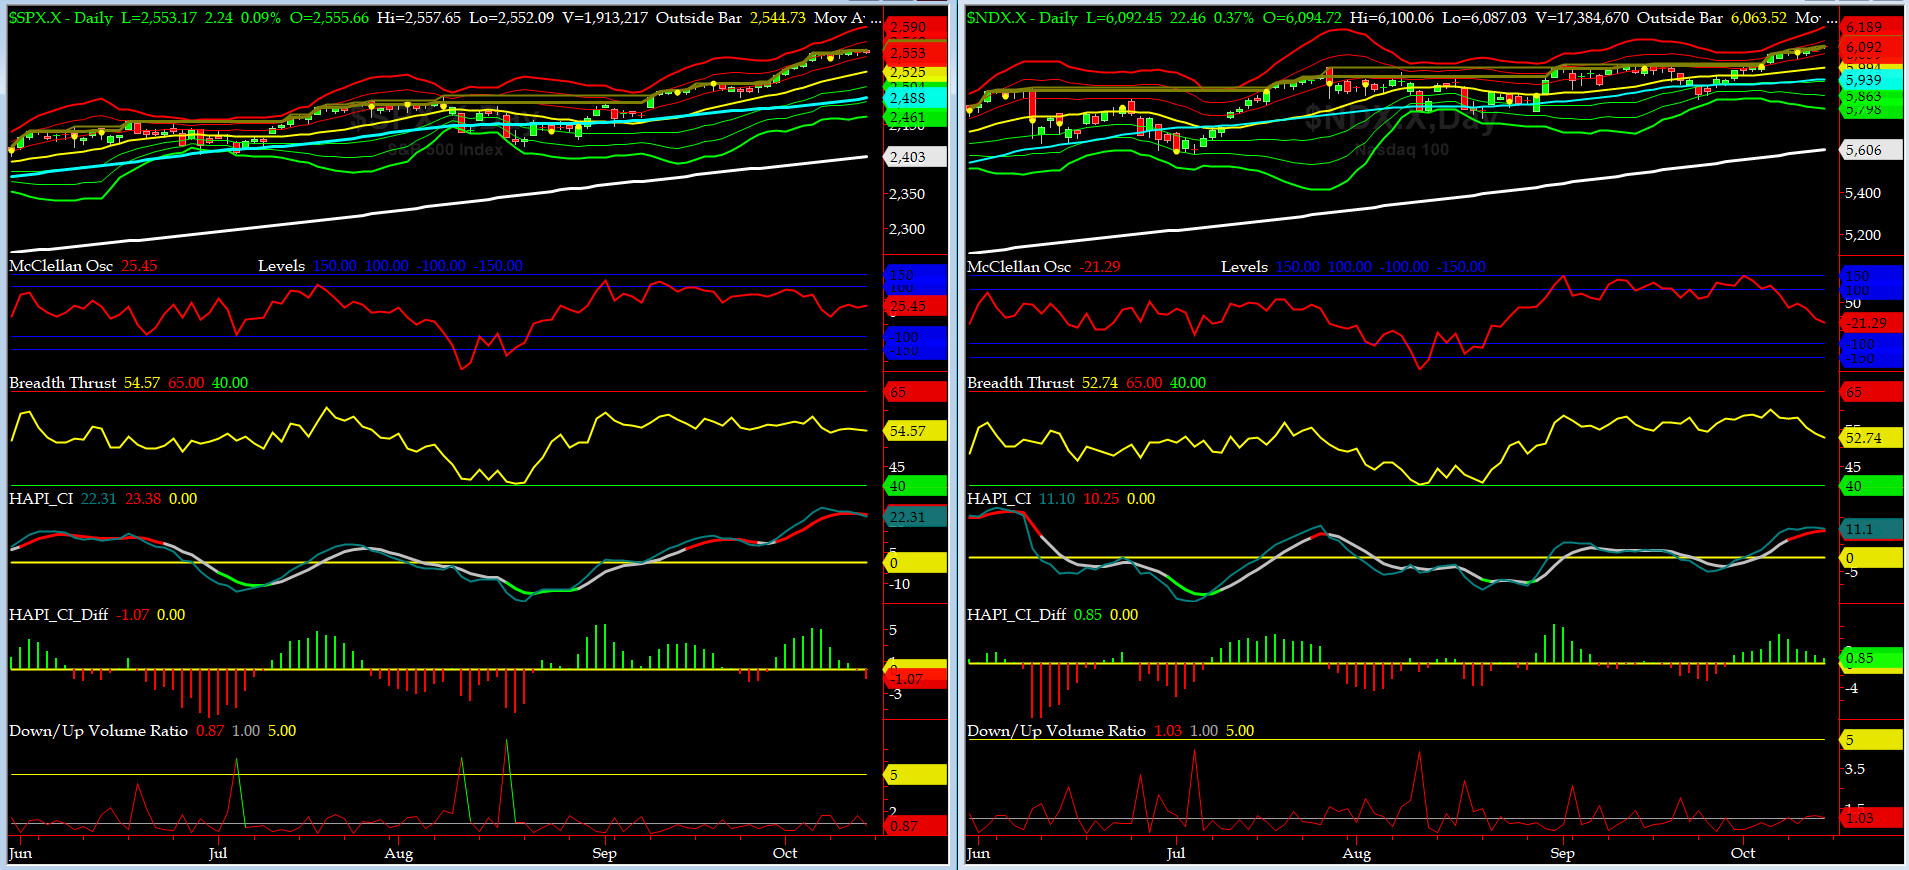
NYSE McClellan Oscillator = +25 (-150 is start of the O/S area; around -275 to -300 area or lower, we go into the �launch-pad� mode, over +150, we are in O/B area)
NYSE Breadth Thrust = 54.6 (40 is considered as oversold and 65 as overbought)
This week was another Sausage Ops, direct from Roma, Sicily & Milan.
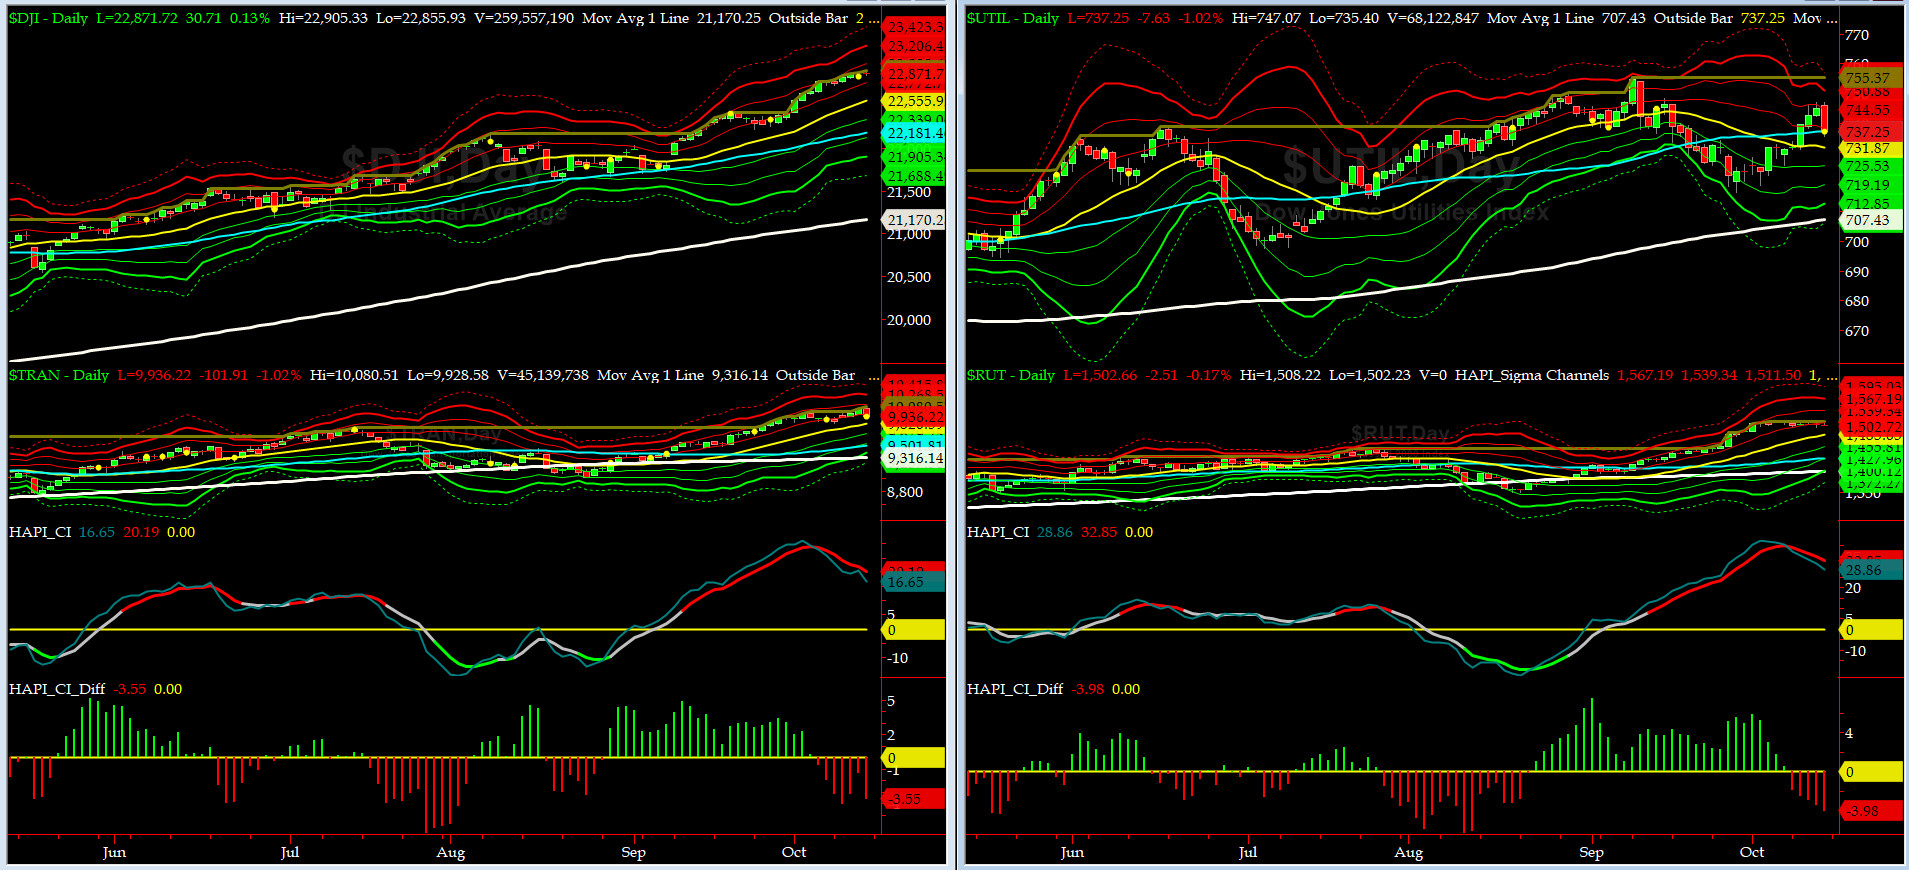
Canaries [in the Coal Mine] Chart for DJ TRAN & RUT Indices
200-Day MA DJ TRAN = 9316 or 6.7% above DJ TRAN (max observed in last 7 yrs = 20.2%, min = -20.3%)
200-Day MA RUT = 1399 or 7.4% above RUT (max observed in last 7 yrs = 21.3%, min = -22.6%)
DJ Transportation Index (proxy for economic conditions 6 to 9 months hence) put in a new ATH on Thursday and then gave back over 1% on Friday.
Russell 2000 Small Caps Index (proxy for Risk ON/OFF) drifted down a tad .... RISK is still ON, for now.
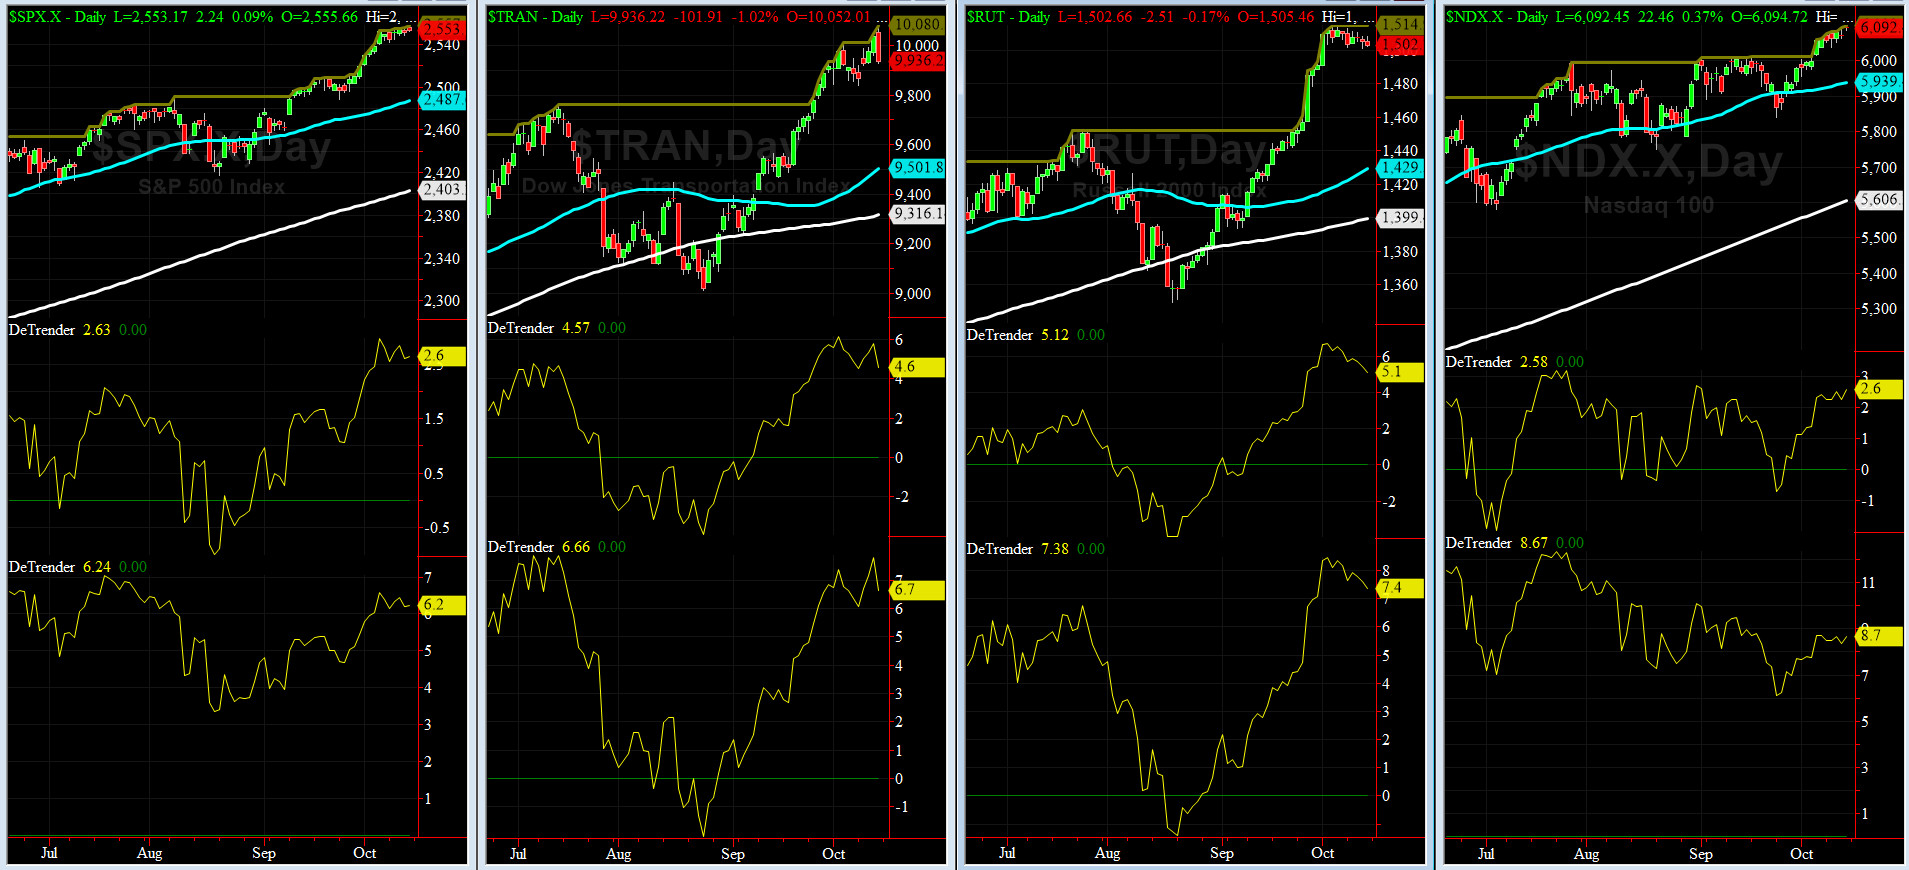
DeTrenders Charts for SPX, NDX, TRAN & RUT Indices
50-Day MA SPX = 2487 or 2.6% below SPX (max observed in last 7 yrs = +8.6%, min = -9.3%)
200-Day MA SPX = 2403 or 6.2% below SPX (max observed in last 7 yrs = 15.2%, min = -14%)
All of our EIGHT DeTrenders are continue to remain POSITIVE while the DeTrenders for DJ Tran & RUT will continue to be harbingers of future price behavior in broad indices.
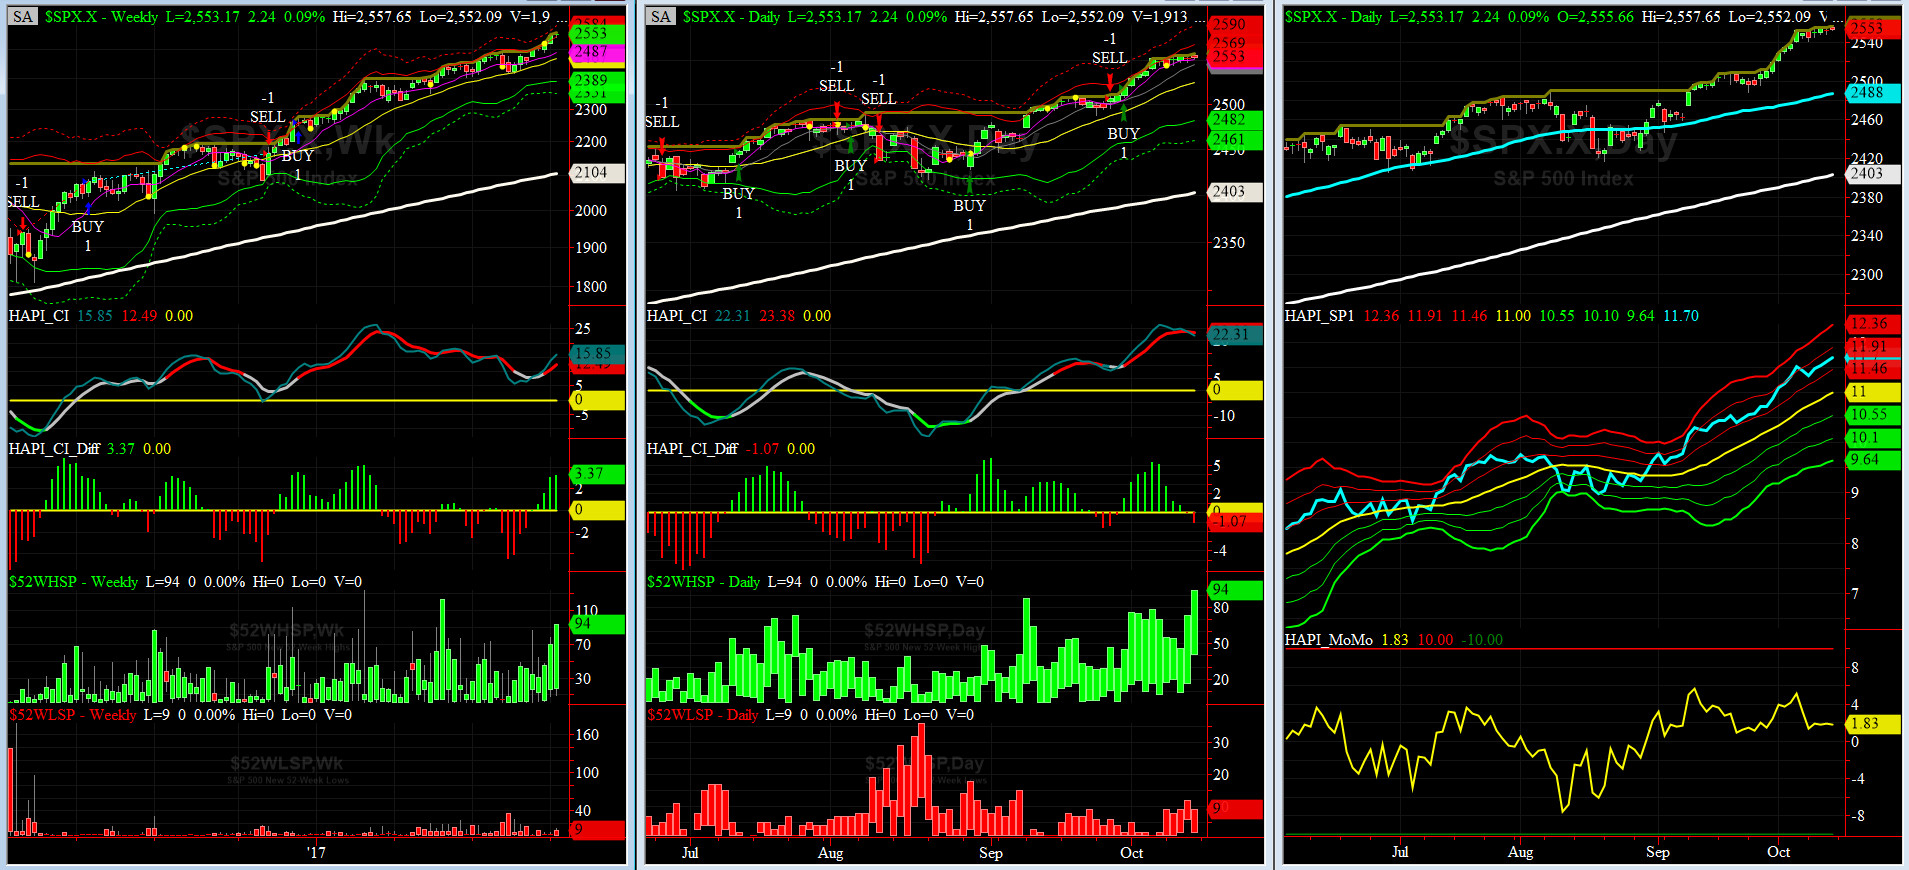
HA_SP1_Momo Chart
WEEKLY Timing Model = on a BUY Signal since Friday 12/16/16 CLOSE at 2258
DAILY Timing Model = on a BUY Signal since Friday 9/29/17 CLOSE at 2519
Max SPX 52wk-highs reading last week = 94 (over 120-140, the local maxima is in)
Max SPX 52wk-Lows reading last week = 12 (over 40-60, the local minima is in)
HA_SP1 closed near its +1.5 sigma channels
HA_Momo = +1.8 (reversals most likely occur above +10 or below -10)

Vol of the Vols Chart
VIX currently stands at 9.51, right at its +1 sigma (remember it's the VIX volatility pattern ( its sigma channels) that matters, and not the level of VIX itself (this is per Dr. Robert Whaley, a great mentor and inventor of original VIX, now called VXO ). VIX usually peaks around a test of its +4 sigma).
Last week, VIX again continued to drift down and ended up trading in 9 handle by Friday.
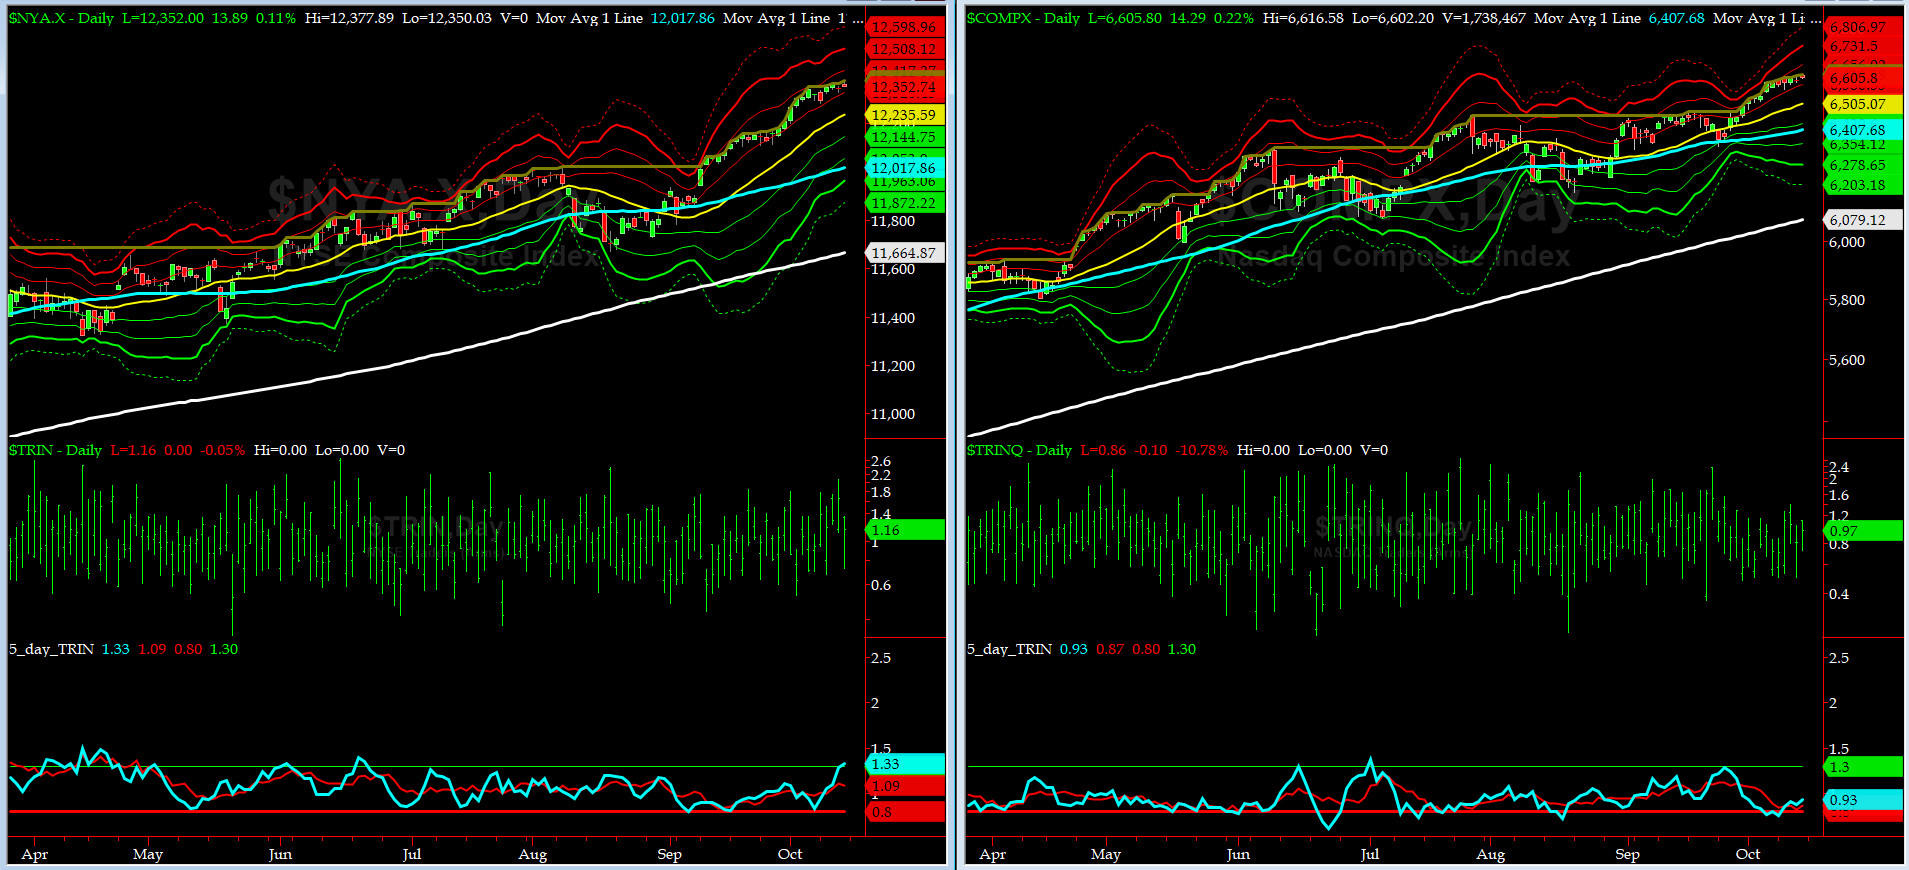
5-day TRIN & TRINQ Charts
NYSE 5-day TRIN is at the BUY (yes buy) zone while NASDAQ 5-day is at NEUTRAL Zone.
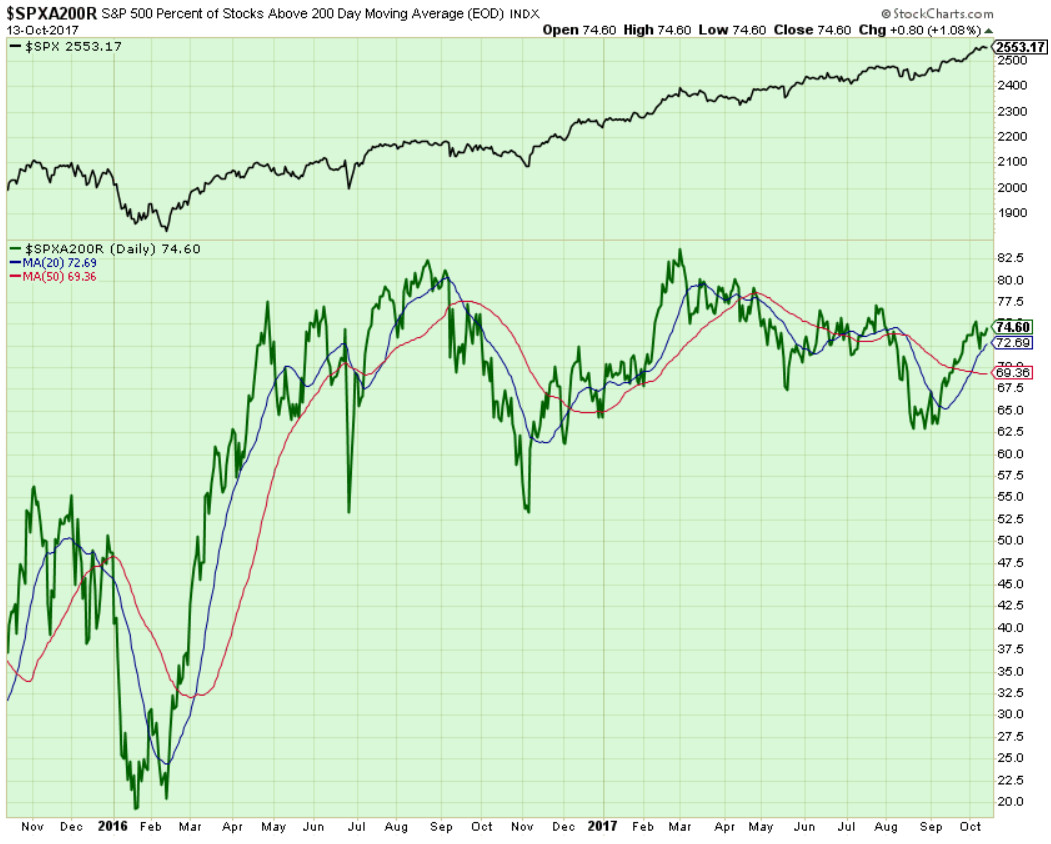
Components of SPX above their respective 200day MA Chart
During the past week, this scoring indicator tried again to test 75% level. Next breakout level is 78%. Until there is no signal here.
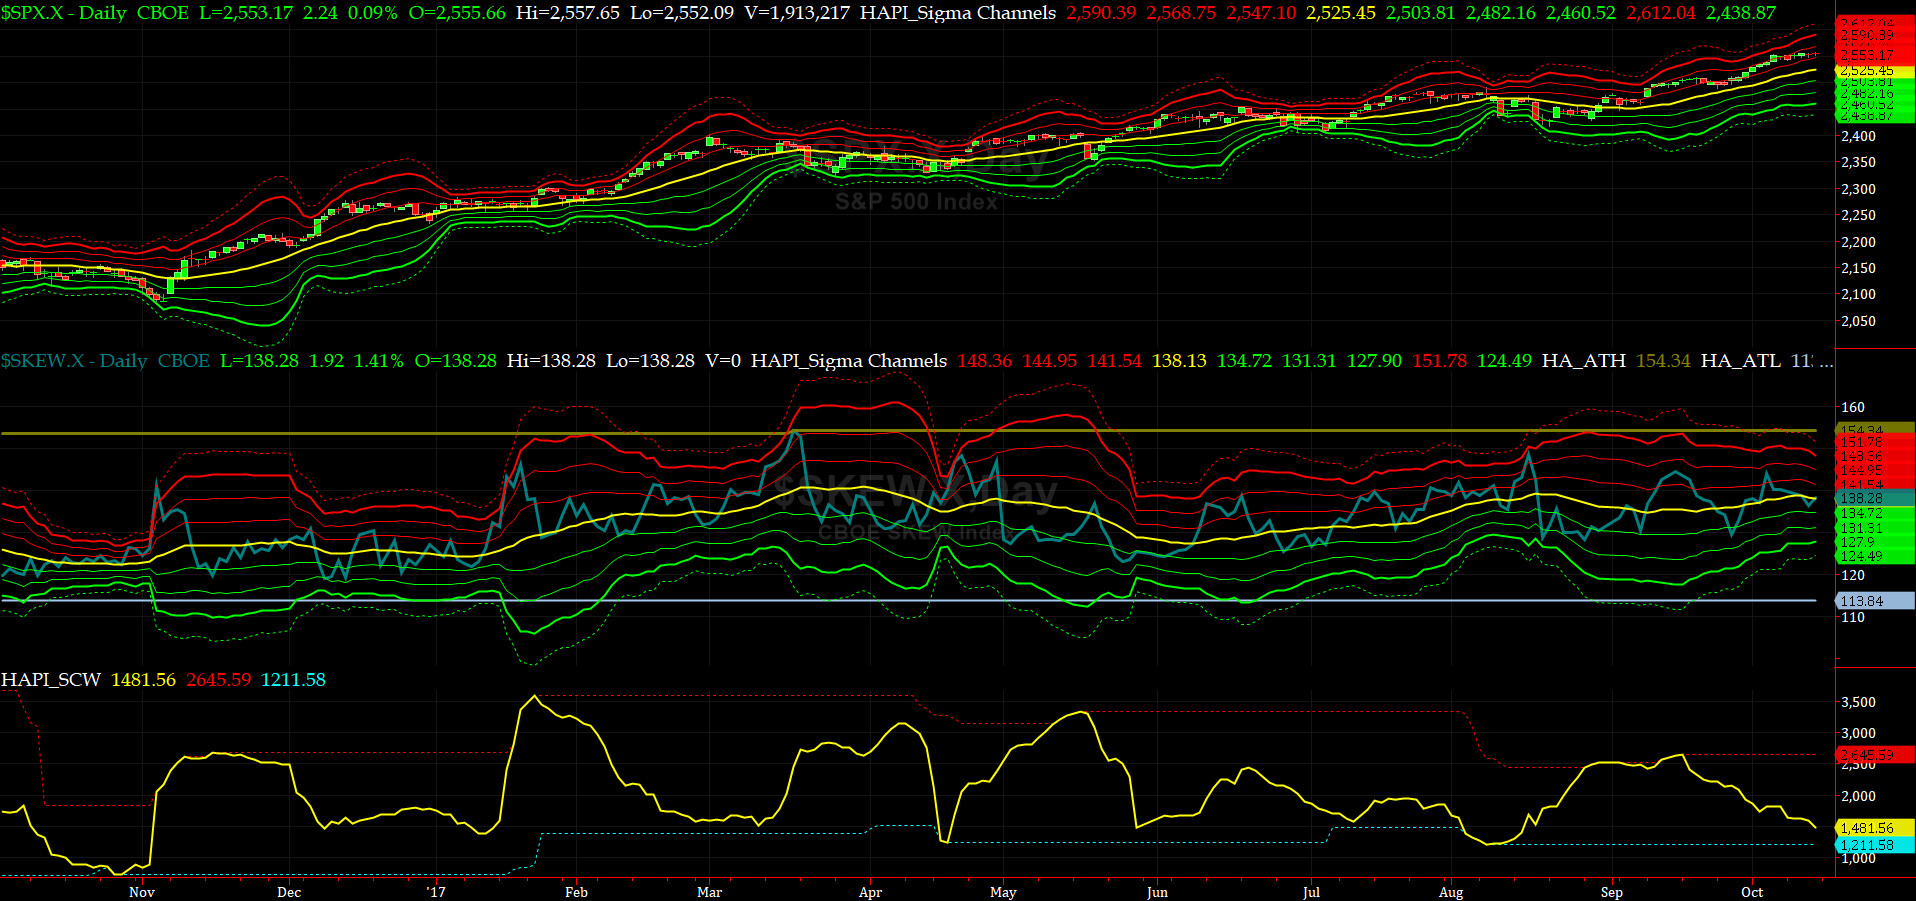
SPX SKEW (Tail Risk) Chart
Last week SPX SKEW (Tail Risk) was very muted & closed at 138, or its zero sigma (normal = 120-125, range 100-150).
Is all quiet on the Eastern & Mid-Western Fronts? Smart Money votes YES.
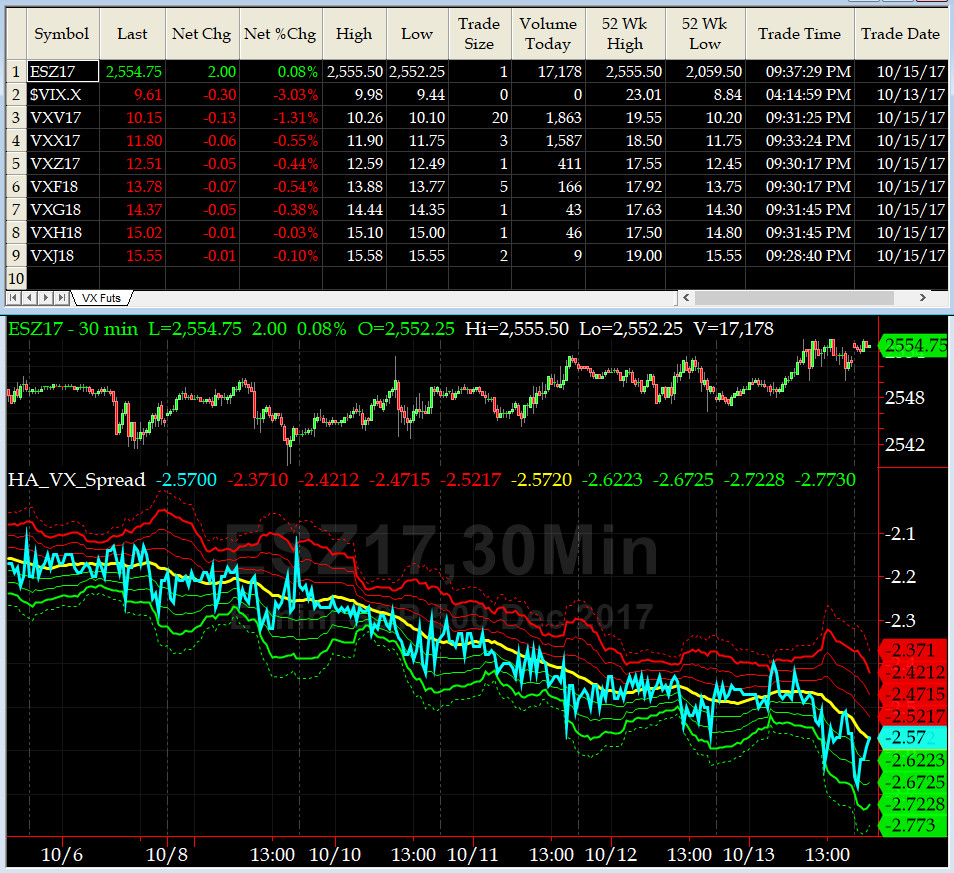
3-month VIX Futures Spread(VX) Chart
The Long NOV17, Short FEB18 Spread continued to trend lower as SPX made new ATHs. Equity markets remain in overbought zone.
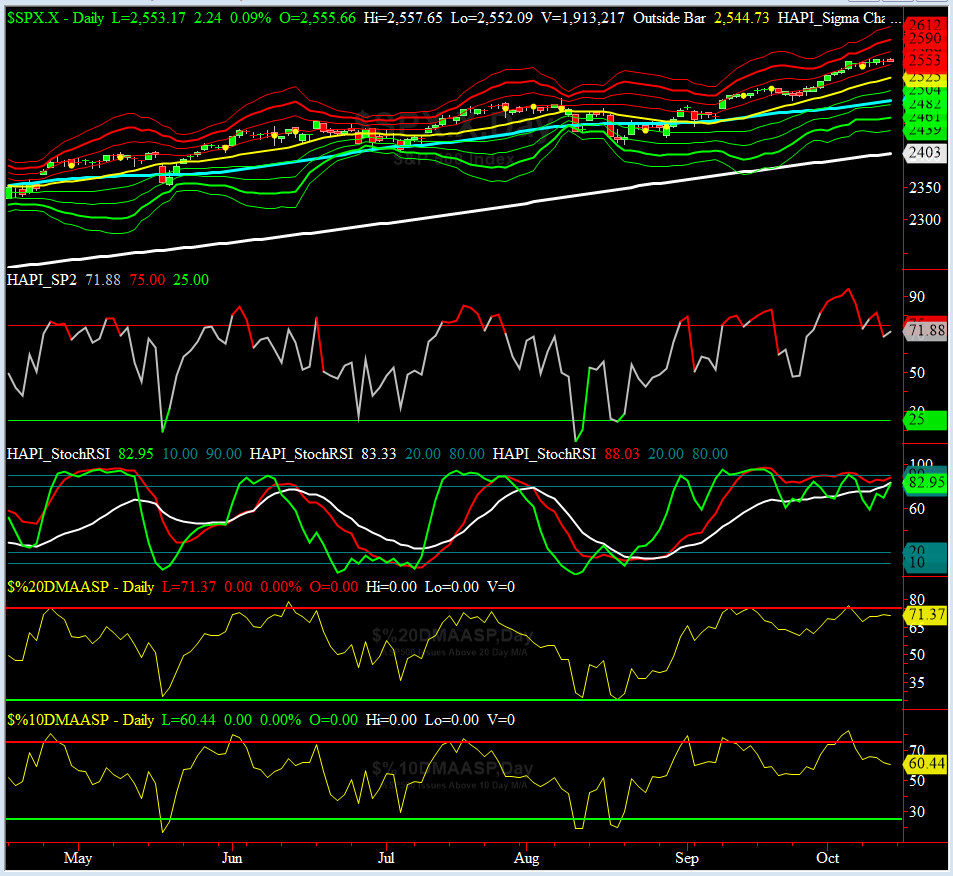
HA_SP2 Chart
HA_SP2 = 71.8 (Buy signal <= 25, Sell Signal >= 75)
Our favorite prop indicator had eased off quite a bit from 94+ and setting up a possible divergence .
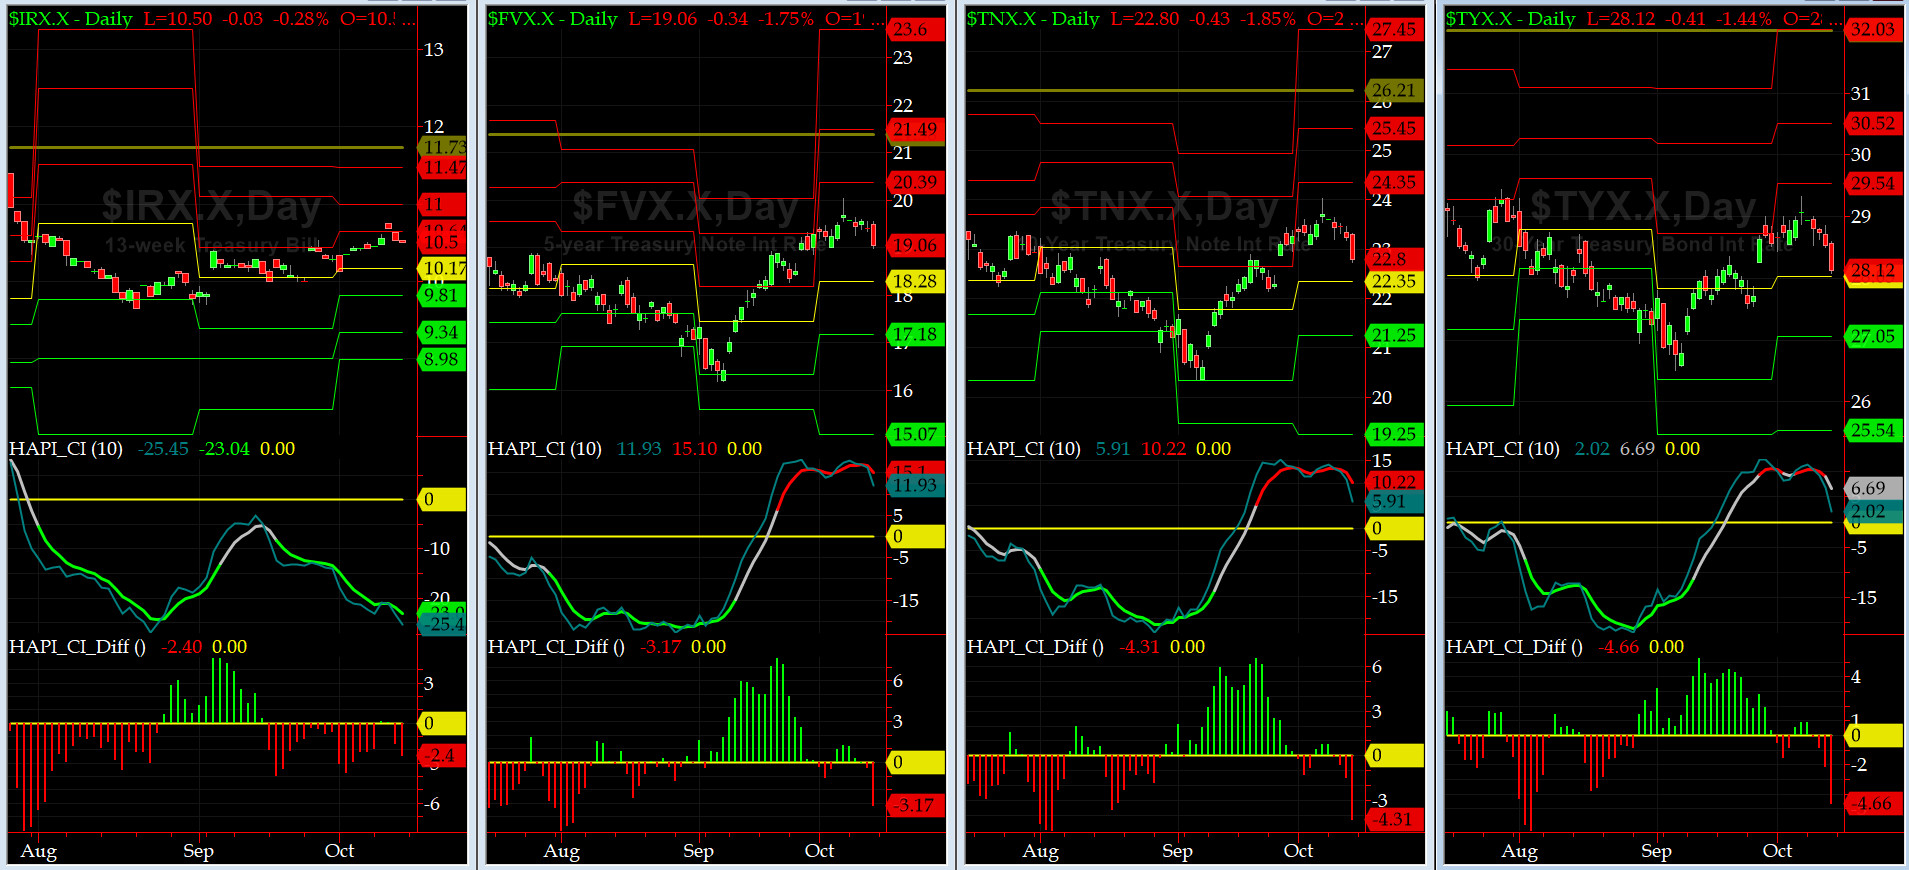
US Treasury T-Notes & T-Bonds Yields Chart
Our Treasury Market rallied hard on Friday and YTMs for Notes & Bonds adjusted down a tad this past week. The front end of the Yield Curve had a small up-tick.
Fari Hamzei
|


 Proactive Market Timing