
|
 |
 |
 |
 |
 |
 |
 |
 |
 Proactive Market Timing Proactive Market Timing
|
|
|
Most Recent PMT vs SPX Performance Chart

|
|
|
|
Monday, October 23, 2017, 0955ET
Companion Chart for Market Bias Review, Issue #214
|
|
|
|
|
|
Monday, October 23, 2017, 0950ET
Market Bias for Issue #214
Our current Market Bias with Timer Digest is LONG SPX as of Friday OCT 20 at 2575.21
Our previous Market Bias was SHORT SPX as of Monday OCT 9 at 2544.73
Here are the trade parameters for this week:
SPX Secondary Profit Target for last 20% of our position = 2605
SPX Primary Profit Target for first 80% of our position = 2590
SPX BreakEven Stop (Last Open) for last 20% of our position = 2578
SPX Money Management Stop for 100% of our position = 2565
|
| Action |
Asset |
Expiration |
Strike |
Option |
| BUY |
SPY |
Friday NOV 17 |
258 |
Calls |
| SELL SHORT |
SPY |
Friday NOV 17 |
262 |
Calls |
| You need to execute both legs and hold it as a CallSpread.
|
Note A:
Once the Primary Profit Target has been reached, traders are advised to close 80% of their position in order to lock in profits. The remaining balance can be carried over with a BreakEven STOP, based on the SPX level at the time of entry, in order to make the trade a zero-risk trade with the final position running to reach the Secondary Profit Target.
Once either Secondary Profit or Money Management (BreakEven STOP after the 80% peel-off) is hit, our Option/ETF trade for that week is over. Go to Cash and wait for the next PMT Issue.
Note B:
When we change our Market Bias with Timer Digest, You need to go FLAT asap. With PMT Pro, that is before the Close that day and with the basic PMT, at the open of the next day.
Fari Hamzei
|
|
|
|
|
|
Sunday, October 22, 2017, 2115ET
Market Timing Charts, Analysis & Commentary for Issue #214
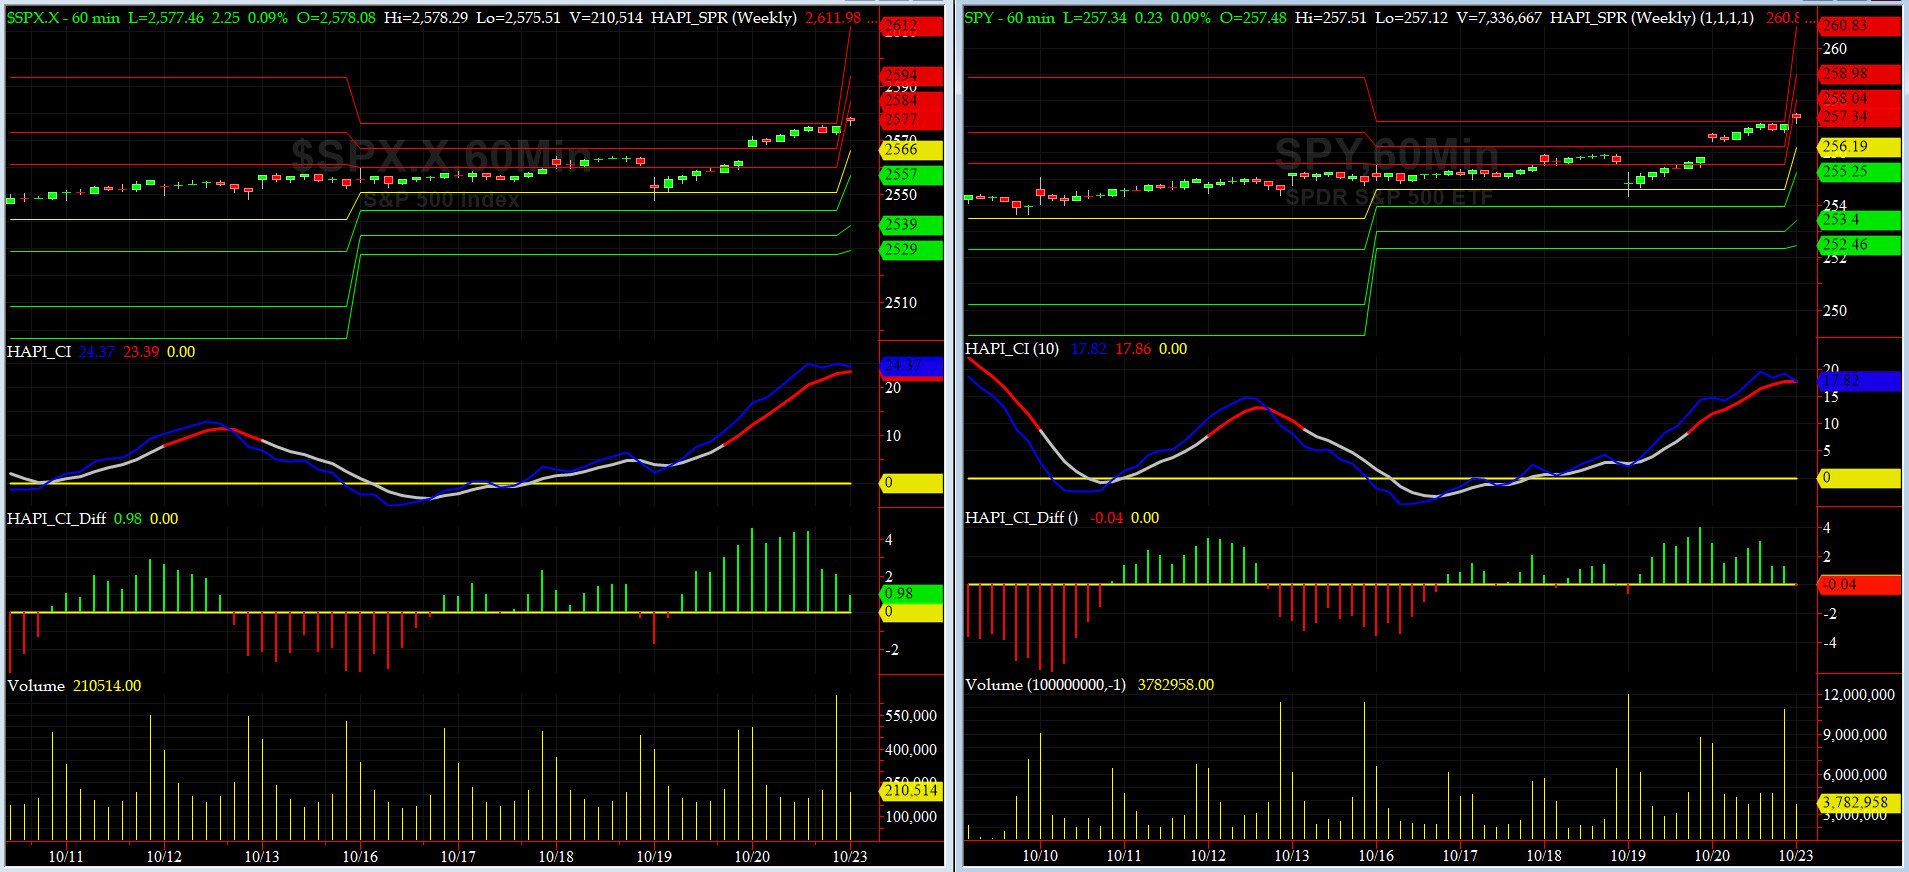
Timer Charts of S&P-500 Cash Index (SPX) + NASDAQ-100 Cash Index (NDX)
Most recent S&P-500 Cash Index (SPX): 2575.21 up +22.04 (up +0.86%) for the week ending on Friday, October 20, 2017, which closed just about its +1.5 sigma.
SPX ALL TIME INTRADAY HIGH = 2575.44 (reached on Friday, Oct 20, 2017)
SPX ALL TIME CLOSING HIGH = 2575.21 (reached on Friday, Oct 20, 2017)
Current DAILY +2 Sigma SPX = 2585 with WEEKLY +2 Sigma = 2564
Current DAILY 0 Sigma (20 day MA) SPX = 2540 with WEEKLY 0 Sigma = 2474
Current DAILY -2 Sigma SPX = 2495 with WEEKLY -2 Sigma = 2384
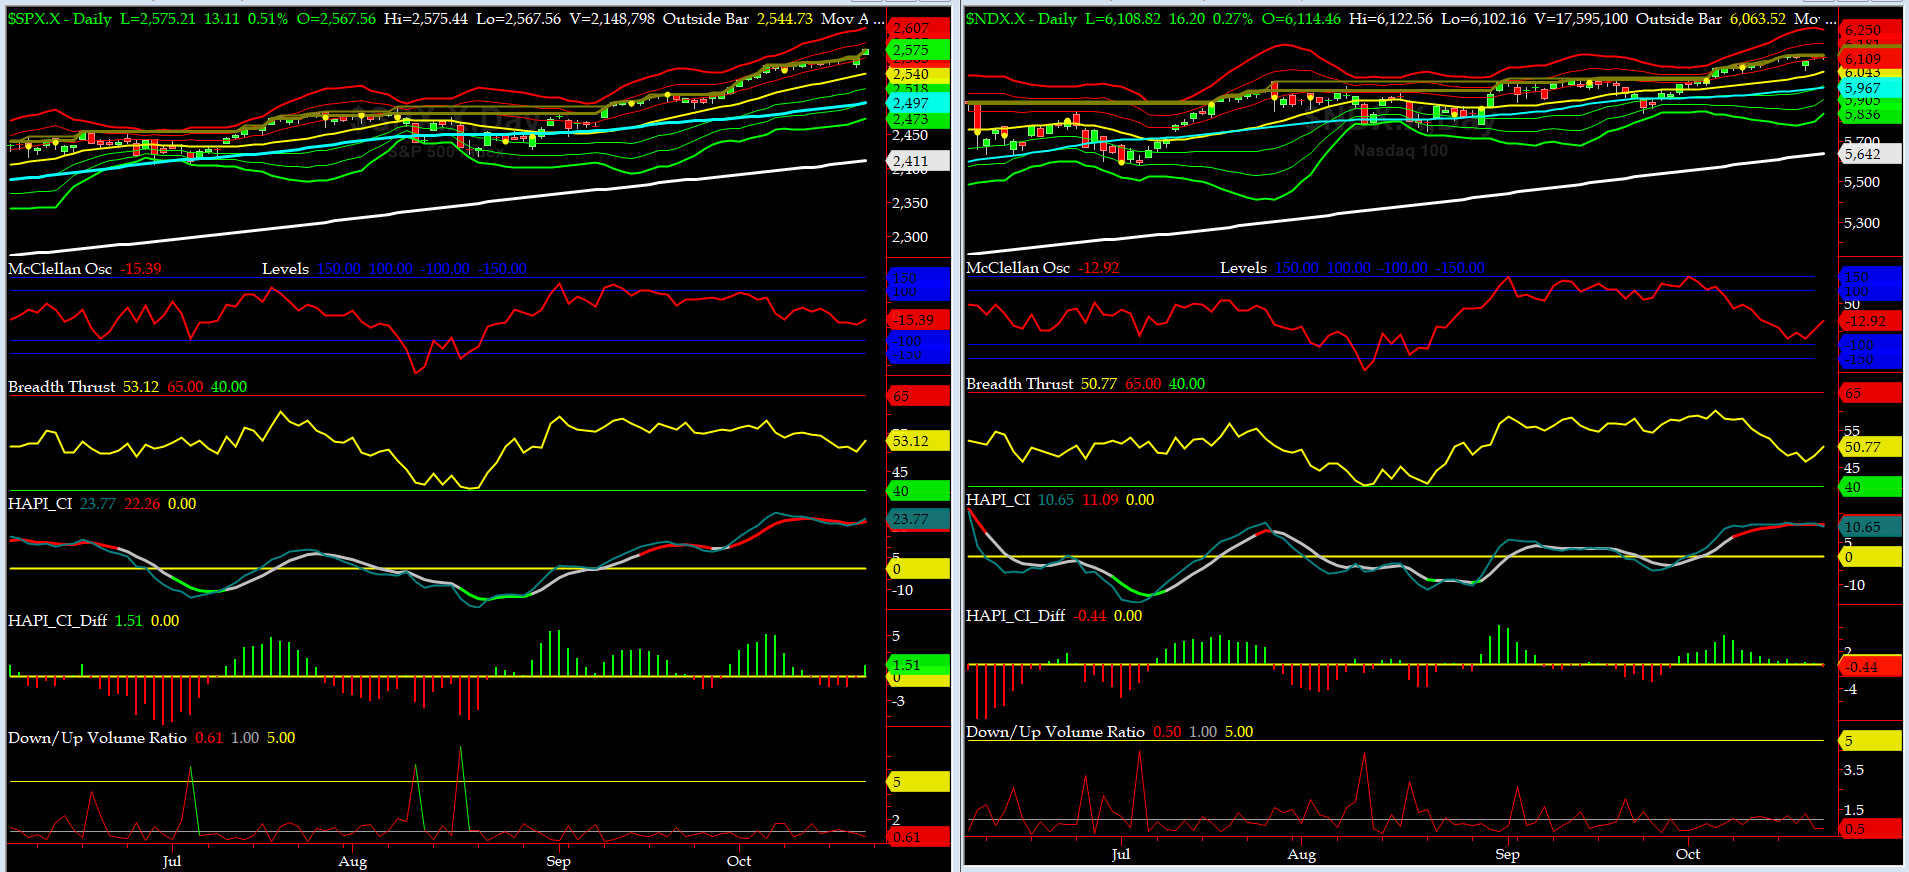
NYSE McClellan Oscillator = -15 (-150 is start of the O/S area; around -275 to -300 area or lower, we go into the �launch-pad� mode, over +150, we are in O/B area)
NYSE Breadth Thrust = 53.12 (40 is considered as oversold and 65 as overbought)

Canaries [in the Coal Mine] Chart for DJ TRAN & RUT Indices
200-Day MA DJ TRAN = 9336 or 6.8% above DJ TRAN (max observed in last 7 yrs = 20.2%, min = -20.3%)
200-Day MA RUT = 1402 or 7.6% above RUT (max observed in last 7 yrs = 21.3%, min = -22.6%)
DJ Transportation Index (proxy for economic conditions 6 to 9 months hence) sold further on Monday, stablized on Tuesday and came back with a roar to close 1% below of its ATH on Friday.
Russell 2000 Small Caps Index (proxy for Risk ON/OFF) drifted down for two days and then pulled to almost touch its ATH on Friday .... RISK is still ON, for now.
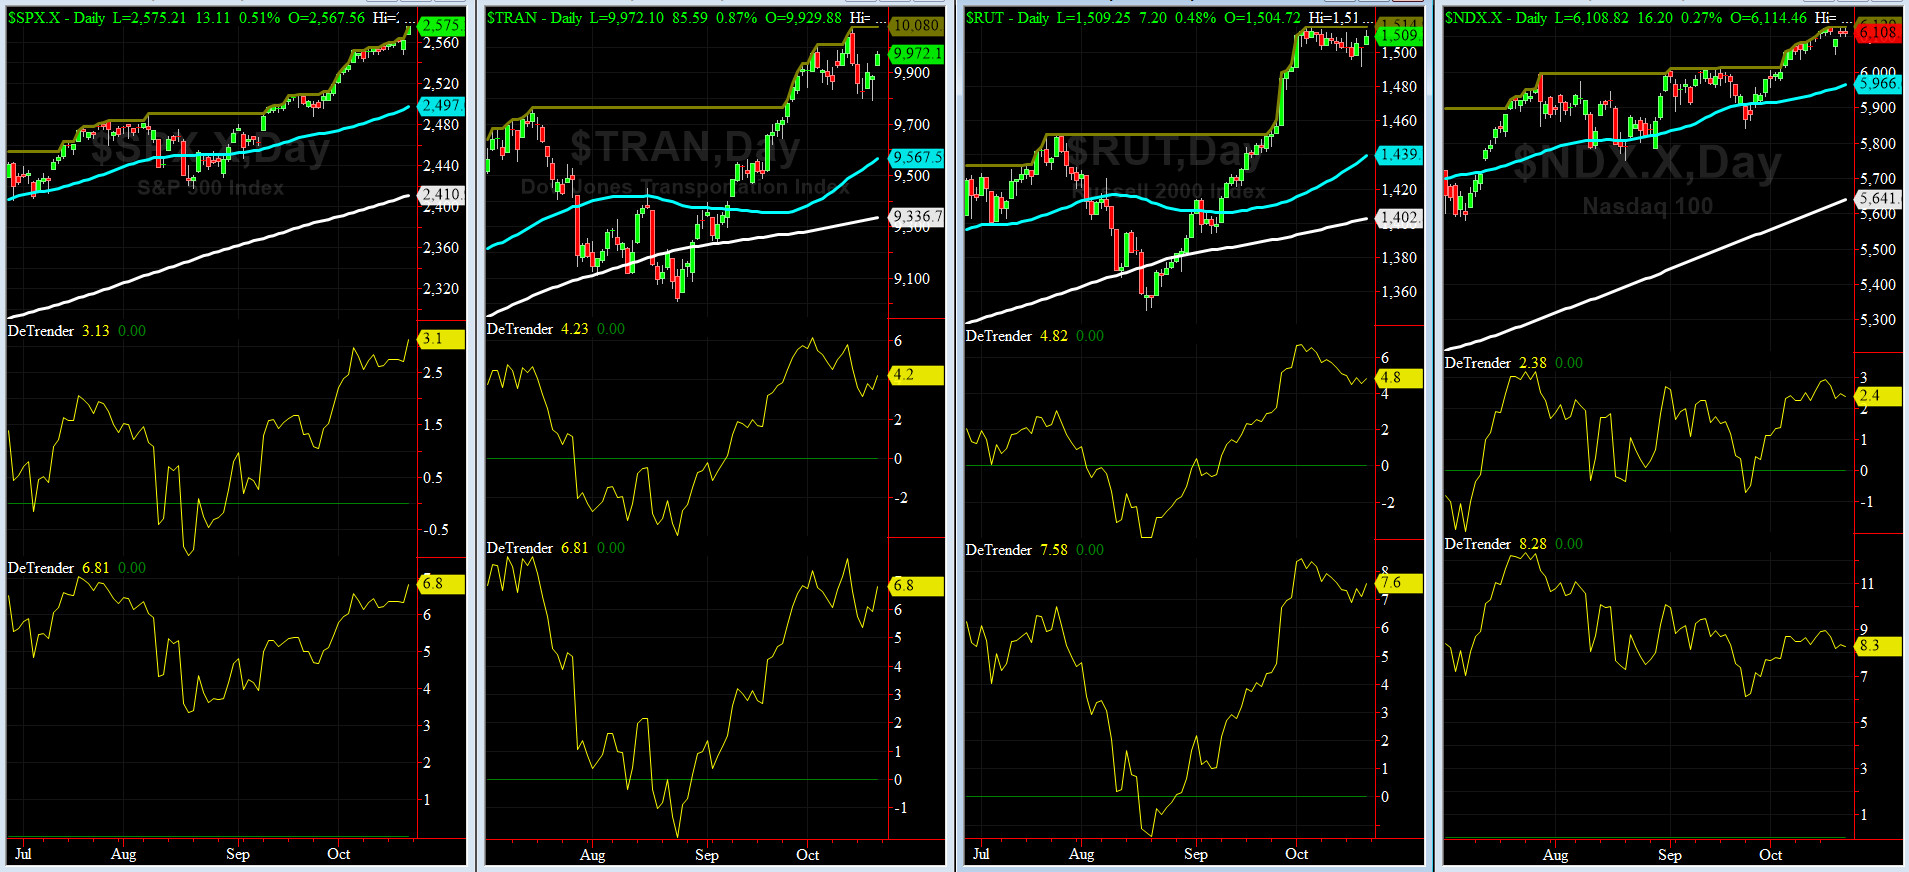
DeTrenders Charts for SPX, NDX, TRAN & RUT Indices
50-Day MA SPX = 2497 or 3.1% below SPX (max observed in last 7 yrs = +8.6%, min = -9.3%)
200-Day MA SPX = 2410 or 6.8% below SPX (max observed in last 7 yrs = 15.2%, min = -14%)
Once again, all of our EIGHT DeTrenders are continue to remain POSITIVE while the DeTrenders for DJ Tran & RUT will continue to be harbingers of future price behavior in broad indices.
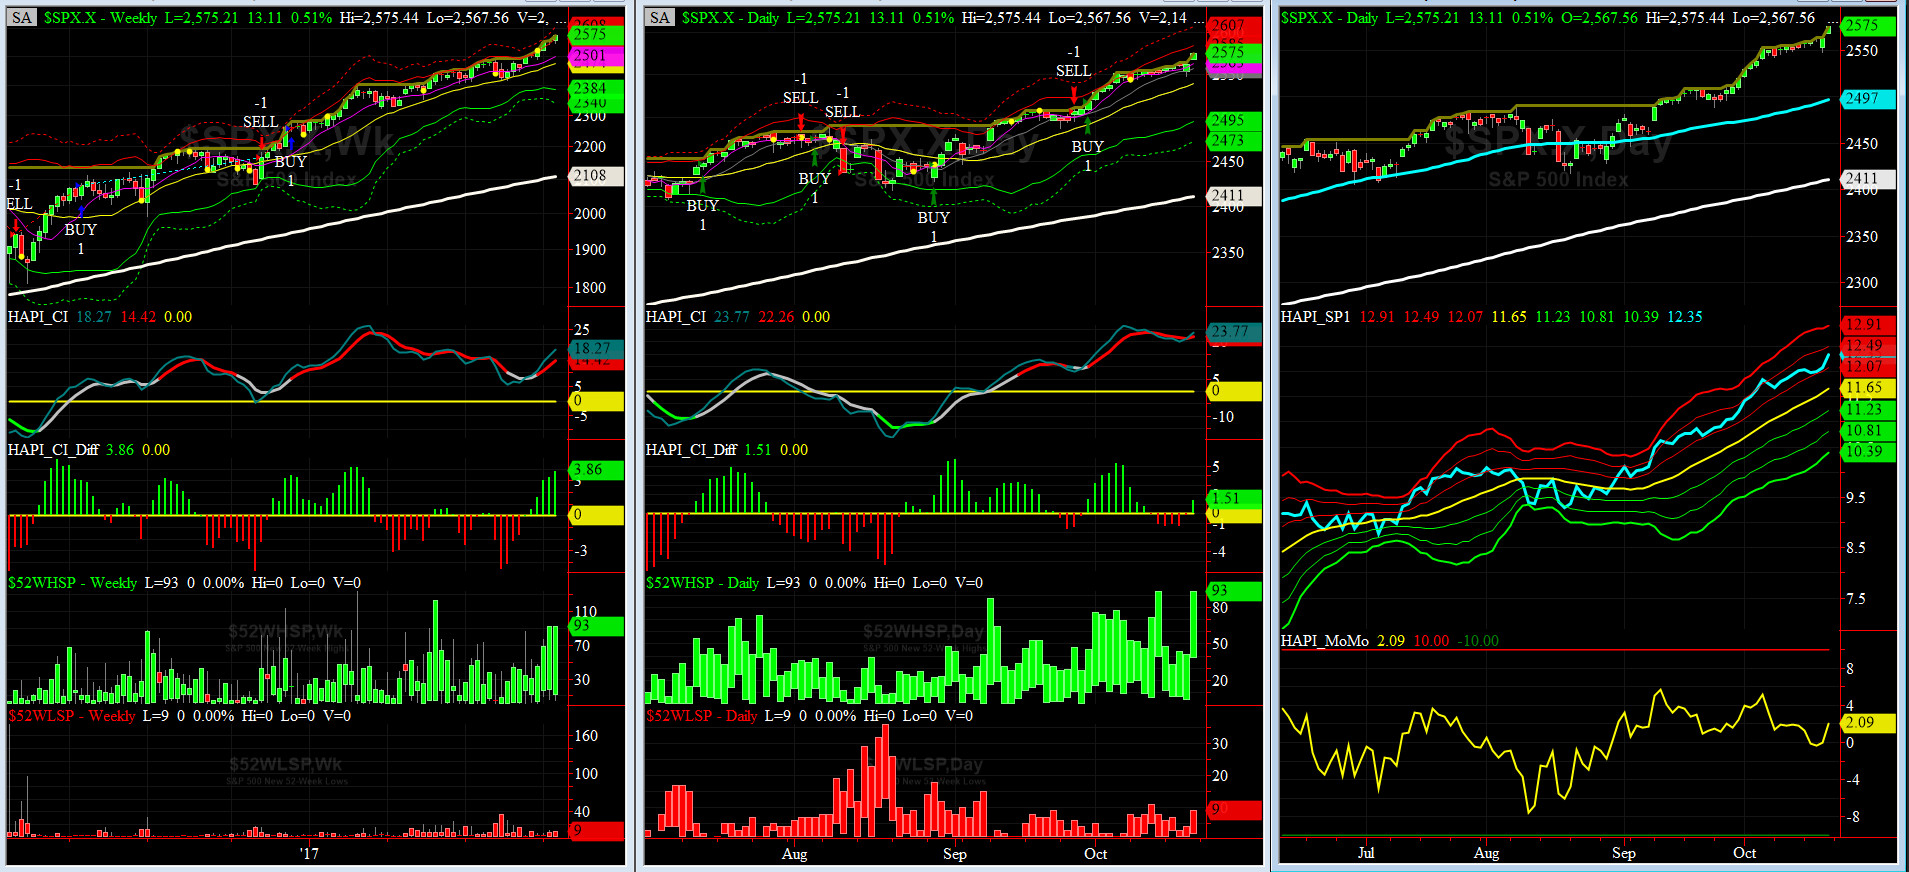
HA_SP1_Momo Chart
WEEKLY Timing Model = on a BUY Signal since Friday 12/16/16 CLOSE at 2258
DAILY Timing Model = on a BUY Signal since Friday 9/29/17 CLOSE at 2519
Max SPX 52wk-highs reading last week = 93 (over 120-140, the local maxima is in)
Max SPX 52wk-Lows reading last week = 9 (over 40-60, the local minima is in)
HA_SP1 closed near its +1.5 sigma channels
HA_Momo = +2.09 (reversals most likely occur above +10 or below -10)

Vol of the Vols Chart
VIX currently stands at 9.97, at about its zero sigma (remember it's the VIX volatility pattern ( its sigma channels) that matters, and not the level of VIX itself (this is per Dr. Robert Whaley, a great mentor and inventor of original VIX, now called VXO ). VIX usually peaks around a test of its +4 sigma).
Last week, VIX had a short-lived spike to ~12 but it was short-lived. CBOE should setup a GoFundMe page, should VIX breaks the 8 handle. LOL.
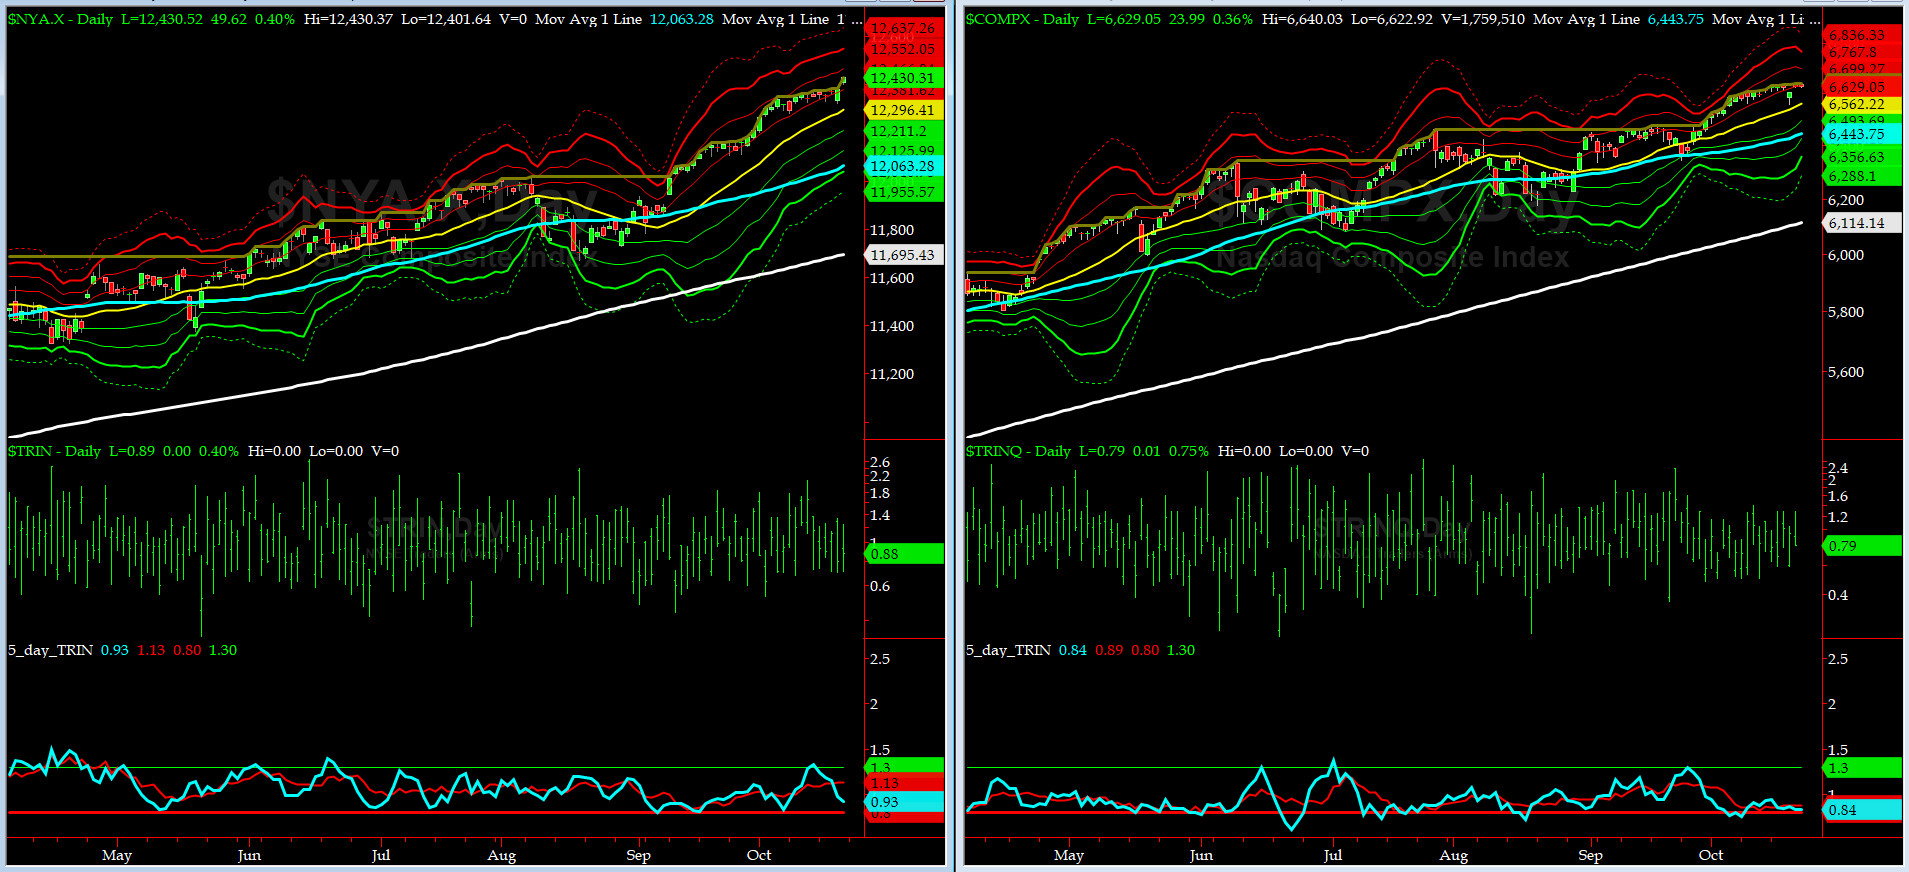
5-day TRIN & TRINQ Charts
Both NYSE & NASDAQ 5-day TRINs are near the SELL Zone.
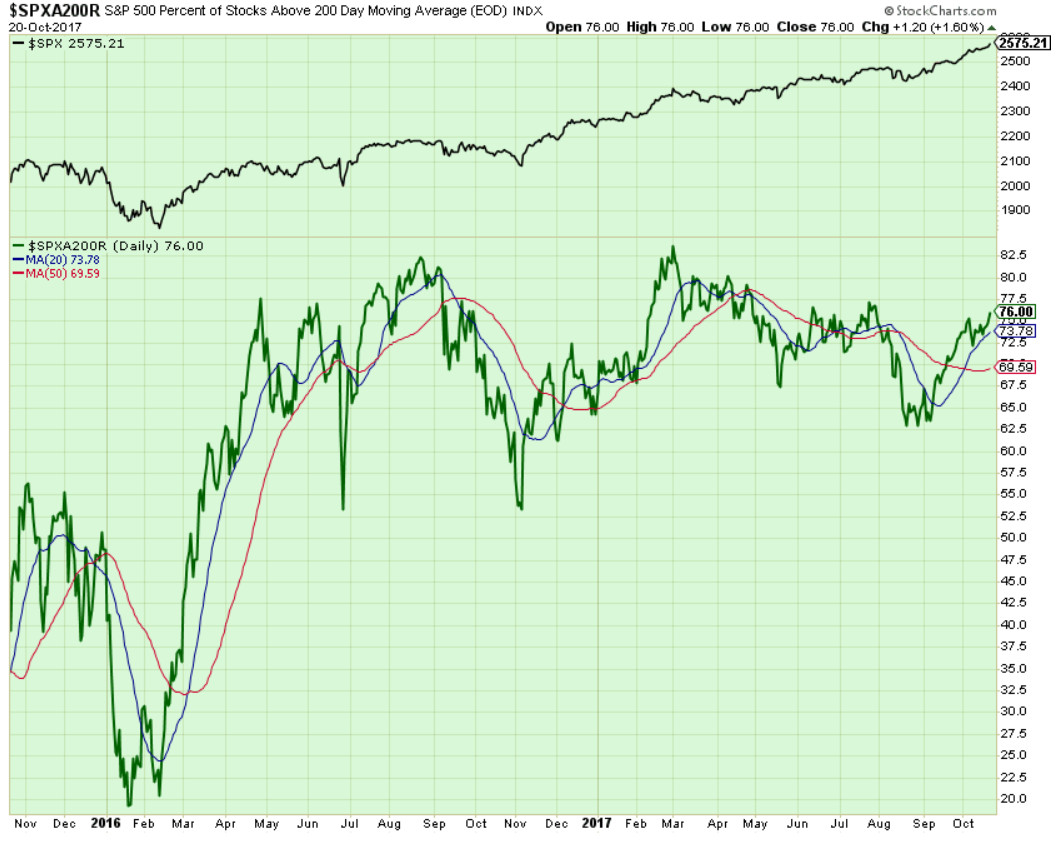
Components of SPX above their respective 200day MA Chart
On Friday, this scoring indicator finally broke out over 75% and ran up to 76% level. Next breakout level is 80%.

SPX SKEW (Tail Risk) Chart
Last week SPX SKEW (Tail Risk) while continuing to register near its "design limit" of 150, managed to close at 148.8, or its +1.5 sigma (normal = 120-125, range 100-150).
Is all quiet on the Eastern & Mid-Western Fronts? Smart Money now votes NO.
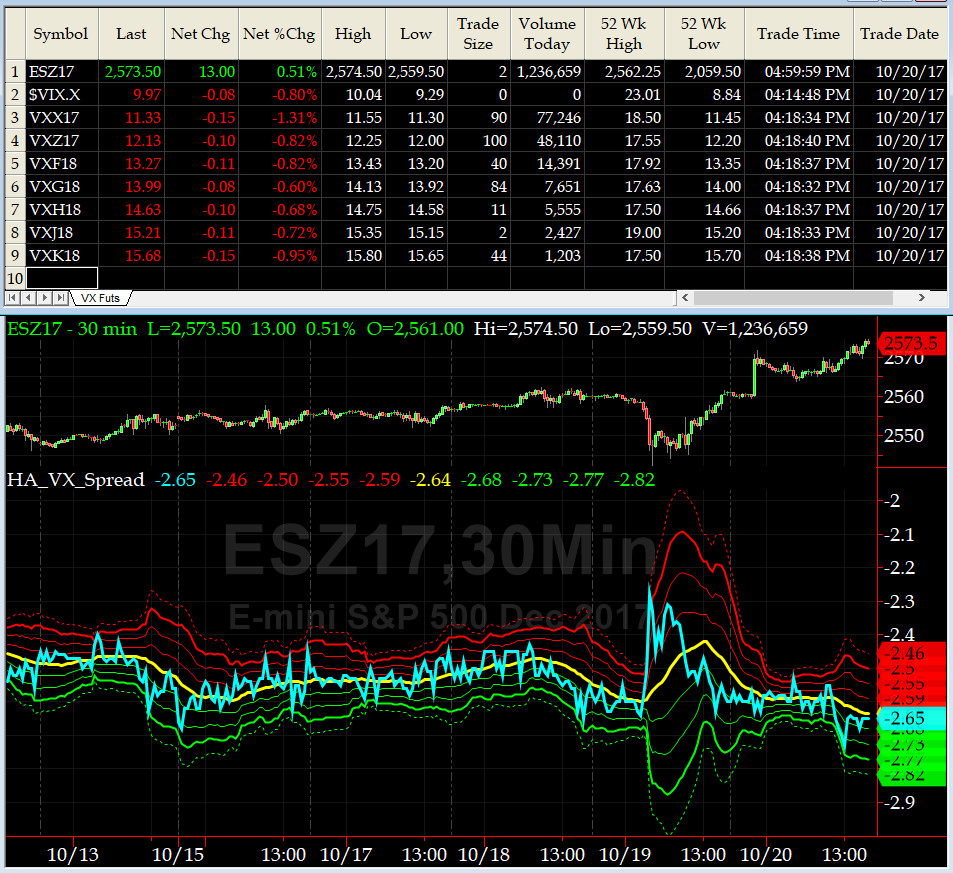
3-month VIX Futures Spread(VX) Chart
The Long NOV17, Short FEB18 Spread continued to trend lower after a massive spike early Thursday. Equity markets remain in overbought zone.
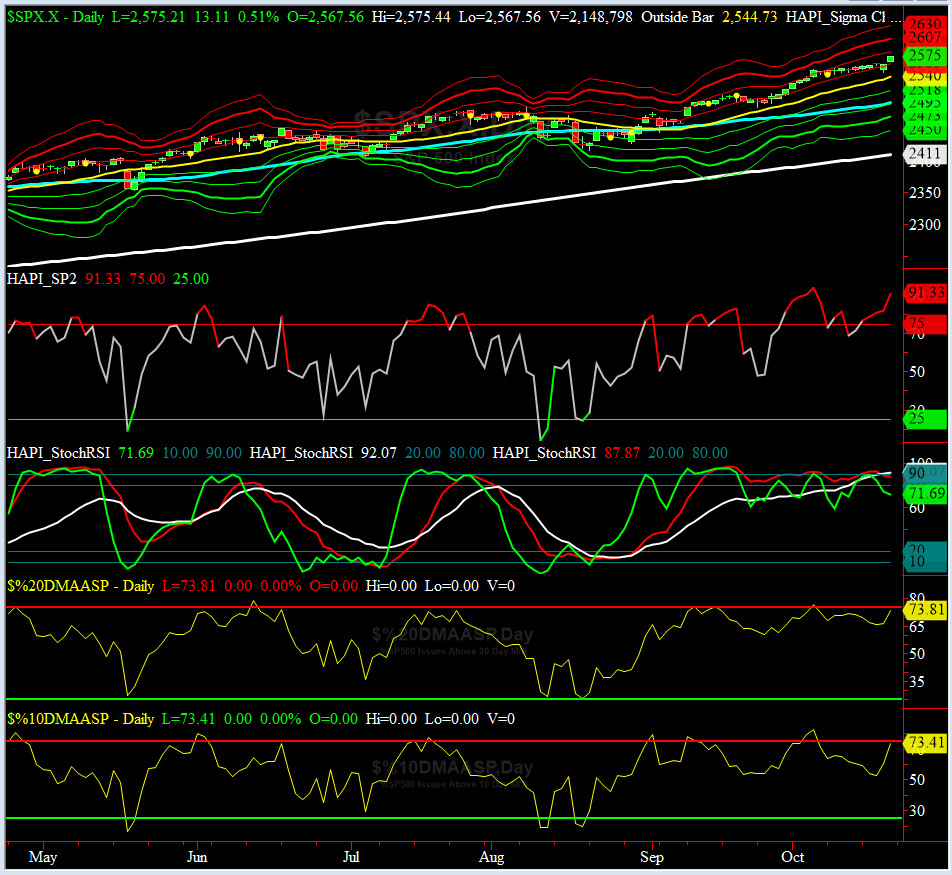
HA_SP2 Chart
HA_SP2 = 71.8 (Buy signal <= 25, Sell Signal >= 75)
Our favorite prop indicator closed on Friday at 91.3, while maintainging a possible "soft" divergence .
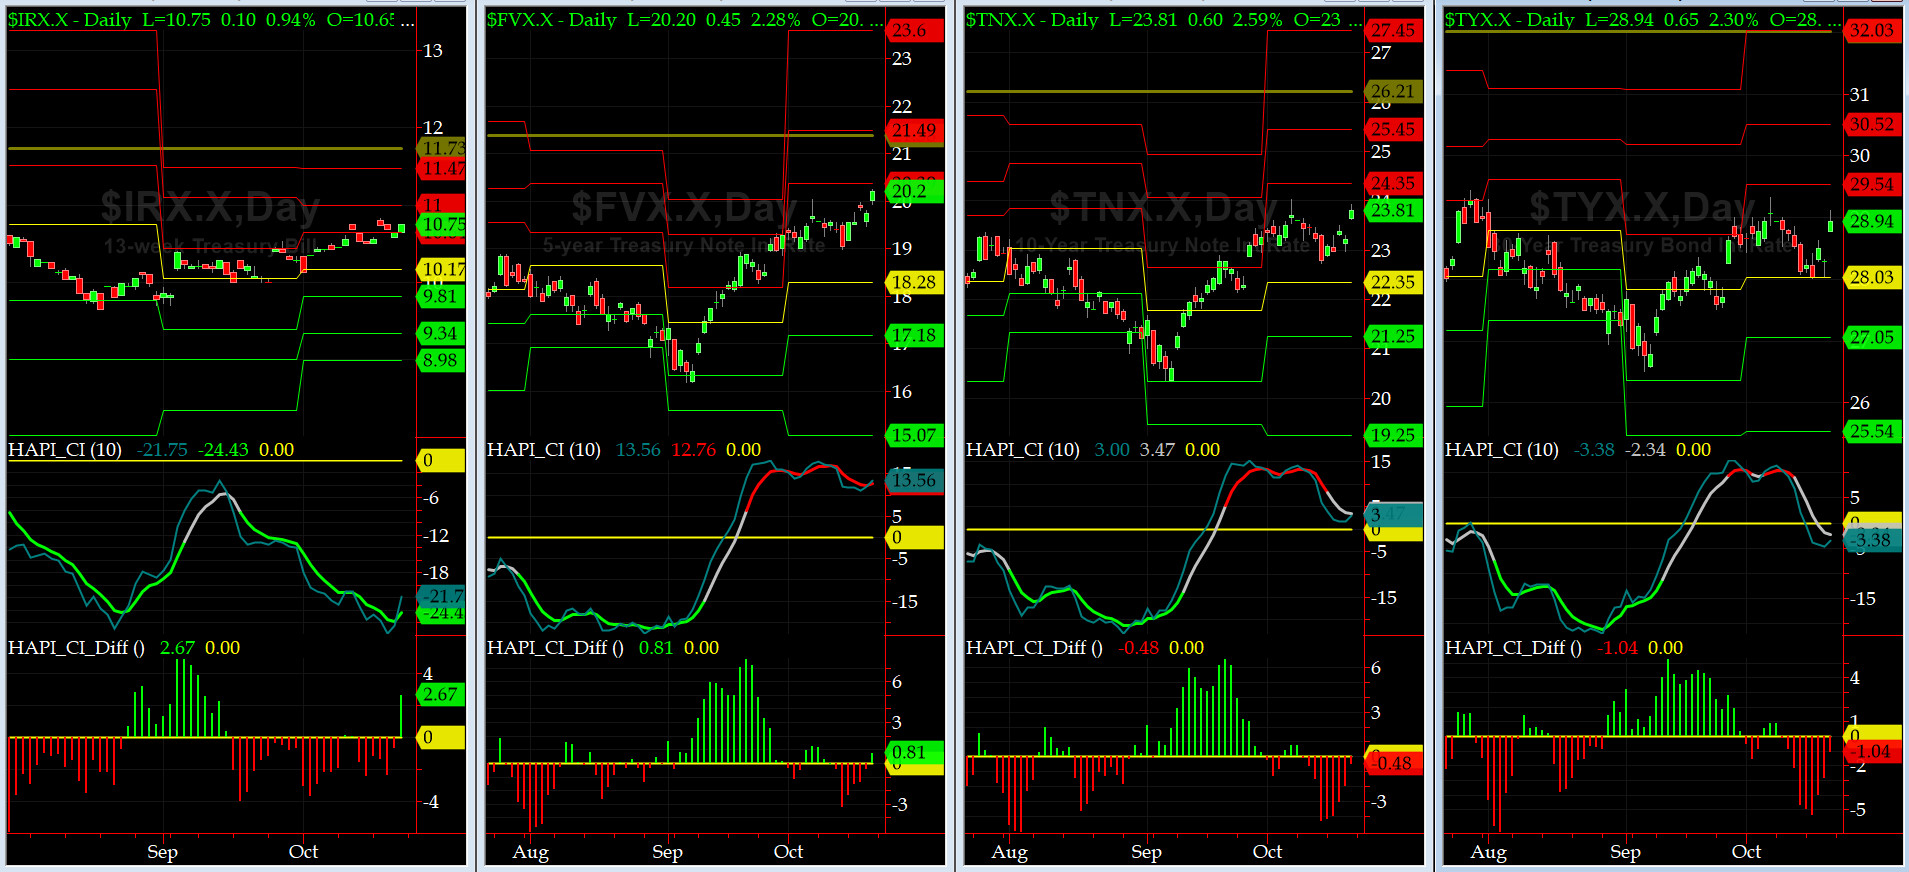
US Treasury T-Notes & T-Bonds Yields Chart
Our Treasury Market sold hard from Wednesday on and on Friday, the YTMs for Notes & Bonds adjusted up. The front end of the Yield Curve had a small up-tick.
Fari Hamzei
|
|
|
|
|
|
Sunday, October 22, 2017, 2030ET
Notice of Change of Bias with Timer Digest
Dear Jim,
I was away from my trading desk for the most of last Friday afternoon for a doc appt + late biz lunch. Today, after a full review of settlement data for indices, vols, market internals and our prop indicators, it is worth noting that once again, we are in uber overbought zones. The news-driven overnight spike (Senate vote on Federal Budget) on Thursday evening, managed to put us over our 1% loss limit with you.
In addition, this coming week is the third week of Q3 Earnings, arguably to some, as the most important trading week of the Fall. It is packed with mega caps stocks such as AMZN, BIDU, GOOGL, INTC, MSFT, XOM, CAT, CELG, BIIB, KO, BA, LMT & NOC.
Therefore, for now, we are covering our SHORT SPX bias with you and going LONG SPX.
Fari Hamzei
|
|
|
|
|
|
Customer Care:
|
|
|
|
|
|
|
 |
 |
|
 |
|
 |
 |
 |
HA YouTube Channel ::: HA Blog ::: Testimonials ::: Tutorials & FAQs ::: Privacy Policy
|
Trading Derivatives (Options & Futures) contains substantial risk and is not for every investor. An investor could potentially lose all or more than his/her initial investment.
Only risk capital should be used for trading and only those with sufficient risk capital should consider trading derivatives. Past performance is not
necessarily indicative of future results. Testimonials appearing on this website may not be representative of other clients or customers
and are not a guarantee of future performance or success.
|
| (c) 1998-2025, Hamzei Analytics, LLC.® All Rights Reserved. |
|
|