|
Sunday, November 26, 2017, 1745ET
Market Timing Charts, Analysis & Commentary for Issue #218
Timer Charts of S&P-500 Cash Index (SPX) + NASDAQ-100 Cash Index (NDX)
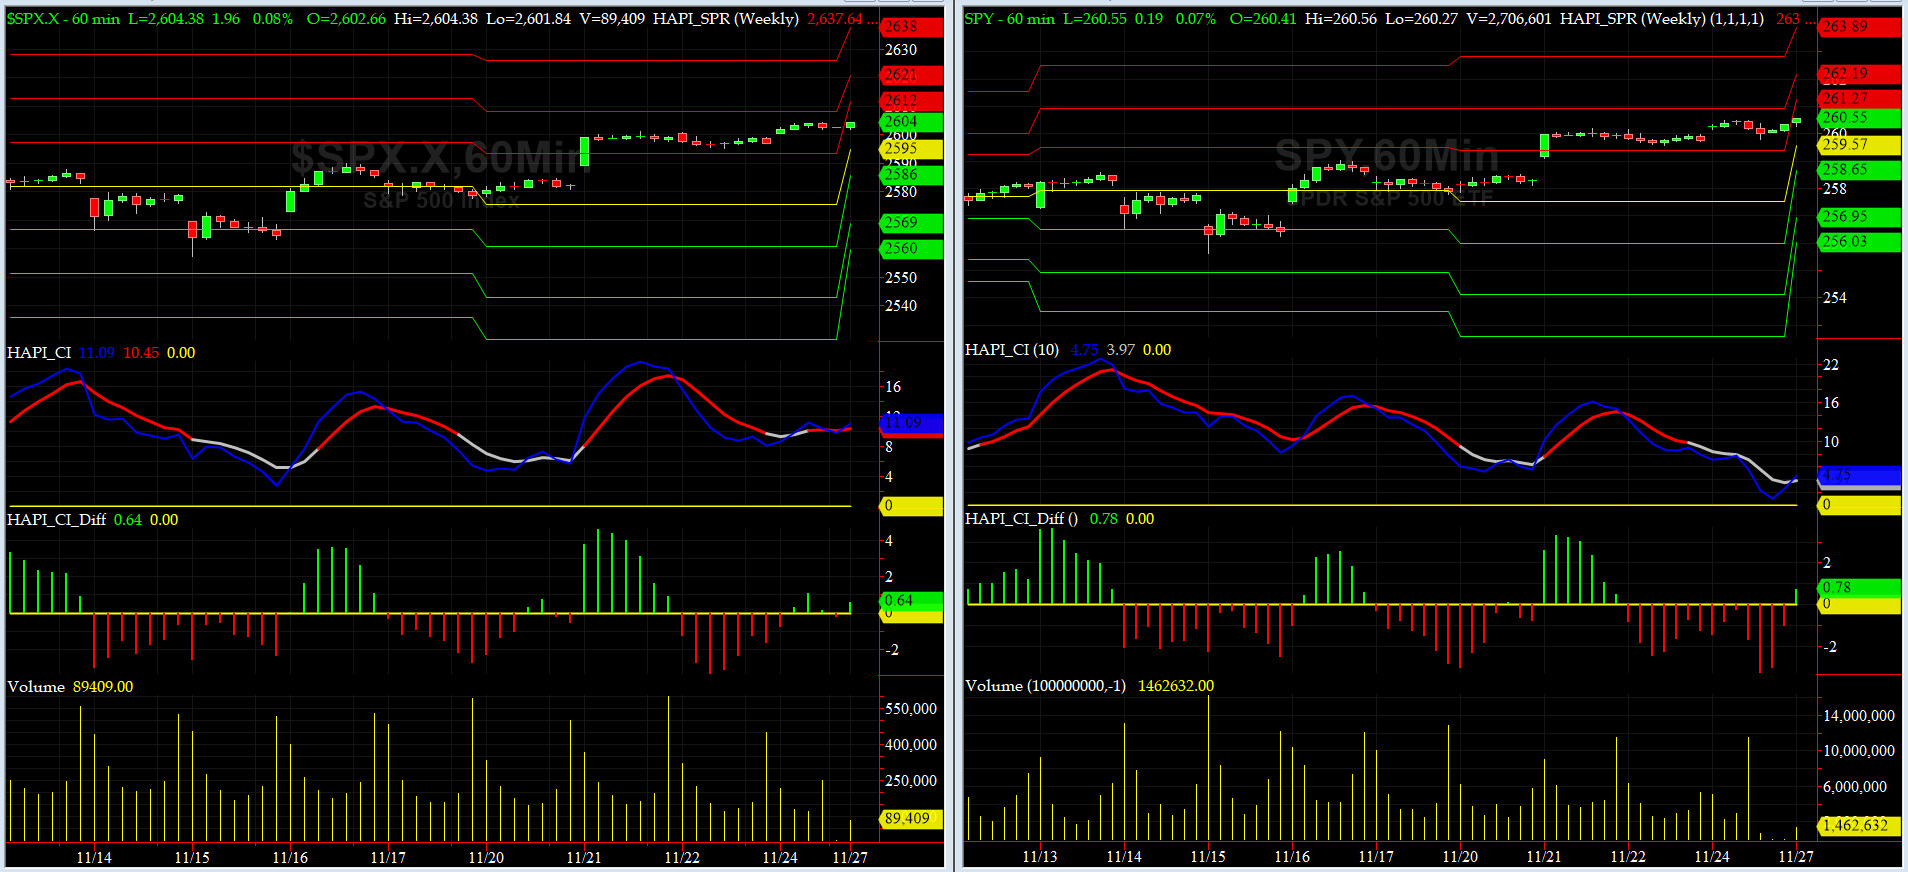
Most recent S&P-500 Cash Index (SPX): 2602.42 up +20.12 (up 0.78%) for the two weeks ending on Friday, November 24, 2017, which closed at its +2 sigma.
SPX ALL TIME INTRADAY HIGH = 2604.21(reached on Friday, Nov 24, 2017)
SPX ALL TIME CLOSING HIGH = 2602.42 (reached on Friday, Nov 24, 2017)
Current DAILY +2 Sigma SPX = 2603 with WEEKLY +2 Sigma = 2626
Current DAILY 0 Sigma (20 day MA) SPX = 2585 with WEEKLY 0 Sigma = 2496
Current DAILY -2 Sigma SPX = 2567 with WEEKLY -2 Sigma = 2400
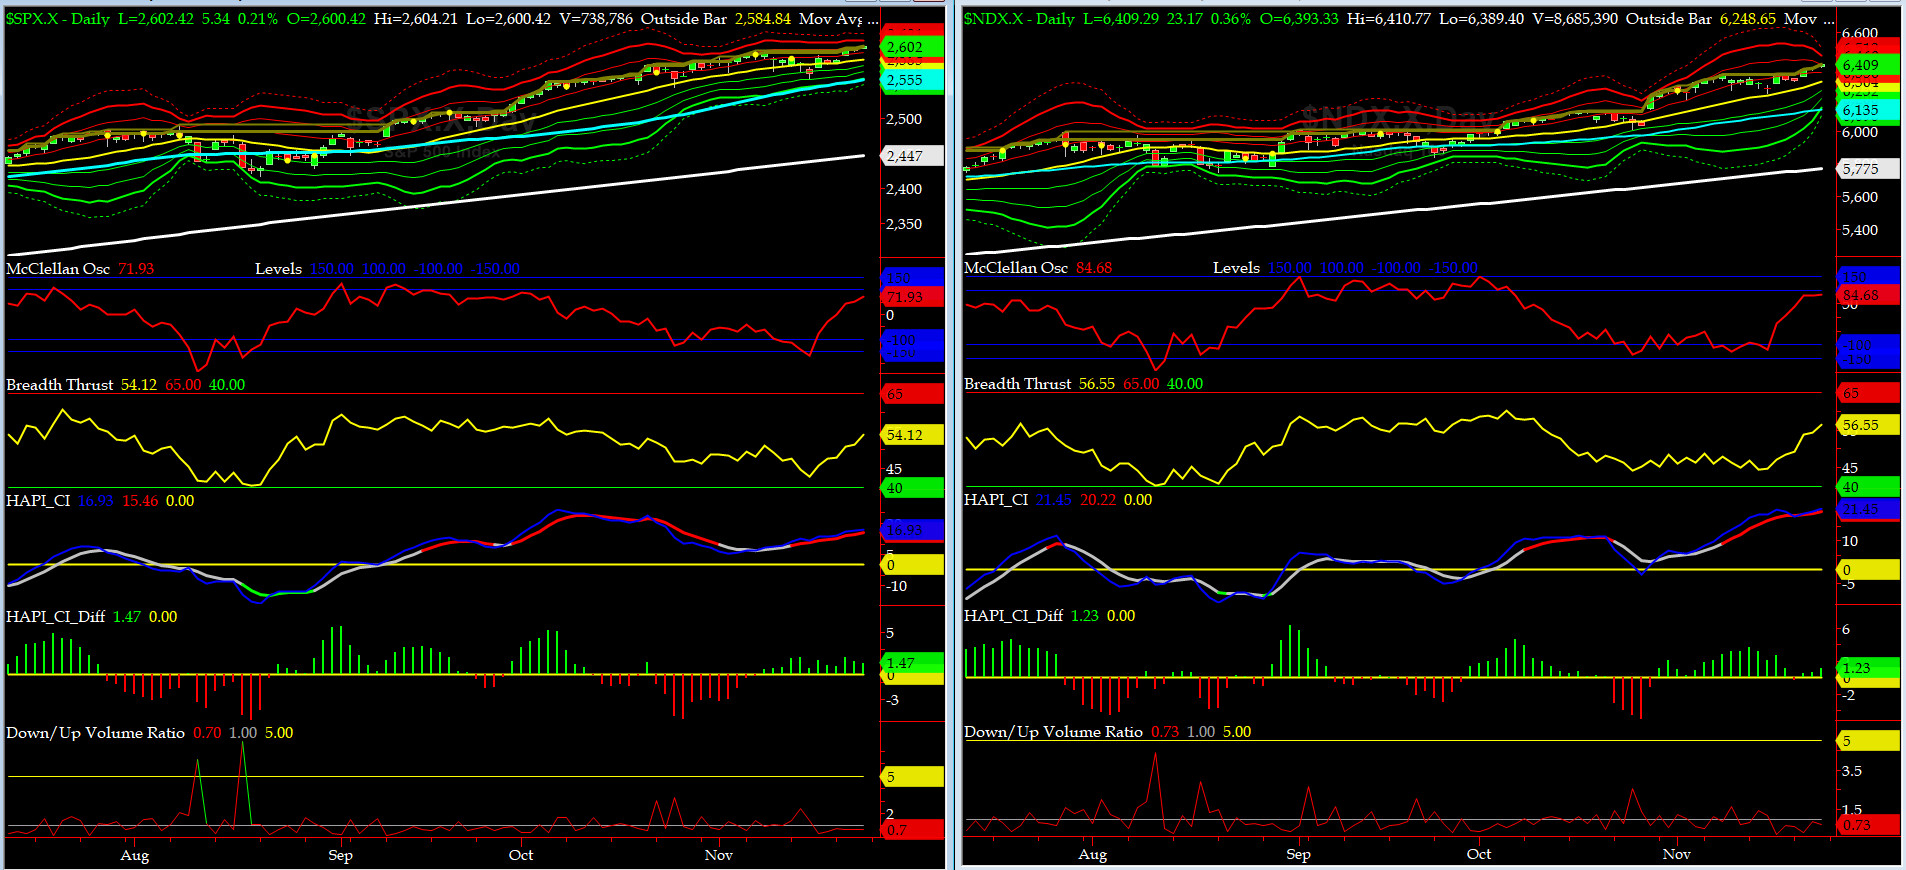
NYSE McClellan Oscillator = +72 (-150 is start of the O/S area; around -275 to -300 area or lower, we go into the �launch-pad� mode, over +150, we are in O/B area)
NYSE Breadth Thrust = 54 (40 is considered as oversold and 65 as overbought)
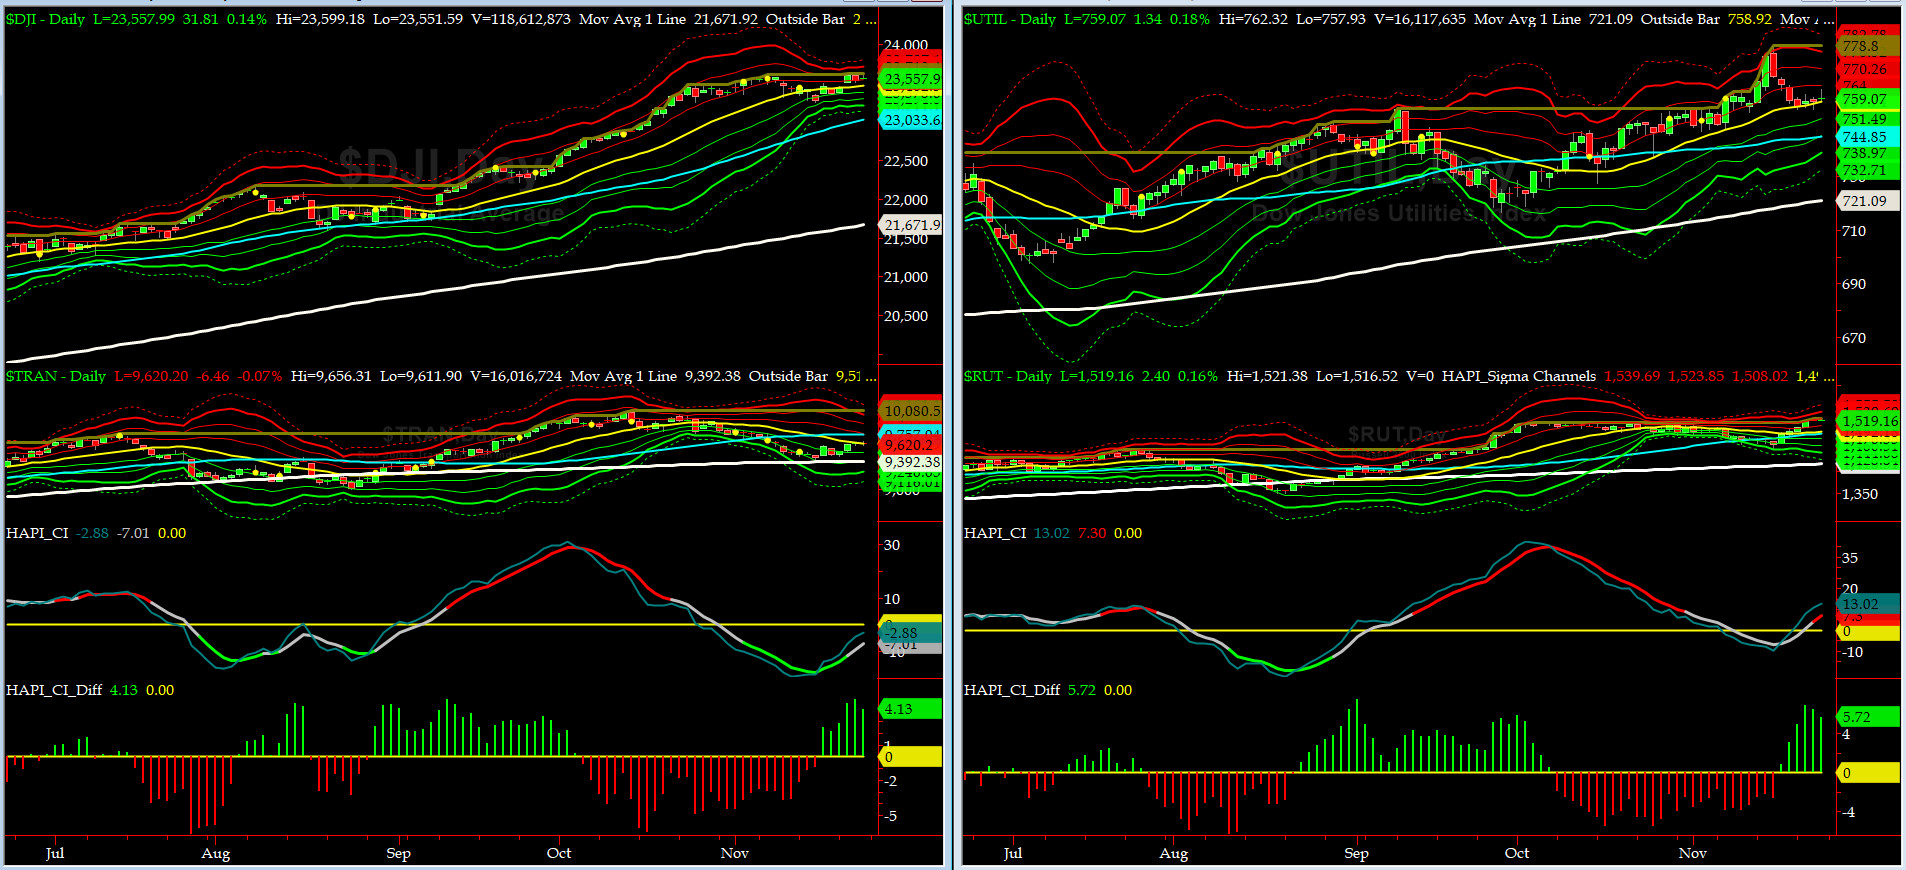
Canaries [in the Coal Mine] Chart for DJ TRAN & RUT Indices
200-Day MA DJ TRAN = 9392 or 2.4% above DJ TRAN (max observed in last 7 yrs = 20.2%, min = -20.3%)
200-Day MA RUT = 1418 or 7.1% above RUT (max observed in last 7 yrs = 21.3%, min = -22.6%)
DJ Transportation Index (proxy for economic conditions 6 to 9 months hence), as mentioned here in the last issue, almost tested its key support levels of 200DMA and then rallied up. 50DMA, at 9757, is the next key level to watch for.
Russell 2000 Small Caps Index (proxy for Risk ON/OFF) sold off a tad lower than its 50DMA, and then, rallied hard to a new ATH by Thanksgiving. RISK is ON again.
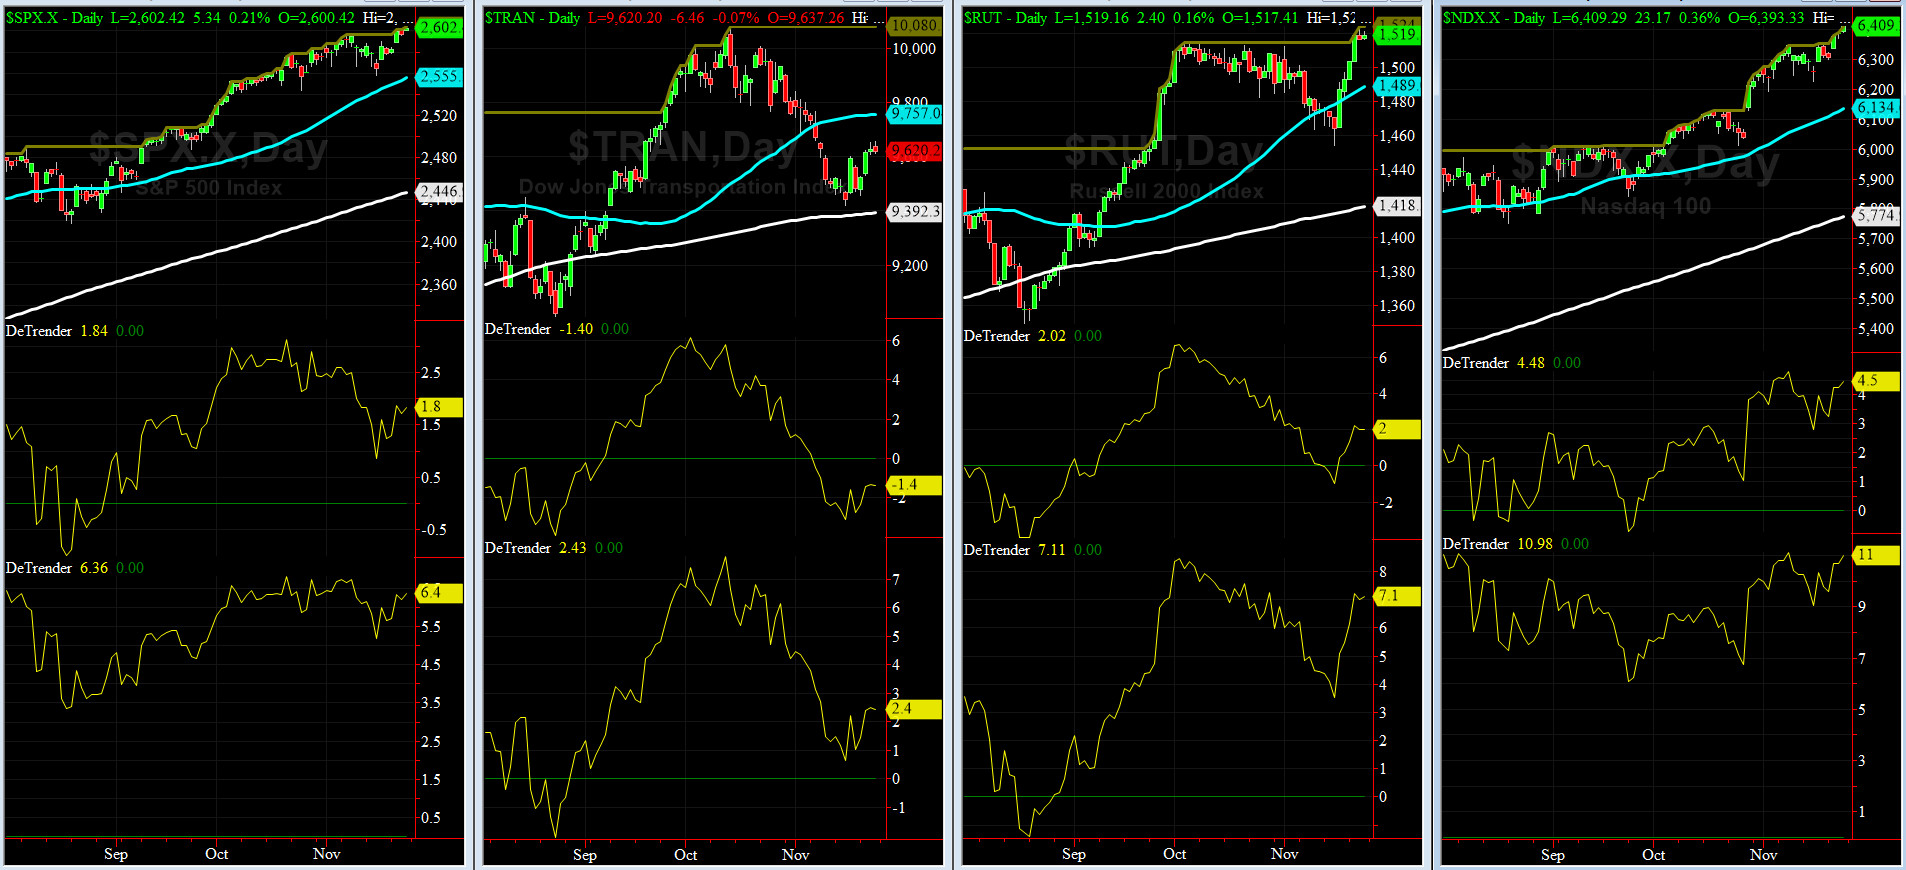
DeTrenders Charts for SPX, NDX, TRAN & RUT Indices
50-Day MA SPX = 2536 or 1.8% below SPX (max observed in last 7 yrs = +8.6%, min = -9.3%)
200-Day MA SPX = 2433 or 6.1% below SPX (max observed in last 7 yrs = 15.2%, min = -14%)
We now have SEVEN of our EIGHT DeTrenders in POSITIVE territory. The DeTrenders for DJ Tran & RUT will continue to be harbingers of future price behavior in broad indices.
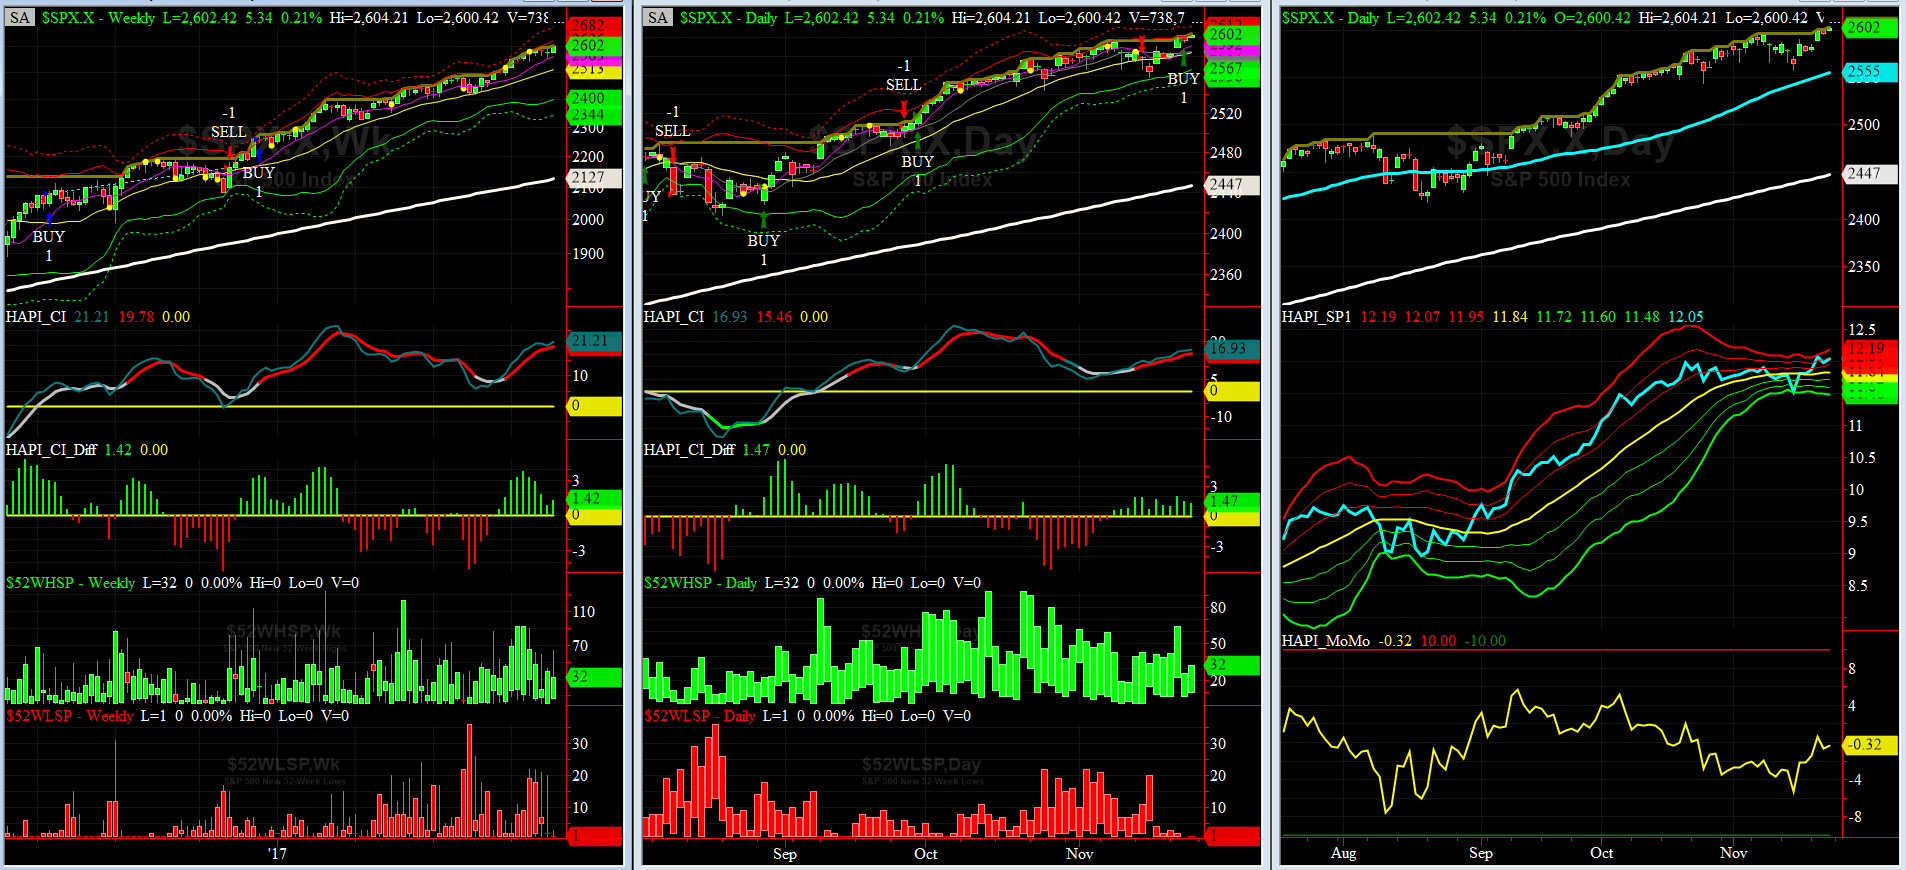
HA_SP1_Momo Chart
WEEKLY Timing Model = on a BUY Signal since Friday 12/16/16 CLOSE at 2258
DAILY Timing Model = on a BUY Signal since Wednesday 11/22/17 CLOSE at 2597
Max SPX 52wk-highs reading last week = 64 (over 120-140, the local maxima is in)
Max SPX 52wk-Lows reading last week = 3 (over 40-60, the local minima is in)
HA_SP1 closed near its +2 sigma channels
HA_Momo = -0.3 (reversals most likely occur above +10 or below -10)
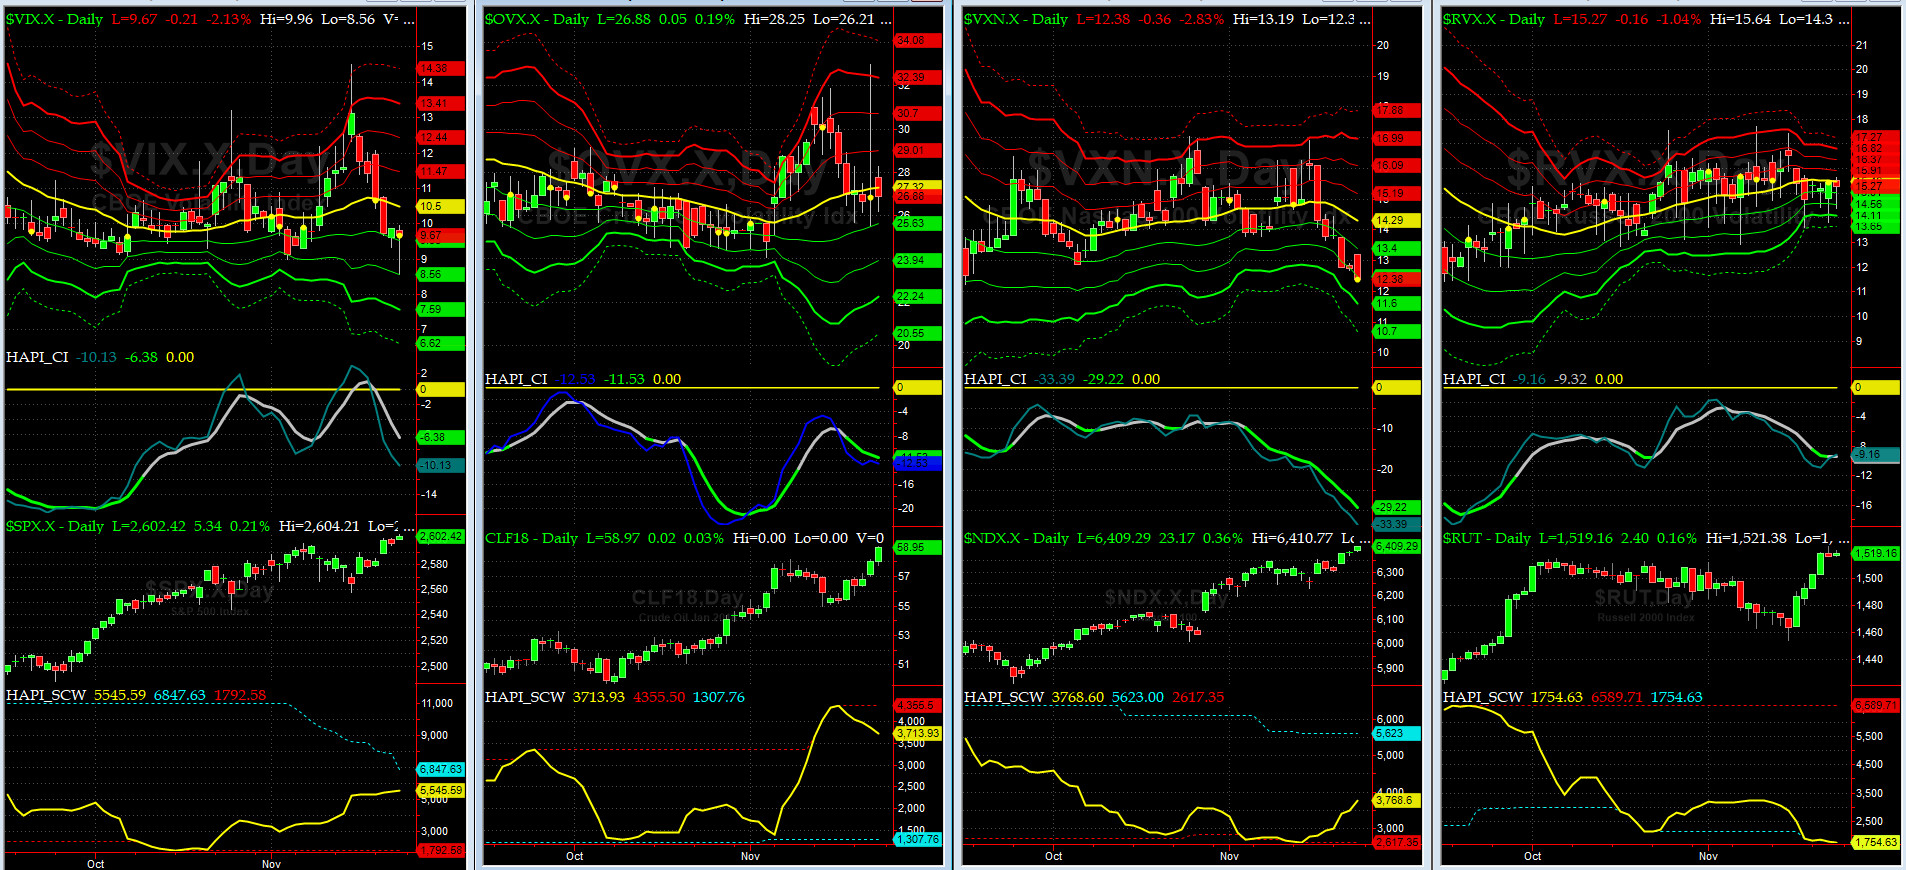
Vol of the Vols Chart
VIX currently stands at 9.67, at about its -1 sigma (remember it's the VIX volatility pattern ( its sigma channels) that matters, and not the level of VIX itself (this is per Dr. Robert Whaley, a great mentor and inventor of original VIX, now called VXO ). VIX usually peaks around a test of its +4 sigma).
In the last two weeks, VIX has sold off pretty hard from it +4 sigma (like magic) and registered 8.5 on Friday. This shockwave is OVER. CBOE needs another product... BitCoin Futures anyone? LOL
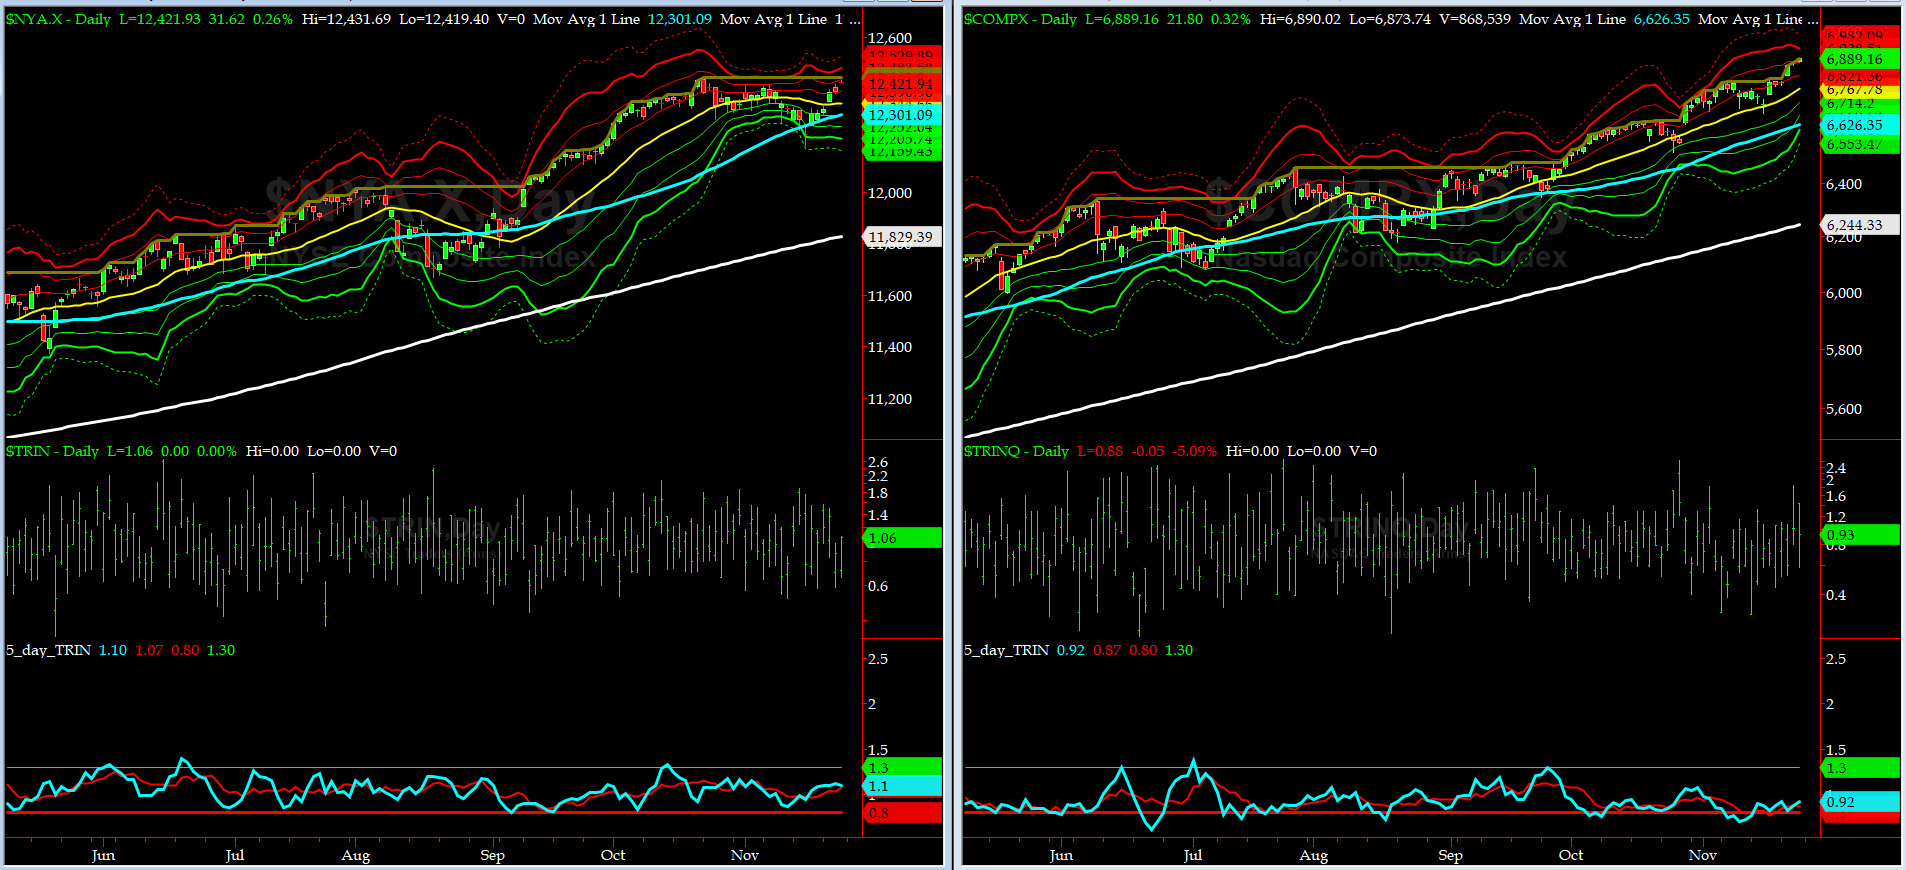
5-day TRIN & TRINQ Charts
Both NYSE & NASDAQ 5-day TRINs are in NEUTRAL zone -- no signal here.
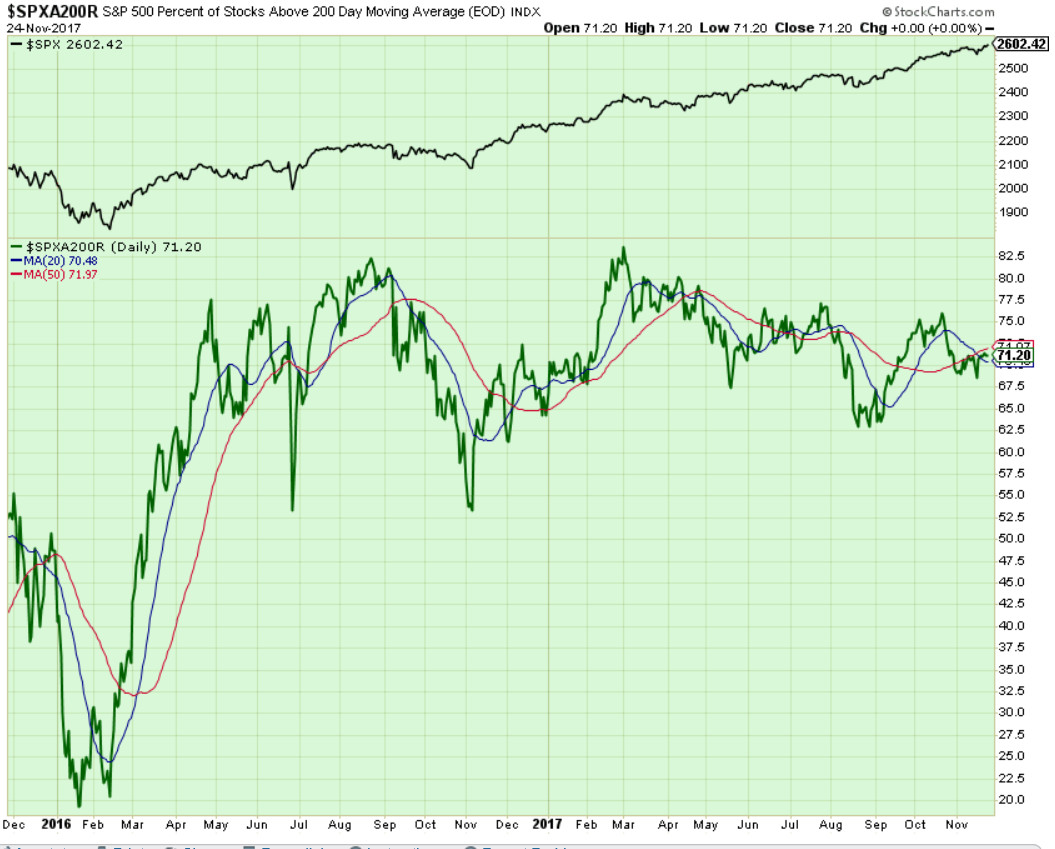
Components of SPX above their respective 200day MA Chart
This scoring indicator, after putting a number of divergences while SPX making new ATHs, in the last six months, is again fairly quiet here and should warrant our further close watch moving forward.
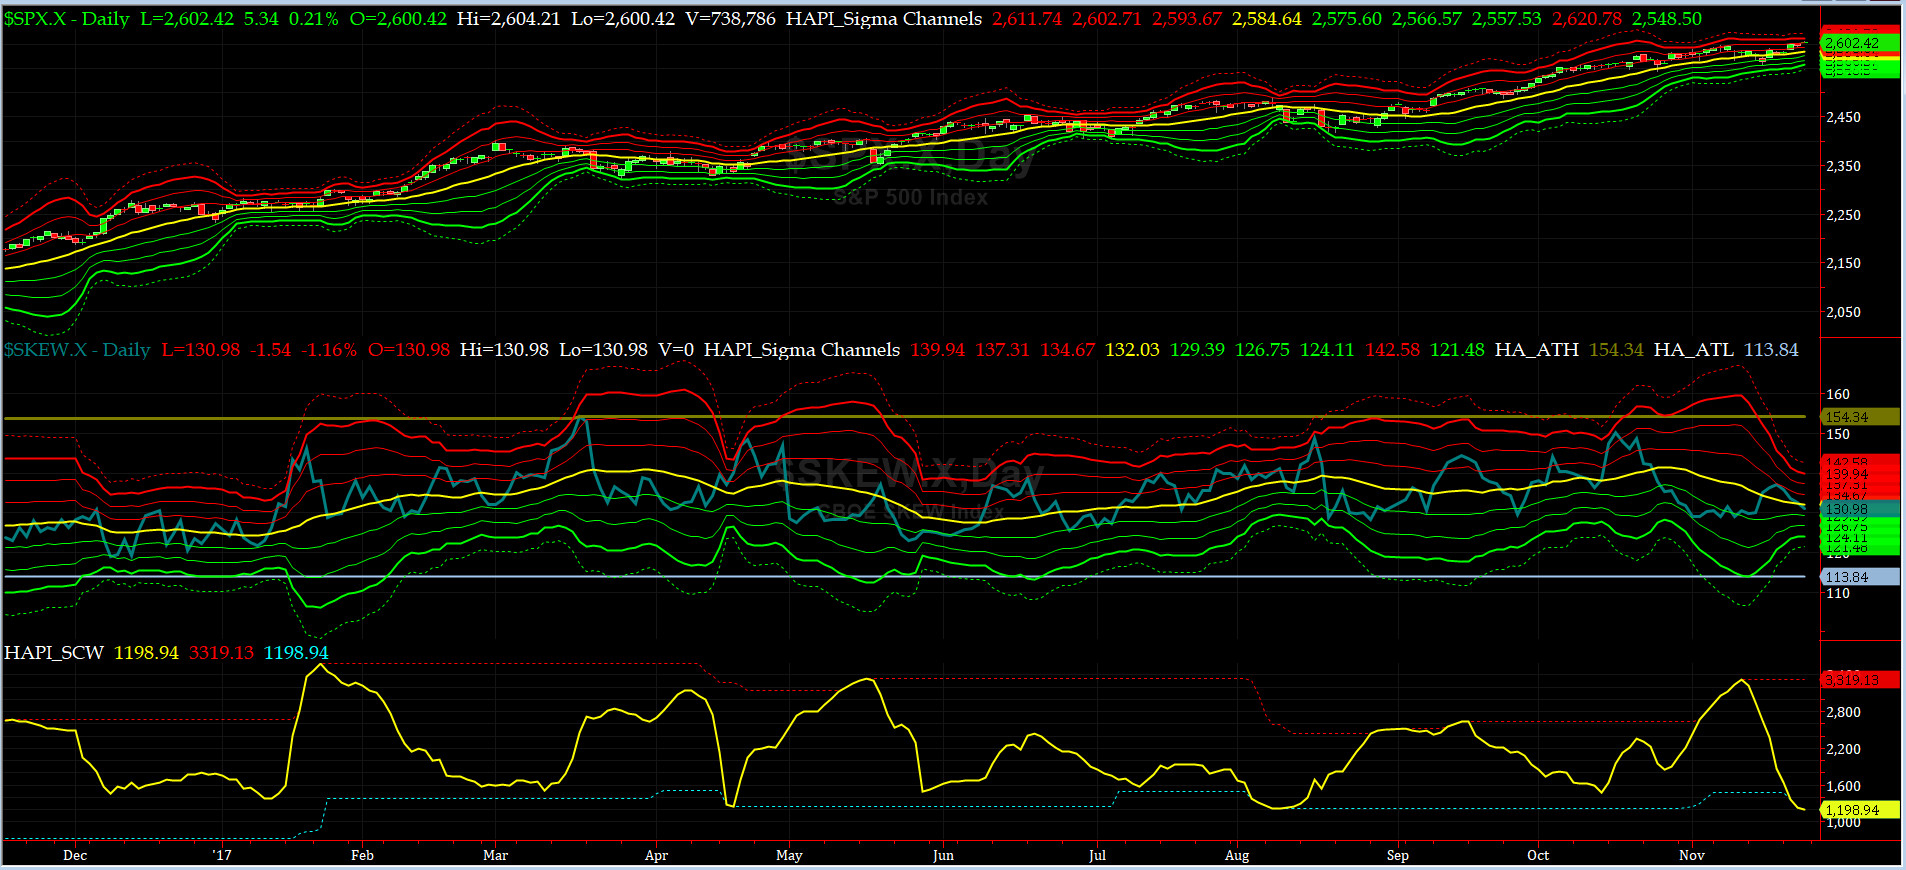
SPX SKEW (Tail Risk) Chart
Last week SPX SKEW (Tail Risk) closed at ~131, or about its zero sigma (normal = 120-125, range 100-150).
Is all quiet on the Eastern & Mid-Western Fronts? Smart Money thinks YES. And our very own, @Capt_Tiko, concurs. More Iced Tea? YES !!
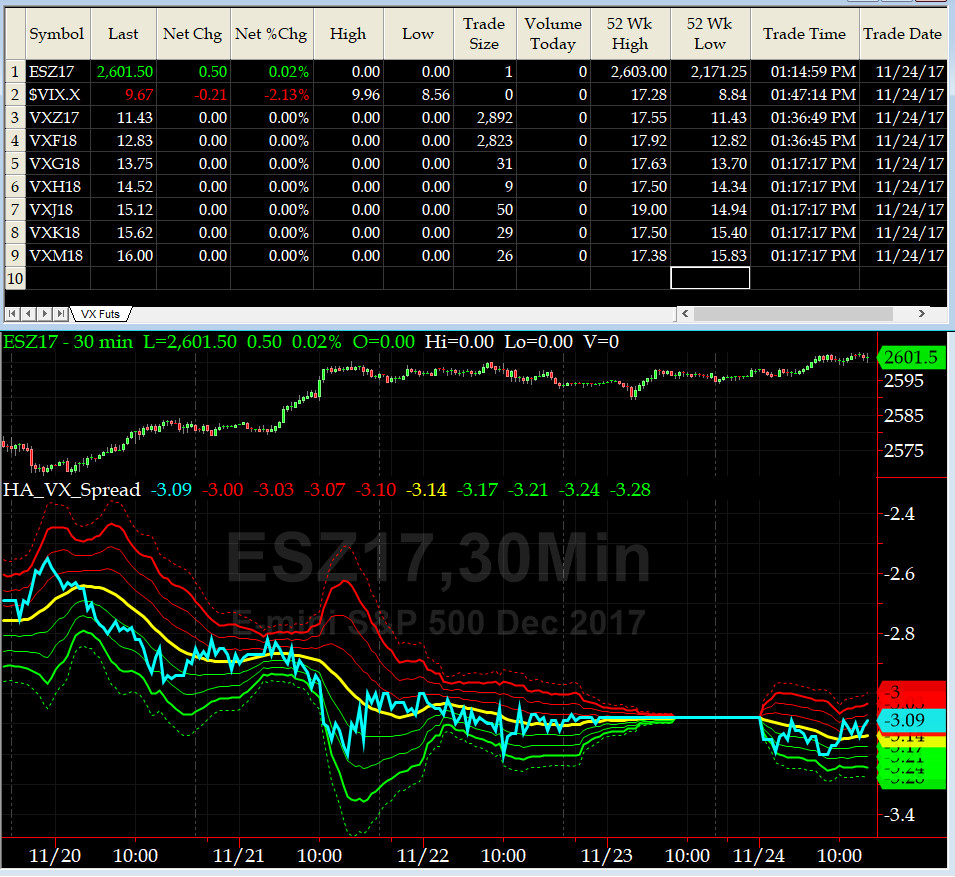
3-month VIX Futures Spread(VX) Chart
This timing indicator was fairly docile this holiday week and closed at -3.09. Equity markets are in short-term overbought zone.
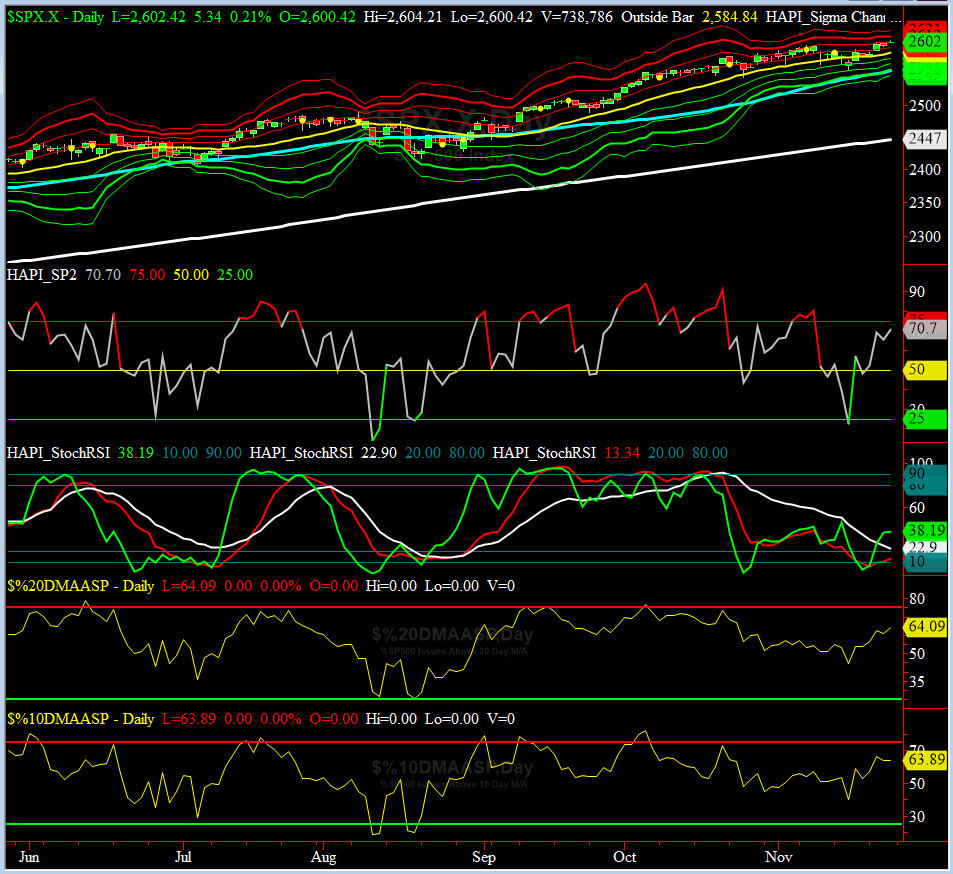
HA_SP2 Chart
HA_SP2 = 70.7 (Buy signal <= 25, Sell Signal >= 75)
Bravo to our favorite prop indicator. On the evening of Nov 15, it gave a buy signal at 22.4, we flipped from our shorts, and the rest as they say, is history. Currently, we are near a short-term overbought signal.
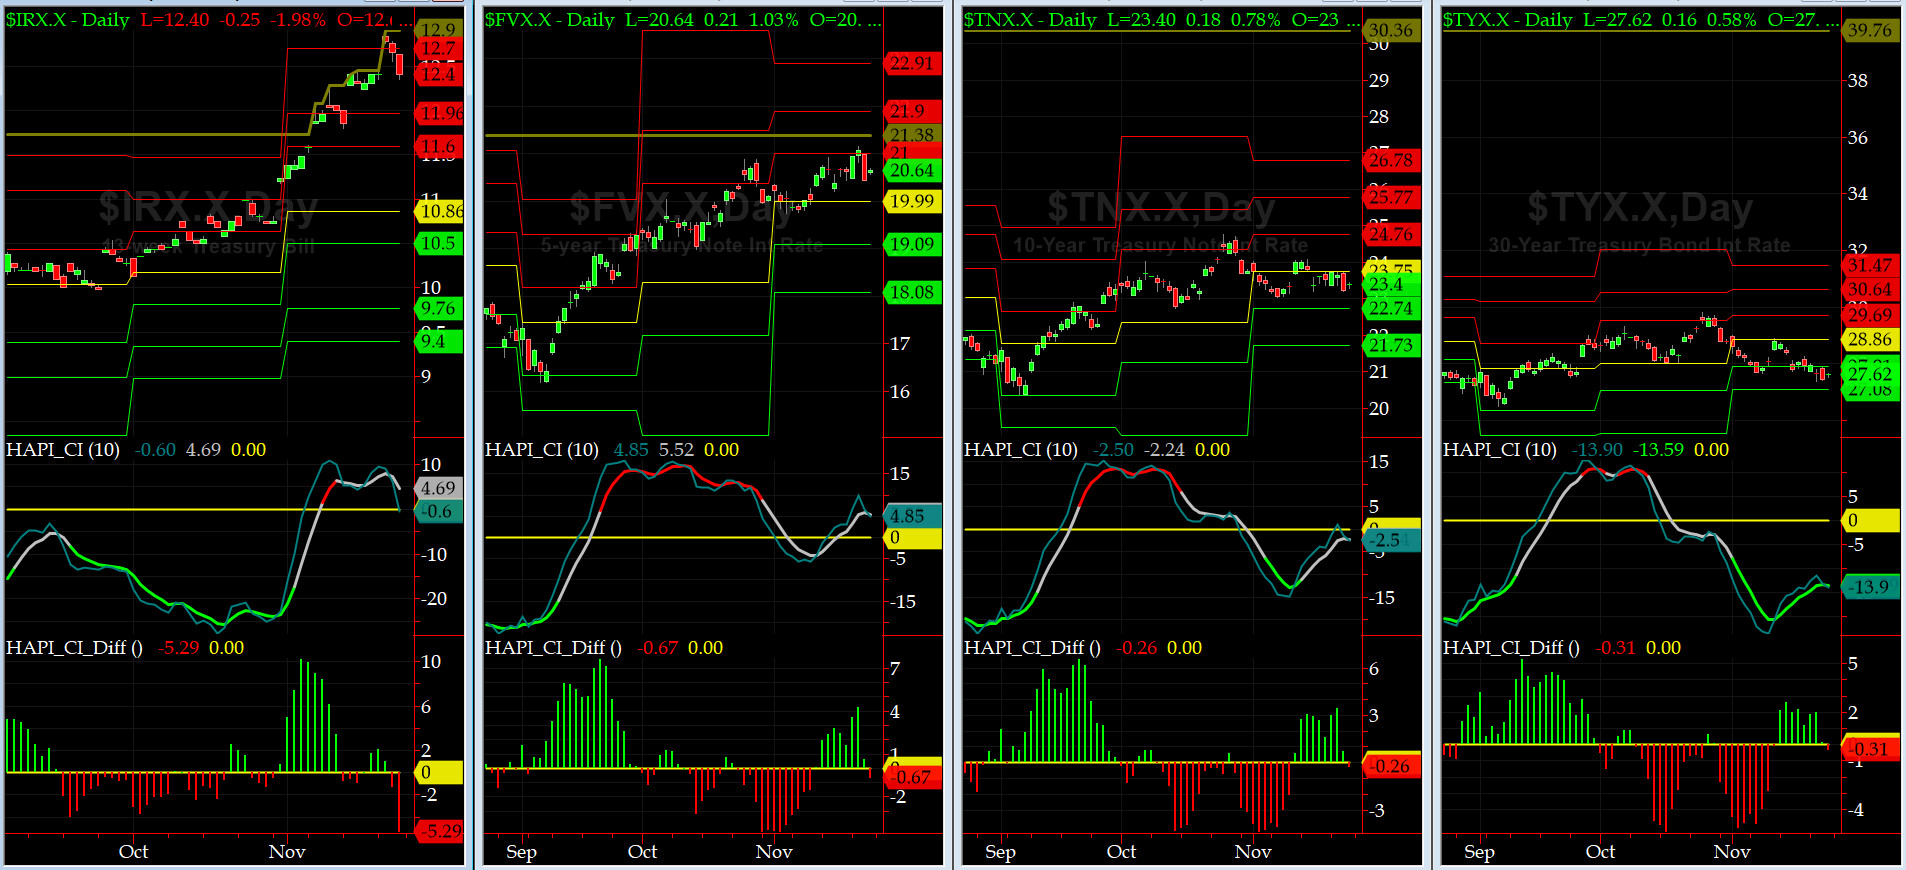
US Treasury T-Notes & T-Bonds Yields Chart
Our Treasury Market has gone nowhere fast as evidenced by sideway action in YTMs. Once Don Grumpino's Tax Plan gets to the Senate for a vote, then this chart becomes worth watching.
Fari Hamzei
|


 Proactive Market Timing