|
Sunday, December 10, 2017, 1100ET
Market Timing Charts, Analysis & Commentary for Issue #220
Timer Charts of S&P-500 Cash Index (SPX) + NASDAQ-100 Cash Index (NDX)
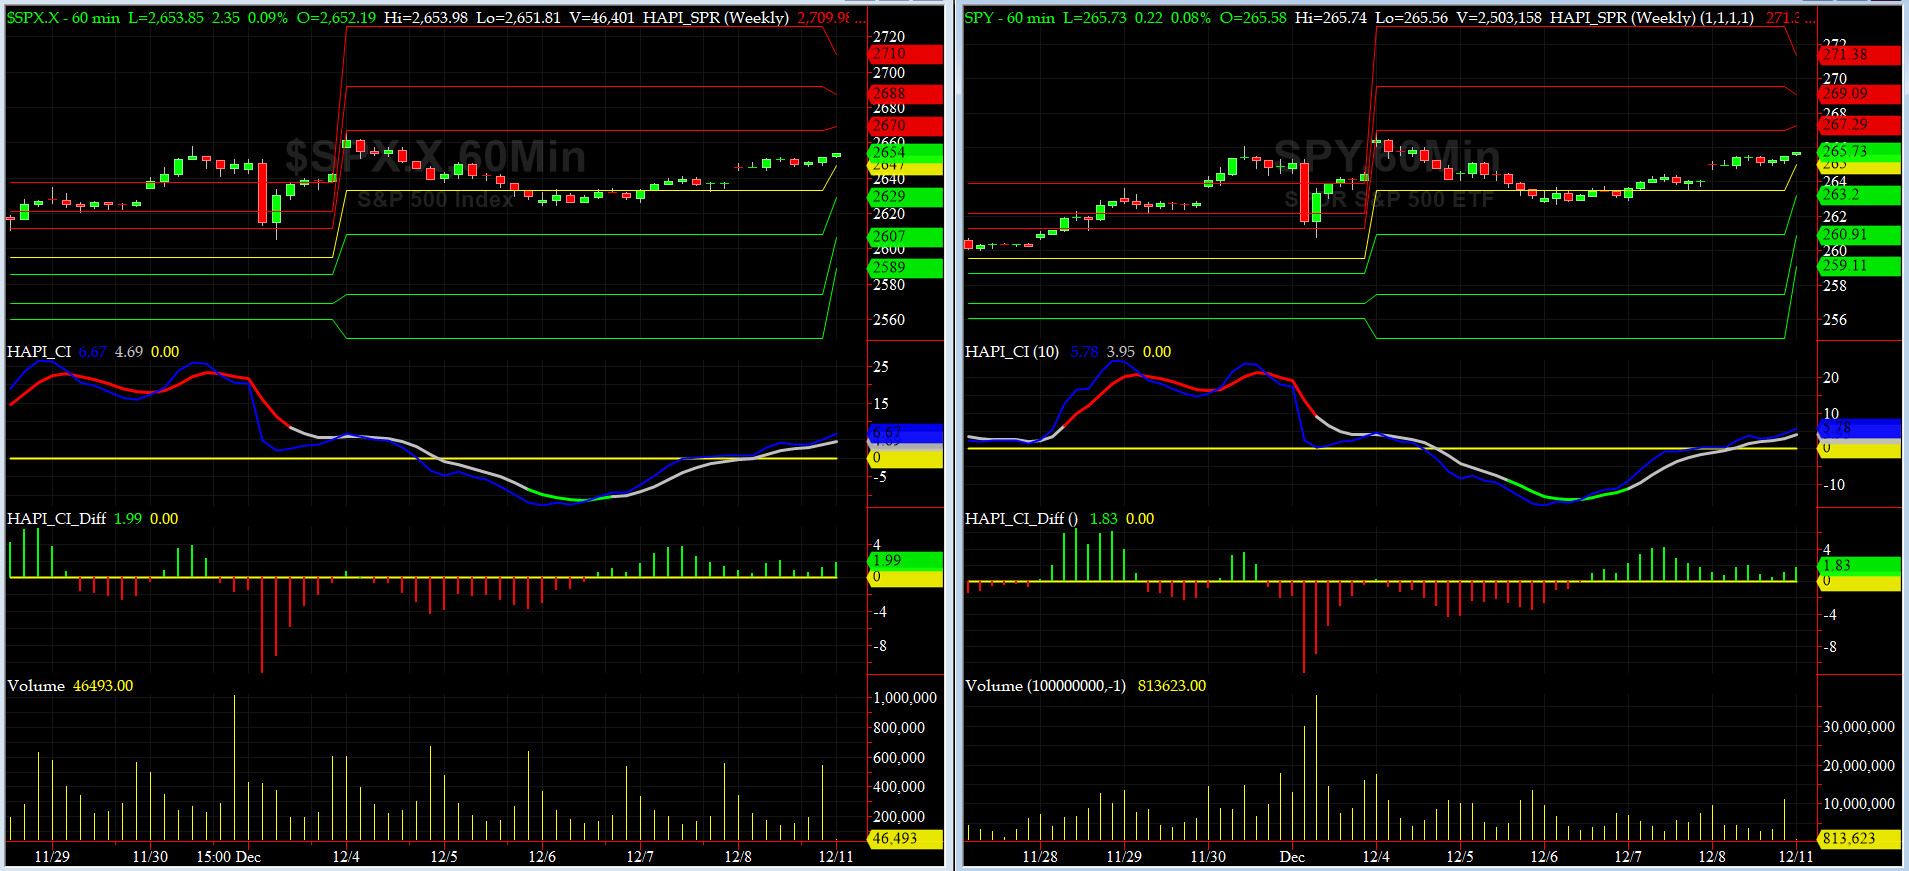
Most recent S&P-500 Cash Index (SPX): 2651.50 up +9.28 (up 1.53%) for the week ending on Friday, December 8, 2017, which closed at its +1.5 sigma.
SPX ALL TIME INTRADAY HIGH = 2665.19 (reached on Monday, Dec 4, 2017)
SPX ALL TIME CLOSING HIGH = 2651.50 (reached on Friday, Dec 8, 2017)
Current DAILY +2 Sigma SPX = 2663 with WEEKLY +2 Sigma = 2664
Current DAILY 0 Sigma (20 day MA) SPX = 2609 with WEEKLY 0 Sigma = 2531
Current DAILY -2 Sigma SPX = 2556 with WEEKLY -2 Sigma = 2398
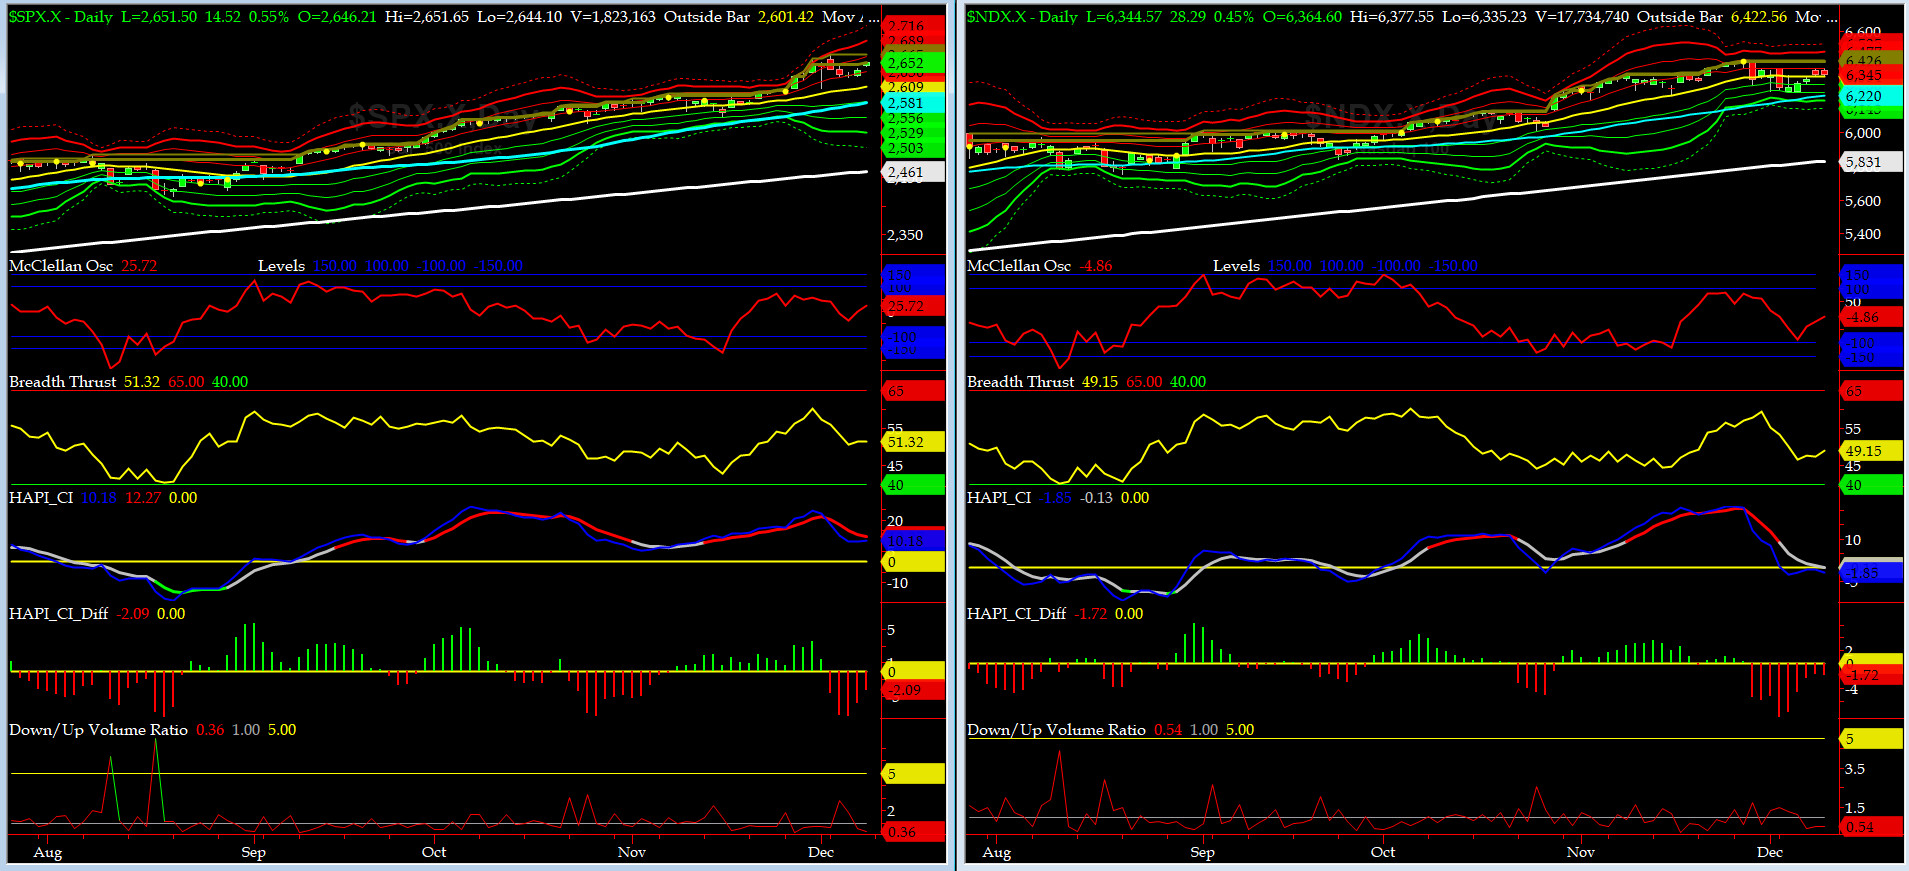
NYSE McClellan Oscillator = +25.7 (-150 is start of the O/S area; around -275 to -300 area or lower, we go into the �launch-pad� mode, over +150, we are in O/B area)
NYSE Breadth Thrust = 51.3 (40 is considered as oversold and 65 as overbought)
Another week of Washington drama gave us some volatility but it was short lived. Bob Mueller is not done yet. Stay tuned.
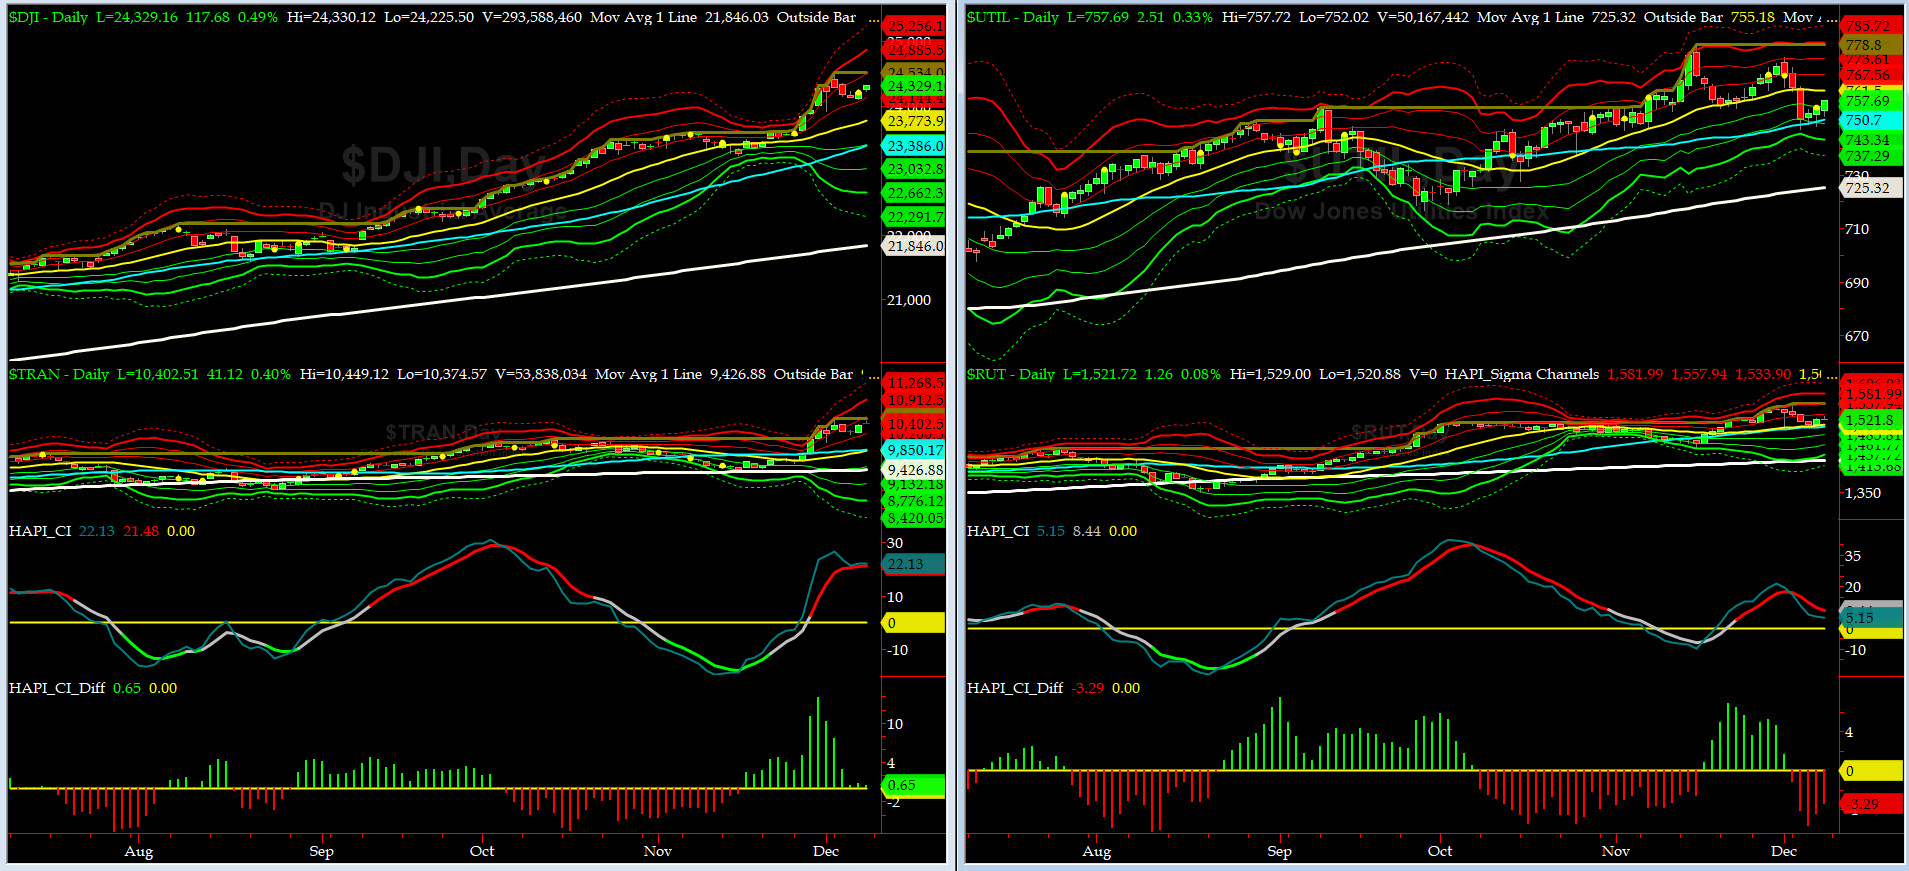
Canaries [in the Coal Mine] Chart for DJ TRAN & RUT Indices
200-Day MA DJ TRAN = 9426 or 10.3% above DJ TRAN (max observed in last 7 yrs = 20.2%, min = -20.3%)
200-Day MA RUT = 1424 or 6.8% above RUT (max observed in last 7 yrs = 21.3%, min = -22.6%)
DJ Transportation Index (proxy for economic conditions 6 to 9 months hence) slowed down and did some back and fill. New ATHs ahead? we think so.
Russell 2000 Small Caps Index (proxy for Risk ON/OFF) sold off a tad but nothing to write home about. RISK is definitely still ON.
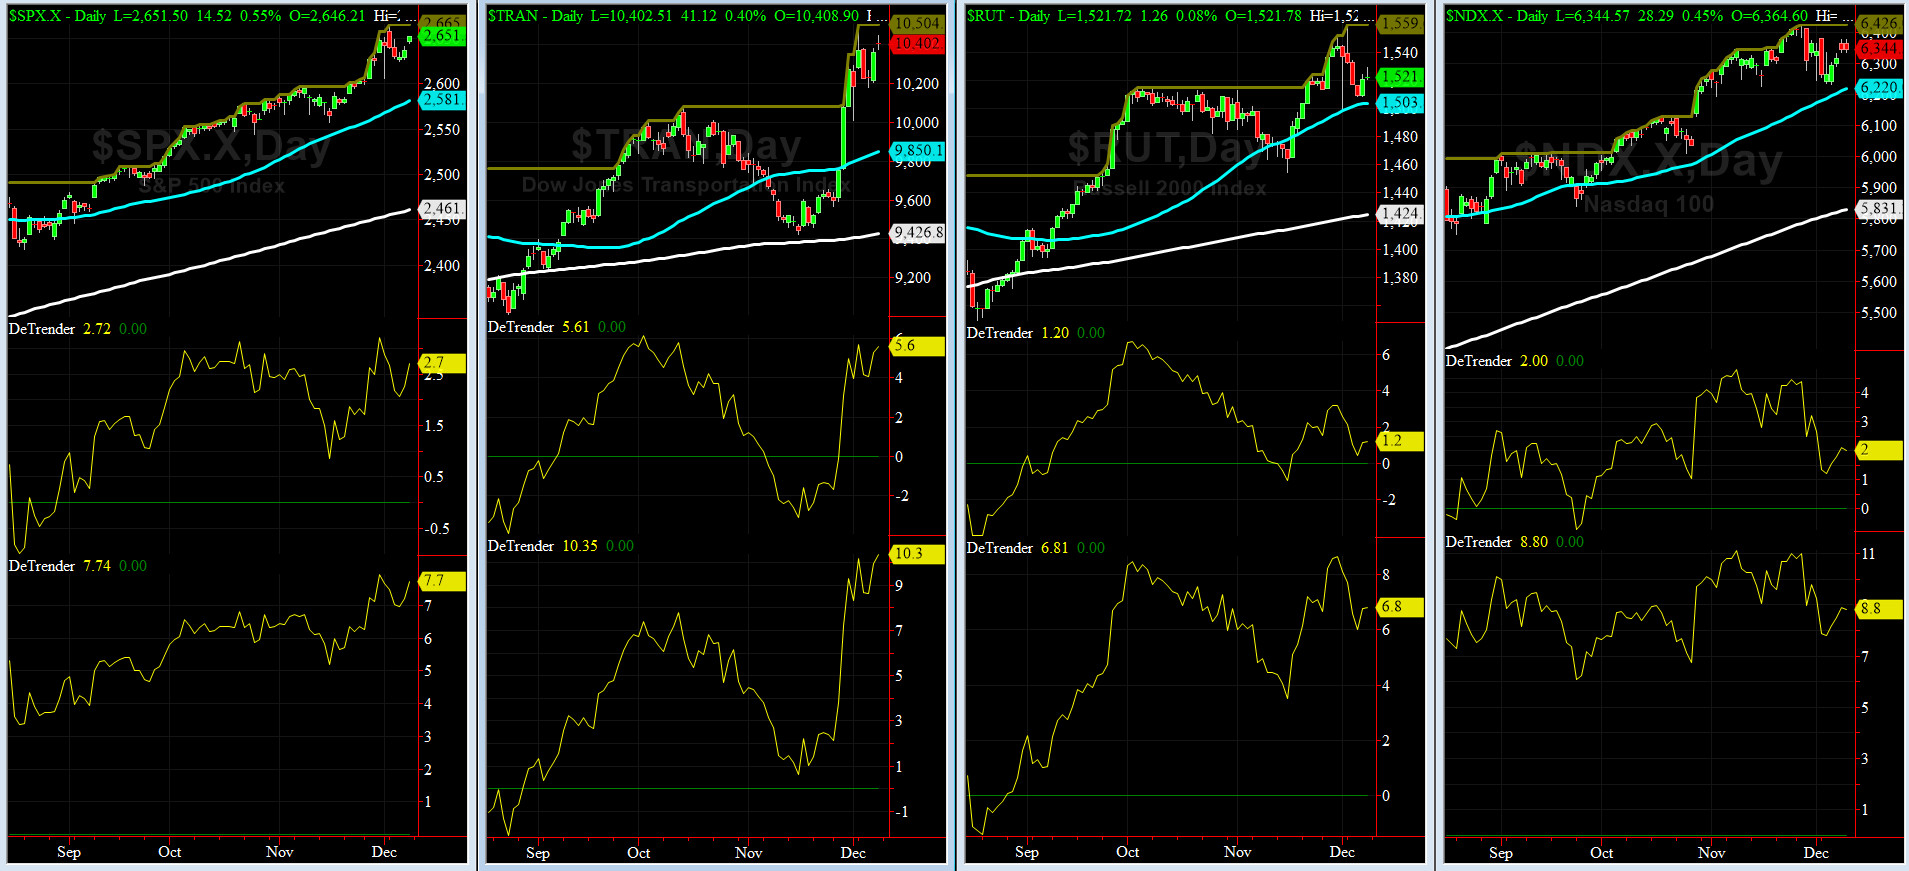
DeTrenders Charts for SPX, NDX, TRAN & RUT Indices
50-Day MA SPX = 2567 or 2.9% below SPX (max observed in last 7 yrs = +8.6%, min = -9.3%)
200-Day MA SPX = 2454 or 7.7% below SPX (max observed in last 7 yrs = 15.2%, min = -14%)
Once again, all of our EIGHT DeTrenders are in POSITIVE territory. The DeTrenders for DJ Tran & RUT will continue to be harbingers of future price behavior in broad indices.
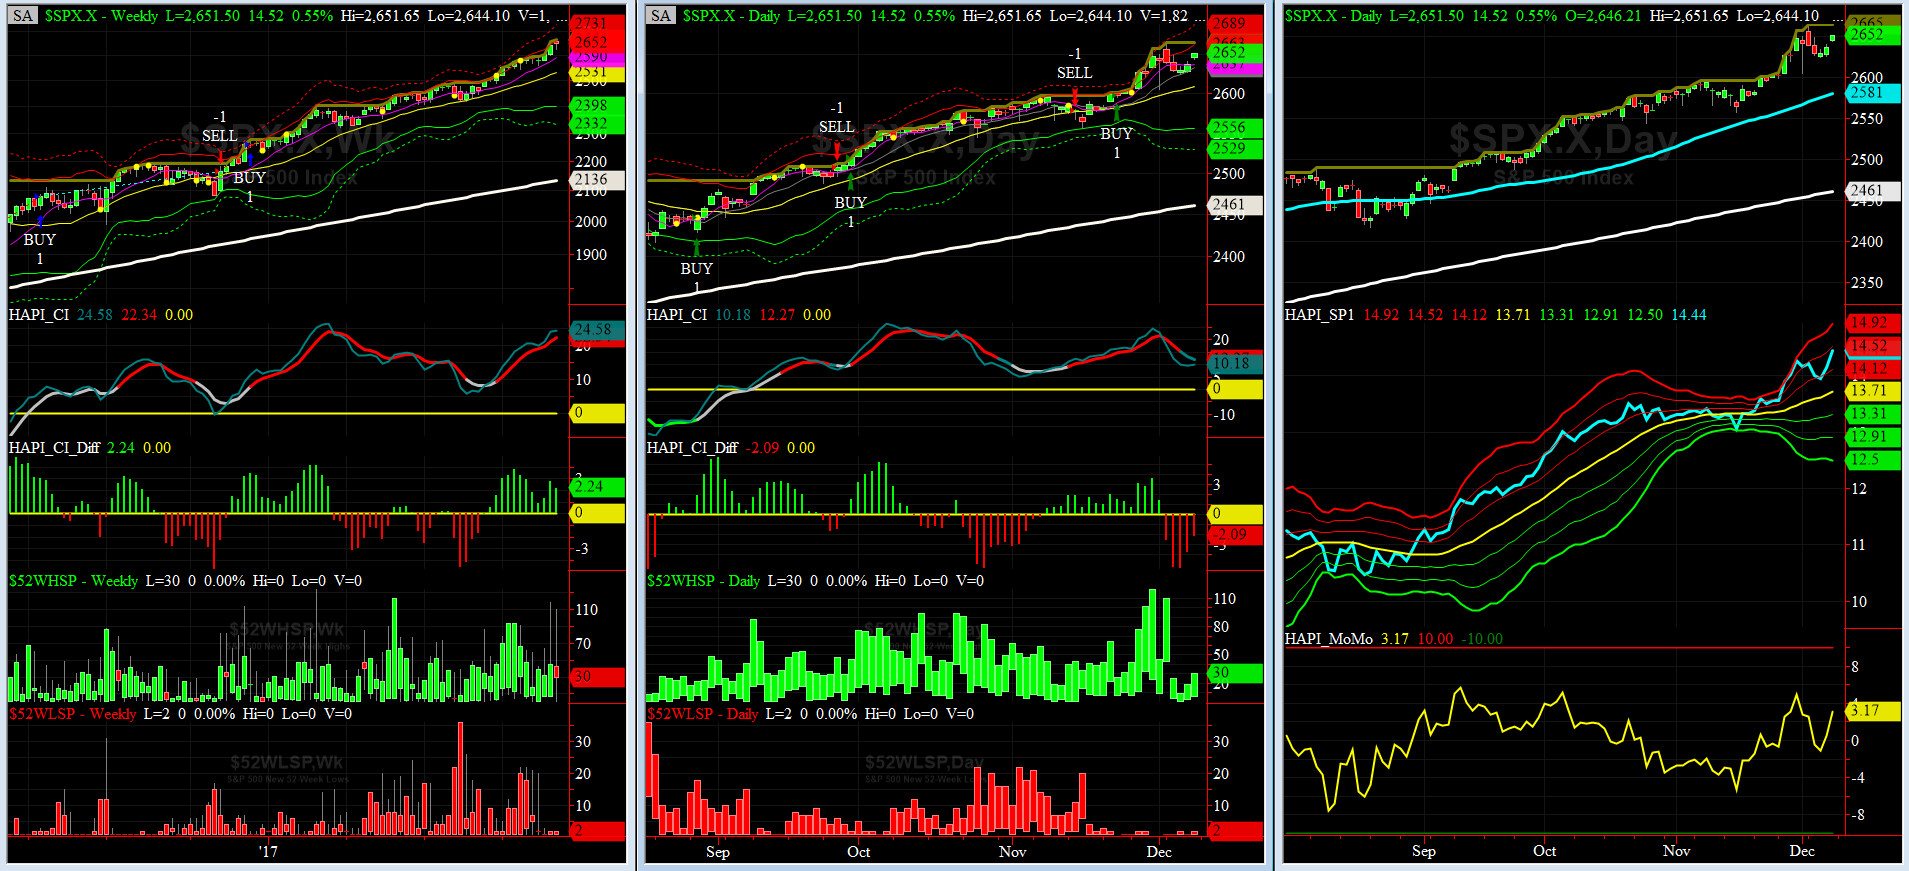
HA_SP1_Momo Chart
WEEKLY Timing Model = on a BUY Signal since Friday 12/16/16 CLOSE at 2258
DAILY Timing Model = on a BUY Signal since Wednesday 11/22/17 CLOSE at 2597
Max SPX 52wk-highs reading last week = 110 (over 120-140, the local maxima is in)
Max SPX 52wk-Lows reading last week = 2 (over 40-60, the local minima is in)
HA_SP1 closed near its +2 sigma channels
HA_Momo = +3.2 (reversals most likely occur above +10 or below -10)
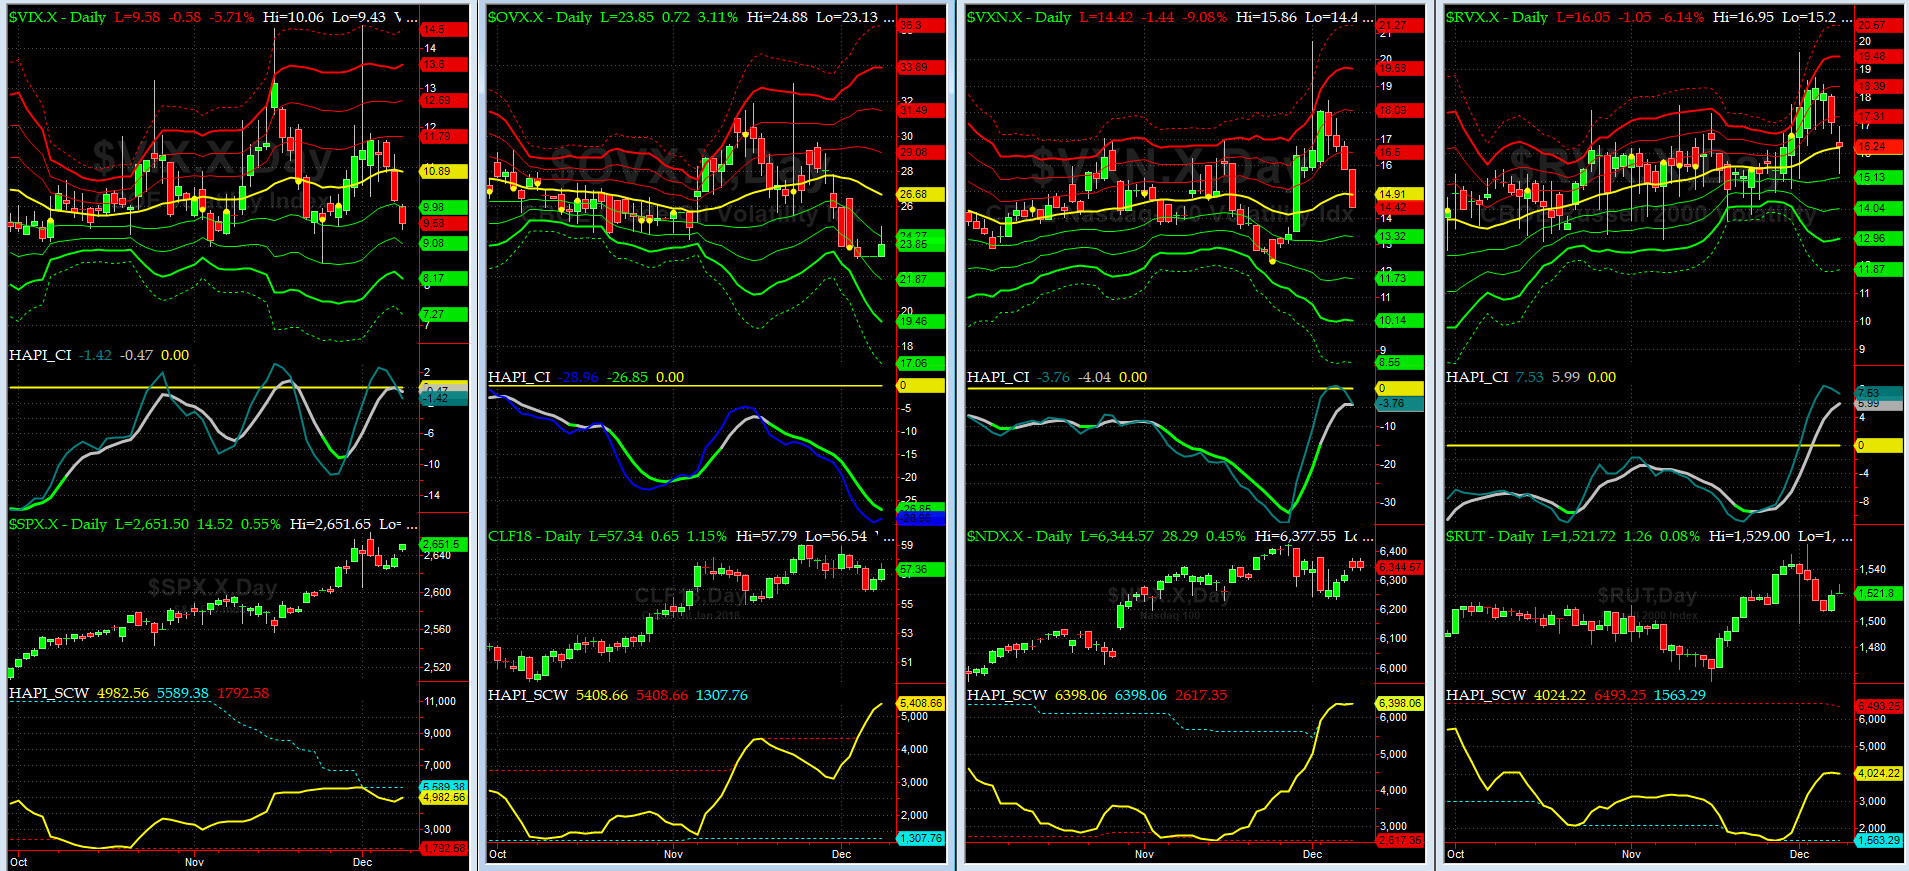
Vol of the Vols Chart
VIX currently stands at 9.58, at about its +1 sigma (remember it's the VIX volatility pattern ( its sigma channels) that matters, and not the level of VIX itself (this is per Dr. Robert Whaley, a great mentor and inventor of original VIX, now called VXO ). VIX usually peaks around a test of its +4 sigma).
CBOE should be dusting its plans for her G0oFundMe page....(with VIX this low and if BitCoin fails - starts trading tonight on CFE).

5-day TRIN & TRINQ Charts
NYSE 5-day TRIN is in the NEUTRAL zone but its NASDAQ brethren is in SELL mode again.
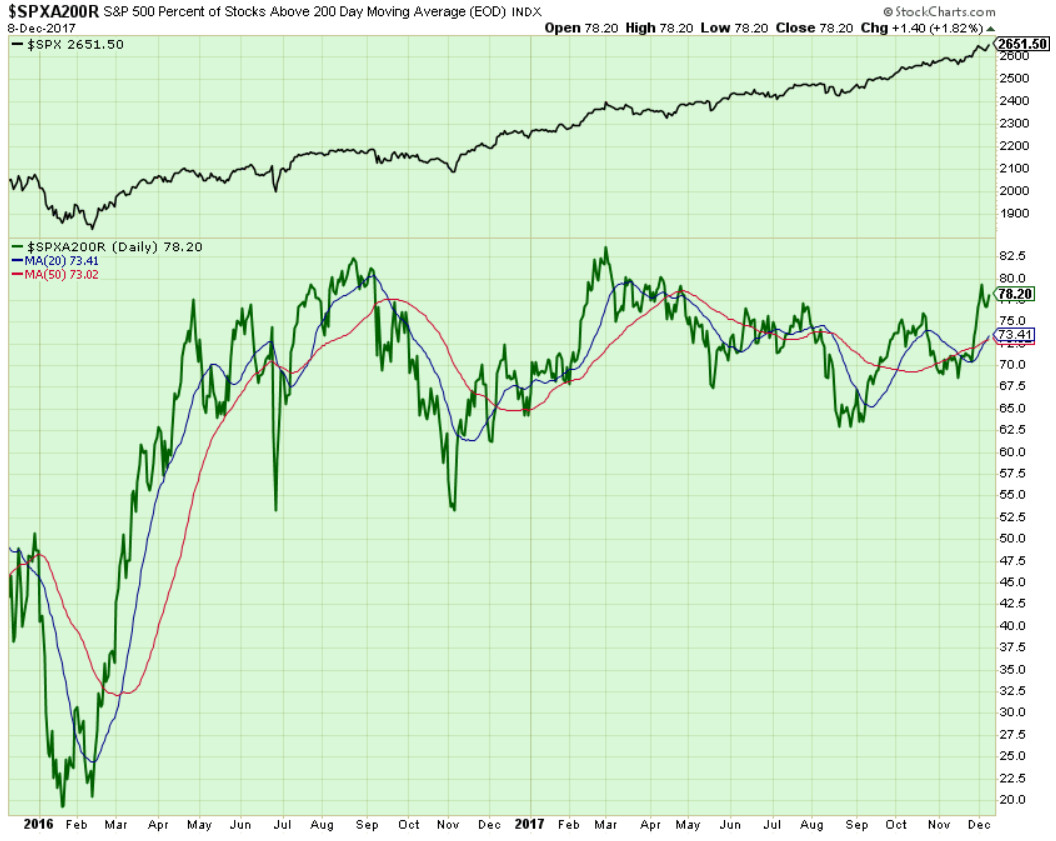
Components of SPX above their respective 200day MA Chart
This scoring indicator, after a very strong week, pulled back after hitting 80% and then closed the week at 78.20. We expect to see 85% soon.
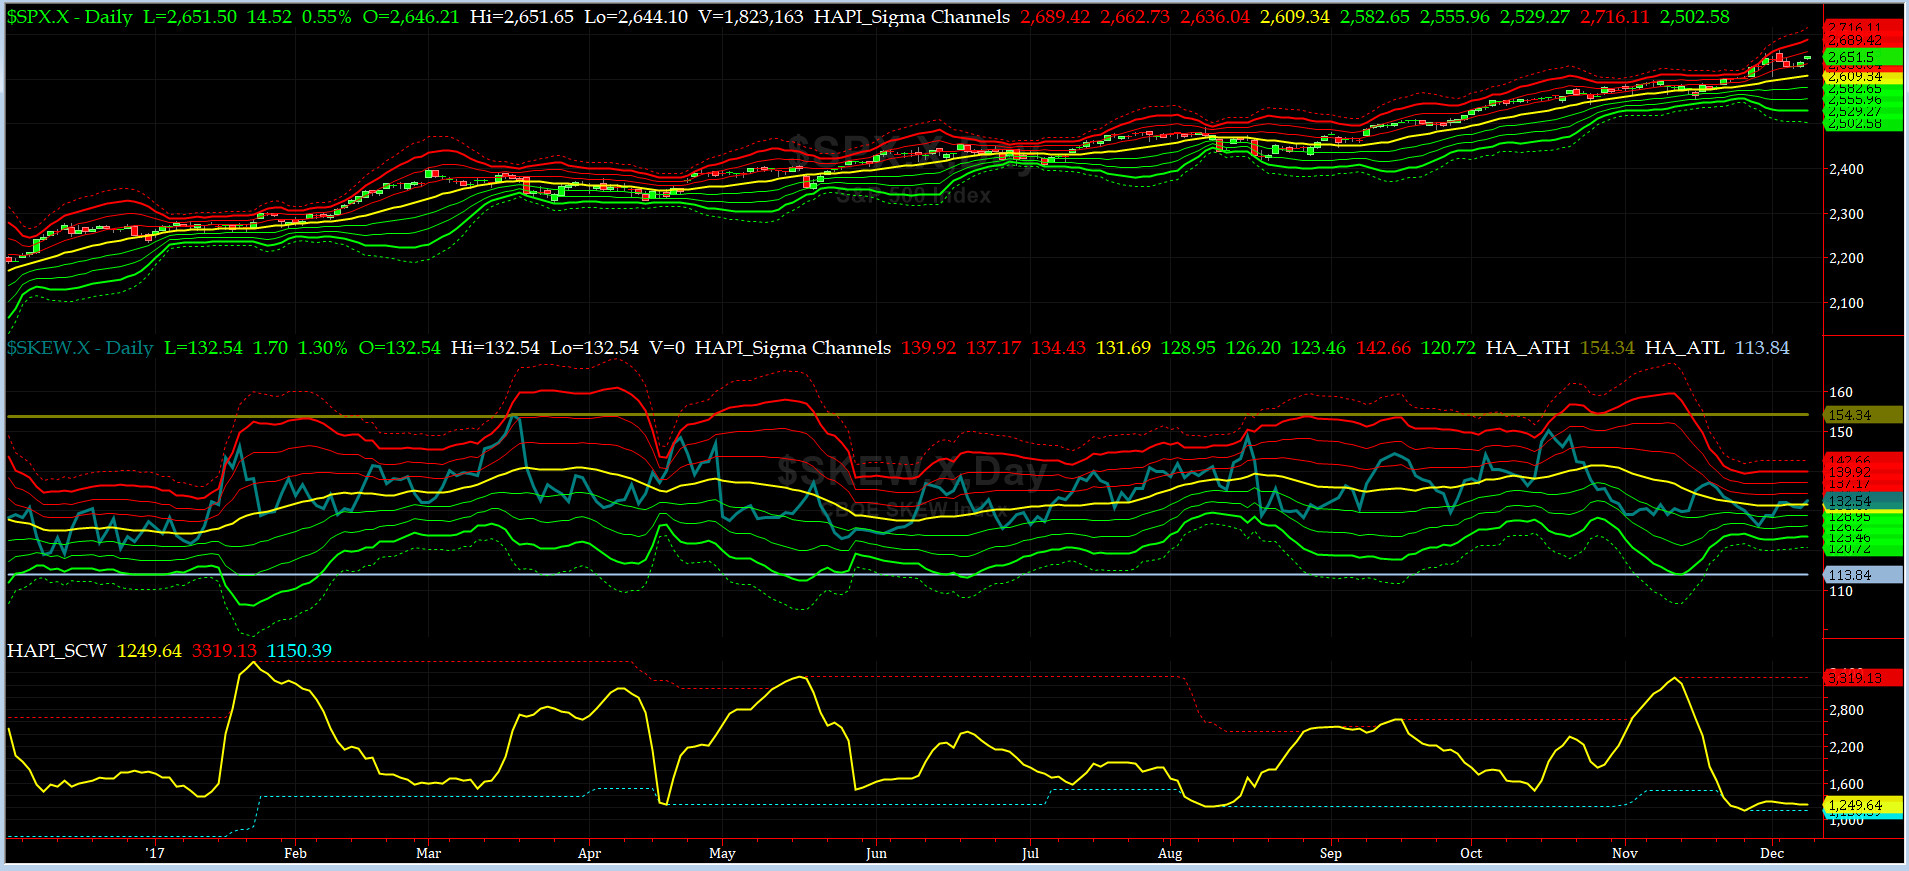
SPX SKEW (Tail Risk) Chart
Last week SPX SKEW (Tail Risk) closed at ~132, or about its zero sigma (normal = 120-125, range 100-150).
Is all quiet on the Eastern & Mid-Western Fronts? Smart Money says YES.
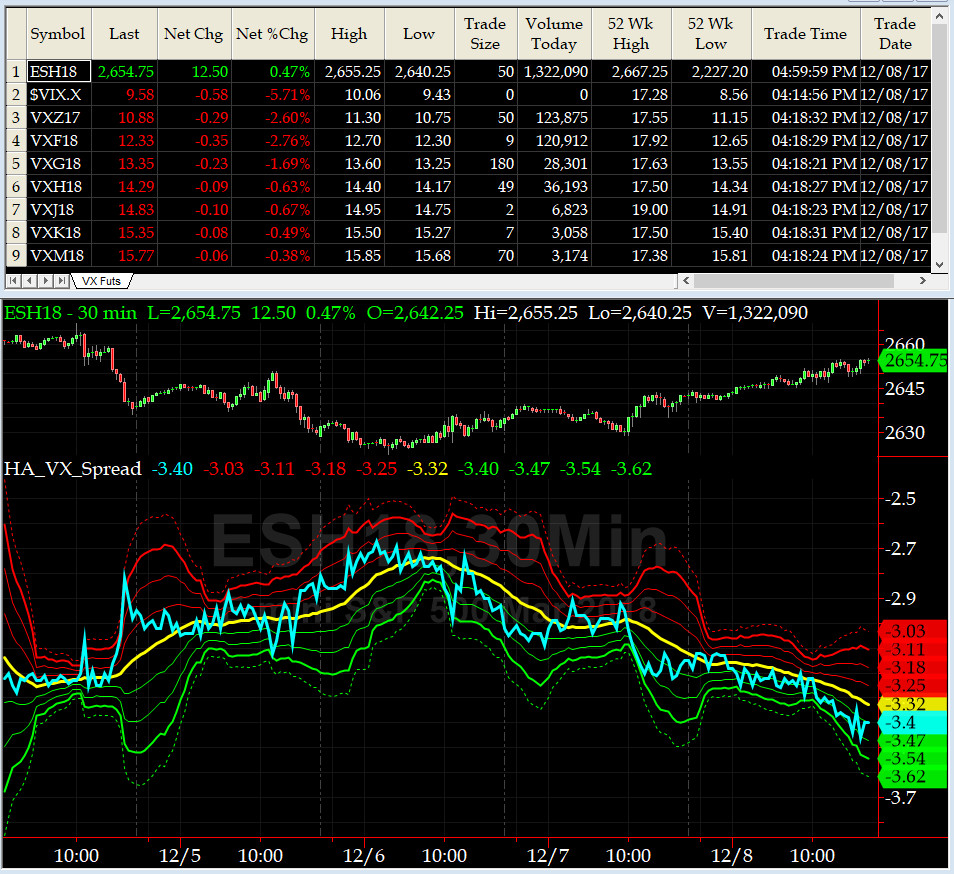
3-month VIX Futures Spread(VX) Chart
Oh what a day this timing indicator had on Friday before closing at -3.4. Equity markets are still in short-term overbought zone.
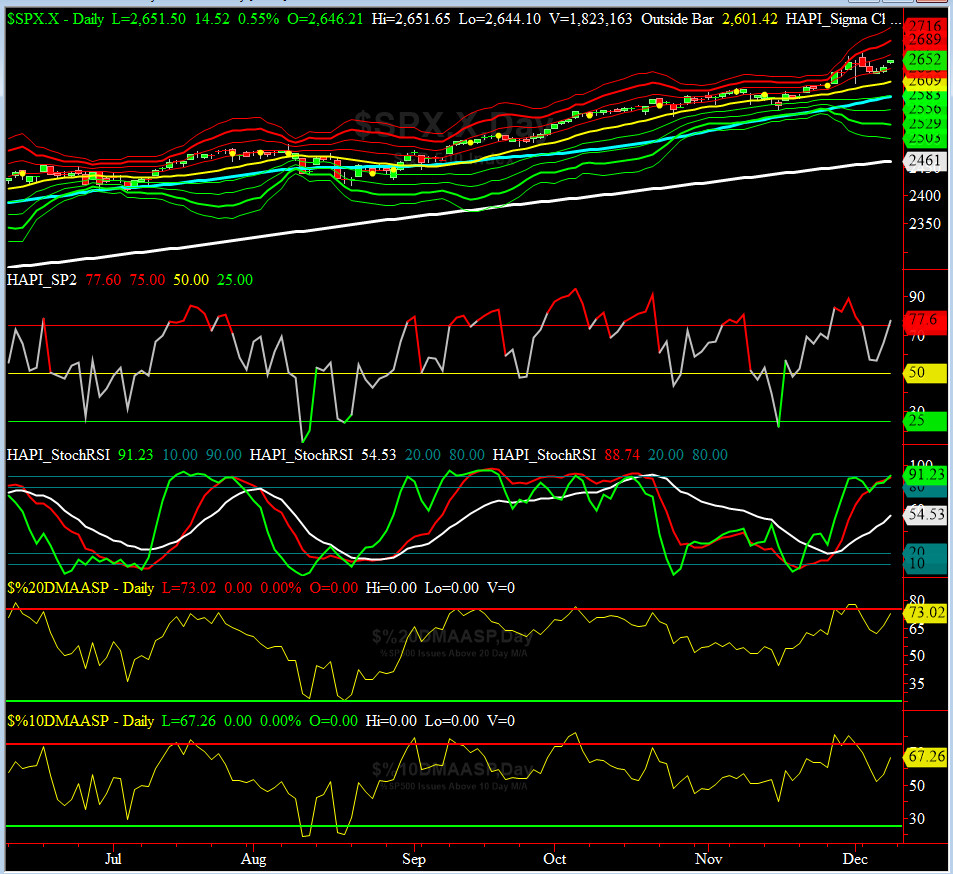
HA_SP2 Chart
HA_SP2 = 77.6 (Buy signal <= 25, Sell Signal >= 75)
We saw a pretty strong rally in our favorite prop indicator, from 57 on Wednesday to over 77 by Friday. We are still in mildly overbought condition.
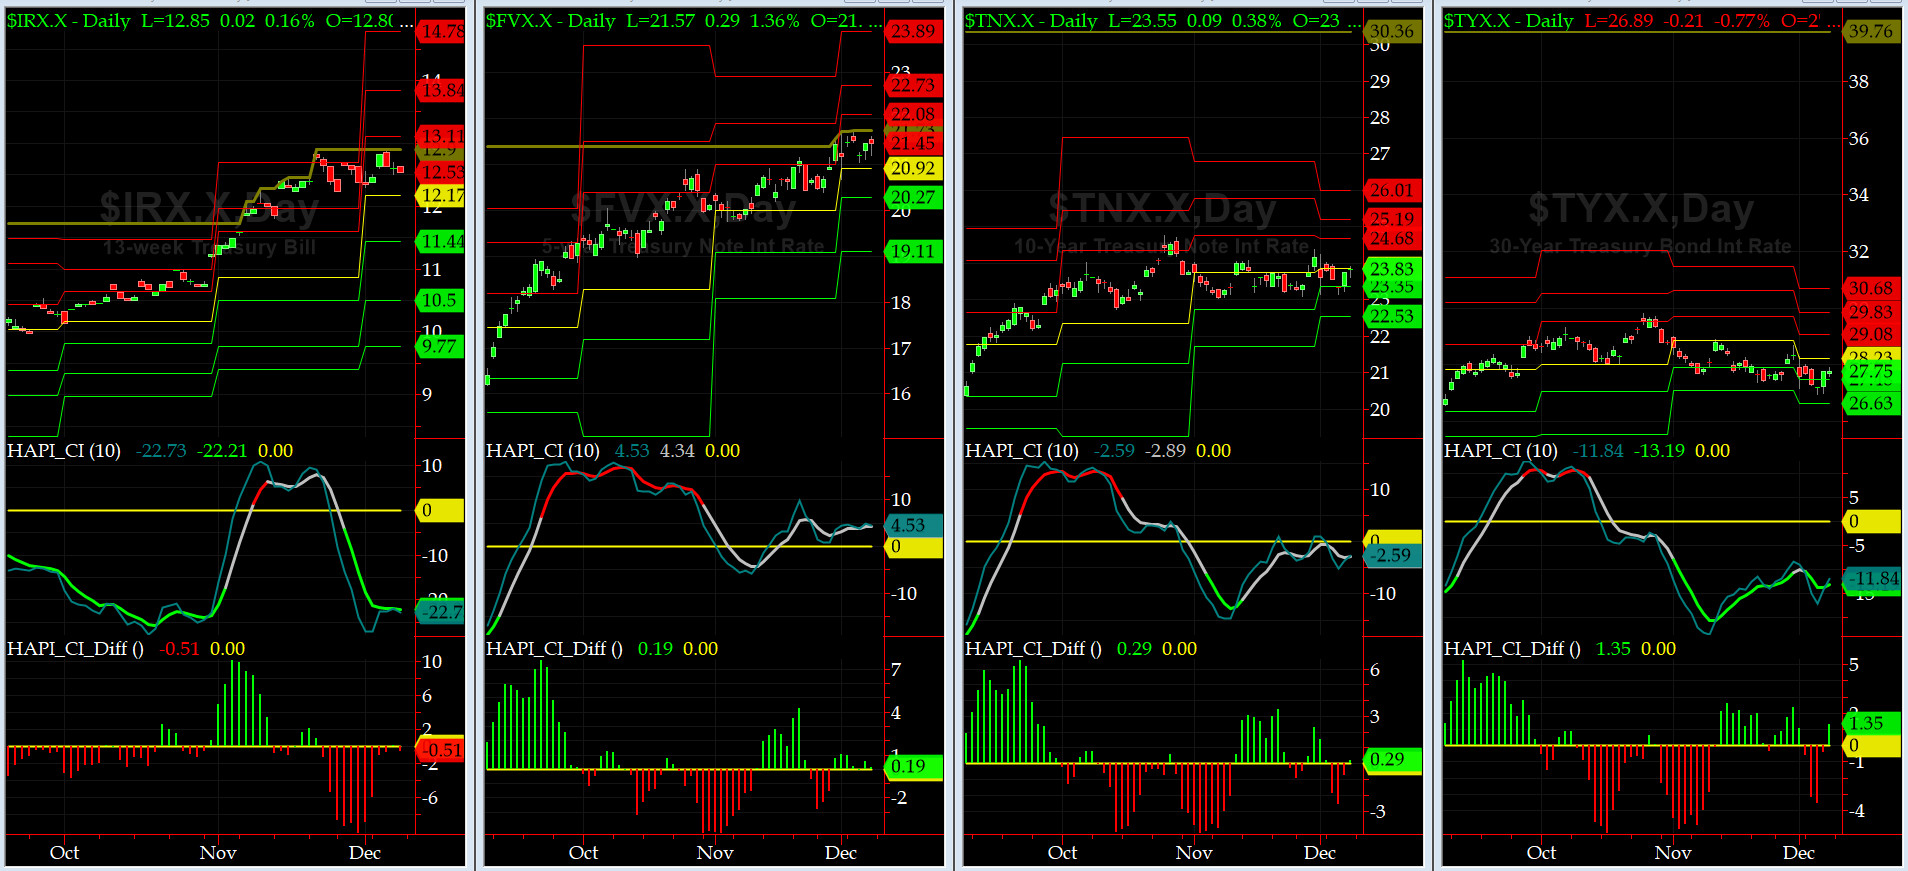
US Treasury T-Notes & T-Bonds Yields Chart
This past week, again our Treasury Market went nowhere fast as evidenced by sideway action in YTMs.
Fari Hamzei
|


 Proactive Market Timing